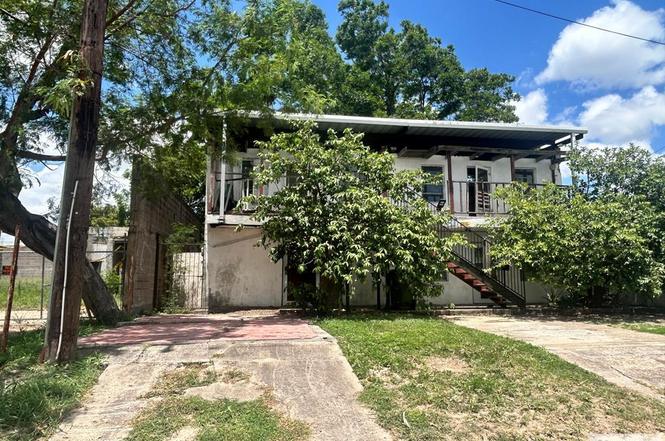
1447 Lincoln Dr · Brownsville, TX
Flood risk 1/10 · Minimal
- FEMA flood zone
- X (unshaded)
- Chance of flooding over 30 yrs
- 0.0%
- Est. flood insurance / yr
- $507 – $1,088
Fire risk 1/10 · Minimal
- Est. fire insurance / yr
- $1,222 – $2,270
Heat risk 9/10 · Severe
- Hot days now (above 111°F)
- 7 days/yr
- Hot days in 30 yrs
- 25 days/yr
Wind risk 9/10 · Severe
- Chance of severe wind over 30 yrs
- 99.0%
Air-quality risk 3/10 · Minor
- Unhealthy air days now
- 2 days/yr
- Unhealthy air days in 30 yrs
- 3 days/yr
Risk factors via First Street. Map © Google.
Why this score? — see what drove the B grade
The composite is a weighted blend of 9 inputs, each scored 0–100. Each bar is that input's sub-score; the figure is the points it added to the 100-point composite (weight × sub-score).
- Cash flow +30.0/30.0
- 1% rule +10.0/10.0
- DSCR +10.0/10.0
- ARV discount +7.5/15.0
- Rent growth +5.0/5.0
- Livability +4.0/5.0
- Condition / age +2.5/5.0
- Schools +2.2/10.0
- Appreciation +0.0/10.0
$109,995
🖨 Deal sheet (PDF) 📄 Offer letter ✓ Due diligence
Listing remarks MLS
OWNER FINANCING AVAILABLE! Value-Add 4-Plex Near the Expressway – Investor Special! Unlock the potential in this diamond-in-the-rough 4-plex, ideally located just one street off the expressway! Whether you're flipping or holding, this is your chance to add value and build equity in a high-demand rental market. Each unit is a blank canvas ready for your renovation vision. Perfect for investors looking to boost cash flow or create a modern multi-family retreat in a location tenants will love. Strong upside, excellent accessibility, and endless possibilities!
Key facts
- 2,499 sq ft lot
- 3 parking spots
- Built 1935
Tags
Property features AI
Finance
- Other: Property sits on approximately 2,500 sq. ft. lot (25 x 97); Total building area approximately 2,762 square feet; Located in a single-unit community
- HOA & community: No homeowners association
Exterior
- Parking: Three covered parking spaces; Three-car carport; No garage
- Utilities: Water service available; One separate water meter
- Home design: Block and other construction; Composition shingle roof; Slab foundation
- Construction: Built with block and other materials; Slab foundation; Composition shingle roof
- Exterior features: Chain link fencing; Paved road access; Outbuilding on the property
Interior
- Kitchen: No conveying appliances
- Flooring: Other flooring
- Interior features: No specific interior features listed
- Laundry & utility: Designated laundry area; Water heater not included
Neighborhood map
What this means for you Summary
Snapshot
- This is a 4-bed/4.0-bath other listed at $110k.
Deal economics
- At list price, monthly cash flow is $744 ($9k/yr) — positive.
- The deal already cash-flows at list — no discount required.
- Meets the 1% rule at list price ($2k rent vs $110k).
- Recommended offer: $97k (12.0% below list) — sets the bar for market timing.
- Cap rate 14.4% vs local median 5.0% in Brownsville — top-decile yield for the area; either an underpriced asset or a hidden risk that comps aren't pricing in. Stress-test before assuming the spread holds.
Location & tenants
- Location reads 79/100 on livability (#62 in TX, #2,311 nationally) — a middle-class / working-renter tenant base. Strengths: commute A+, cost of living A+, housing A+; Watch: amenities D, crime D-, employment F.
- Brownsville ISD (urban): math 20% / reading 34% proficiency, ranked #710 of 826 in TX (top 86%) — low school quality limits family demand, transient renter base, plan for 1-2y turnover; 83% free/reduced lunch — lower-income household profile, screen leases tightly.
- Zoned schools: Martin El (math 27% / reading 37%, grade F, #2,268 of 4,322 statewide, top 55%, 438 students, 88% FRL); Stell Middle (math 12% / reading 26%, grade F, #1,466 of 1,662 statewide, top 89%, 781 students, 96% FRL).
- Market conditions: Rents rising fast (+11.4%/yr); 346 active listings in the ZIP; 5 comparable units currently listed for rent nearby; rentals lingering (median 45d on market — plan ~5-8 weeks vacancy on turnover, expect pricing pressure); 60% of comp listings sitting > 30 days — soft ceiling on asking rent; 2,326 units permitted in Cameron County in 2024 (503 in 5+ unit buildings).
- This rent runs 45% of the median local income ($50k/yr) — at the standard rent-burdened threshold; future hikes will face affordability resistance.
Forward outlook
- Local home prices are declining (-3.0%/yr); year-one equity from $760 of loan paydown is wiped out by about $3k of value loss. Plan a longer hold.
- Cameron County population projected at +3% by 2050 — modest demand growth; plan on rents tracking national, not racing it.
- At projected returns (-3.0% appreciation + 8.0% rent growth), your $31k cash investment doubles in ~4 years — after that, you're playing with house money.
Negotiation context
- It's been on market 323 days — a 12% lower offer ($97k) is reasonable based on typical stale-listing flexibility.
- 2 sale attempts; this cycle's ask has dropped $10k (8%) from the opening price — seller is motivated, your offer sets the floor, not the list.
Risks & watch-outs
- Watch-outs: built in 1935 — expect roof / HVAC / electrical / plumbing capex.
- Climate carrying-cost: severe wind risk, 99% chance of damaging wind over 30y; extreme-heat days projected 7→25/yr by 2055 (HVAC capex compounding) — expect insurance premiums to compound above CPI over the hold.
Questions for the listing agent
- It's been on market 323 days. Have you received any prior offers? Is the seller open to a 12% concession, seller financing, or rate buy-down credit?
- Built in 1935 — when were the roof, HVAC, electrical panel, plumbing, and water heater last replaced?
- Why hasn't it sold? Are there any deal-killer items the seller is aware of (foundation, flood, title, zoning, code violations)?
- Is there a deadline driving the sale (1031 exchange, divorce, estate, relocation)? That informs how much negotiation room exists.
- Crime grade is D in this area — have there been break-ins, vandalism, or insurance claims at this property in the last 3 years? What carrier currently insures it and at what premium?
- What's the average days-on-market for RENTAL listings here right now (not sales)? A rising rental-DOM trend means longer vacancies and softer asking-rent achievability than the comps imply.
- What's the recent tenant-quality profile in this submarket — average credit score on applications, eviction rate, late-payment / NSF rate, and stable-employment percentage? A property-management company in the area should have these aggregated.
- How much new for-sale + rental construction is in the pipeline within 1–3 miles? Heavy new supply typically softens prices + rents 12–24 months out; constrained supply supports both.
Investment metrics
- 1% rule
- 1.70% ✓
- Cap rate
- 14.41%
- Cash-on-cash
- 29.00%
- DSCR
- 2.29
- GRM
- 4.9
CMA / ARV
No comps found within radius.
Projected returns pro-forma
-3.0% appreciation · 8.0% rent growth · sell at horizon
- IRR
- 28.8%
- Equity multiple
- 2.28×
- Total profit
- $39,447
- Equity at exit
- $16,401
- IRR
- 39.0%
- Equity multiple
- 5.55×
- Total profit
- $140,281
- Equity at exit
- $9,510
Cash invested: $30,799 (down + closing). Projections, not guarantees.
Landlord ↔ Tenant lean methodology
- Overall (STATE)
- 87 Strongly Landlord-Friendly
- State Texas
- 87 Strongly Landlord-Friendly · R+5
- County
- — inherits STATE
- City
- — inherits STATE
ZIP-level market 78520
- Home prices YoY
- -19.8%
- Rents YoY
- 11.4%
- Active inventory
- 346
- Price-to-rent
- 4.9×
Monthly cashflow live
- Estimated rent
- $1,865 high interval (Pro) →
- Mortgage (P&I)
- −$577
- Tax from tax record
- −$106 /mo · $1,272/yr
- Insurance
- −$46
- HOA
- −$0
- Vacancy / Maint / Mgmt
- −$392
- Net cashflow
- $744
Break-even live
Sensitivity live
| Price | -10% $807 | -5% $775 | +0% $744 | +5% $713 | +10% $682 |
|---|---|---|---|---|---|
| Rent | -10% $597 | -5% $671 | +0% $744 | +5% $818 | +10% $892 |
| Rate | -1.0pp $800 | -0.5pp $772 | base $744 | +0.5pp $716 | +1.0pp $687 |
UW: 25.0% down · 7.5% · 30yr · 1.5% tax · 5.0% vac · 8.0% maint · 8.0% mgmt
Financing live
Cash to close
- Down payment
- $27,499
- Closing costs
- $3,300
- Reserves months
- —
- Total cash needed
- —
Loan-product check · same deal, 3 products live
Conventional
25% down · 7.5% · 30yr
- Down + closing
- —
- Monthly P&I
- —
- Monthly cashflow
- —
- DSCR
- —
- Eligible?
- —
Personal DTI + credit; lowest rate.
DSCR
20% down · 8.5% · 30yr
- Down + closing
- —
- Monthly P&I
- —
- Monthly cashflow
- —
- DSCR
- —
- Eligible?
- —
No personal income docs; deal must DSCR.
Hard money
10% down · 12.0% · 12mo
- Down + closing
- —
- Monthly P&I
- —
- Monthly cashflow
- —
- DSCR
- —
- Eligible?
- —
Short-term bridge; refi at stabilization.
Rent comps 5 comps
| Address | Beds | Baths | Sqft | Rent | $/sqft | DOM | Units | Dist |
|---|---|---|---|---|---|---|---|---|
| 2024 E 19th St Brownsville, TX | 3.0 | 1.0 | 1259 | $2,000 | $1.59 | 22d | 1 | 0.37mi |
| 835 E Taylor St Unit B Brownsville, TX | 3.0 | 2.0 | 1150 | $1,550 | $1.35 | 44d | 1 | 0.51mi |
| 515 Mc Davitt Blvd Brownsville, TX | 4.0 | 2.0 | 1272 | $1,300 | $1.02 | 44d | 1 | 0.76mi |
| 3075 E 23rd St Brownsville, TX | 3.0 | 2.0 | 1350 | $1,375 | $1.02 | 44d | 1 | 0.88mi |
| 30 W Monroe St Brownsville, TX | 3.0 | 2.0 | 2191 | $1,500 | $0.68 | 22d | 1 | 1.21mi |
Listing history 8 events
-
2026-04-29status Pending
-
2026-04-13historical Option
-
2026-04-08status Pending 568-char remark
Show marketing remark (568 chars)
OWNER FINANCING AVAILABLE! Value-Add 4-Plex Near the Expressway – Investor Special! Unlock the potential in this diamond-in-the-rough 4-plex, ideally located just one street off the expressway! Whether you're flipping or holding, this is your chance to add value and build equity in a high-demand rental market. Each unit is a blank canvas ready for your renovation vision. Perfect for investors looking to boost cash flow or create a modern multi-family retreat in a location tenants will love. Strong upside, excellent accessibility, and endless possibilities!
-
2026-01-05price $109,995 568-char remark
Show marketing remark (568 chars)
OWNER FINANCING AVAILABLE! Value-Add 4-Plex Near the Expressway – Investor Special! Unlock the potential in this diamond-in-the-rough 4-plex, ideally located just one street off the expressway! Whether you're flipping or holding, this is your chance to add value and build equity in a high-demand rental market. Each unit is a blank canvas ready for your renovation vision. Perfect for investors looking to boost cash flow or create a modern multi-family retreat in a location tenants will love. Strong upside, excellent accessibility, and endless possibilities!
-
2026-01-05price $109,995
Show marketing remark (568 chars)
OWNER FINANCING AVAILABLE! Value-Add 4-Plex Near the Expressway – Investor Special! Unlock the potential in this diamond-in-the-rough 4-plex, ideally located just one street off the expressway! Whether you're flipping or holding, this is your chance to add value and build equity in a high-demand rental market. Each unit is a blank canvas ready for your renovation vision. Perfect for investors looking to boost cash flow or create a modern multi-family retreat in a location tenants will love. Strong upside, excellent accessibility, and endless possibilities!
-
2025-06-06$120,000 Active
Show marketing remark (568 chars)
OWNER FINANCING AVAILABLE! Value-Add 4-Plex Near the Expressway – Investor Special! Unlock the potential in this diamond-in-the-rough 4-plex, ideally located just one street off the expressway! Whether you're flipping or holding, this is your chance to add value and build equity in a high-demand rental market. Each unit is a blank canvas ready for your renovation vision. Perfect for investors looking to boost cash flow or create a modern multi-family retreat in a location tenants will love. Strong upside, excellent accessibility, and endless possibilities!
-
2025-06-06$120,000 Active 568-char remark
Show marketing remark (568 chars)
OWNER FINANCING AVAILABLE! Value-Add 4-Plex Near the Expressway – Investor Special! Unlock the potential in this diamond-in-the-rough 4-plex, ideally located just one street off the expressway! Whether you're flipping or holding, this is your chance to add value and build equity in a high-demand rental market. Each unit is a blank canvas ready for your renovation vision. Perfect for investors looking to boost cash flow or create a modern multi-family retreat in a location tenants will love. Strong upside, excellent accessibility, and endless possibilities!
-
2019-12-17soldstatus
ⓘ Source: listings_history table (triggers on properties + properties_extension) + one-shot
backfill from property_details.listing_events for pre-trigger history.
Tax reassessment forecast TX · Resets to sale price
- Current annual tax
- $1,272 · $106/mo
- Projected year-2 tax
- $2,013 · $168/mo
- Expected delta
- +$741/yr (+$62/mo · 58.2%)
ⓘ Screening estimate from a state-policy table — verify with the county assessor before closing.
Climate risk First Street
- Flood 1/10 Low FEMA zone X (unshaded) · 0% chance over 30 yrs
- Wildfire 1/10 Low
- Heat 9/10 Extreme 7 d/yr ≥111°F today · 25 d/yr by 30 yrs out
- Wind 9/10 Extreme 99% chance of damaging wind over 30 yrs
- Air quality 3/10 Moderate 2 unhealthy d/yr today · 3 by 30 yrs out
Nearby sold comps map
Loading sold comps map…
Walkable amenities ~0.75 mi
Loading nearby amenities…
Taxation est. · year 1
- Rental income
- $22,375
- − Mortgage interest
- −$6,161
- − Property taxes
- −$1,272
- − Insurance
- −$550
- − Repairs & maintenance
- −$1,790
- − Management
- −$1,790
- − Depreciation
- −$3,200
- Taxable income
- $7,612
- Est. tax owed @ 24.0%
- −$1,827
- After-tax cash flow
- $7,105/yr
For passive investors: Depreciation is non-cash, so a rental often shows a tax loss while cash-flowing — sheltering income. Rental losses are passive: they offset passive income freely, and up to $25,000/yr can offset ordinary (W-2) income if you actively participate and your MAGI is under $100k (phasing out to $0 by $150k); unused losses carry forward. On sale, claimed depreciation is recaptured at up to 25%, and gains may owe capital-gains tax (a 1031 exchange can defer both). Figures are a year-1 estimate at your 24.0% rate — not tax advice; consult a CPA.
Schools (NCES district)
- District
- Brownsville ISD
- NCES district ID
- 4811680
- Math proficiency
- 20% ▼ -36.00%
- Reading proficiency
- 34% ▼ -13.00%
- Median HH income
- $30,490
- Composite
- 21.8/100
- National rank
- #8249
- State rank
- #710 of 826 in TX
Livability — Brownsville
- Score
- 79/100
- State rank
- #62
- US rank
- #2311
Category grades
Schools grade is shown separately in the Schools card above.
Census & demographics
- Census place
- Brownsville, TX
- County
- Cameron County · 310,734 people
- City population
- 212,132
- Metro
- Brownsville-Harlingen, TX
- Population (ZIP)
- 64,740
- Household income
- $50,116
- Rent vs Own
- Severe rent burden
- 1800.0
Population outlook (Cameron County) Hauer SSP2
- Today (2025)
- 441,603 people
- By 2030
- 448,113 · +1.5%
- By 2040
- 456,385 · +3.3%
- By 2050
- 456,294 · +3.3%
- By 2075
- 423,851 · -4.0%
- By 2100
- 342,787 · -22.4%
Race, ethnicity, and origin ACS 2023
- Neighborhood character
- Predominantly Hispanic (93%)
- Race & ethnicity
- Hispanic / Latino 93% Two or more races 44% White 6%
- Hispanic origin (detail)
- Mexican 88%
- Foreign-born
- 26% · Canada
- Languages at home
- 18% English-only · Spanish 82%
Political lean MEDSL · Cameron
- 2024 margin
- Lean R (+5.8) · D 46.7% · R 52.5%
- 2008→2024 swing
- -34.6pp toward R · 2008: 28.8pp · 2024: -5.8pp
- All cycles
- 2024: R+5.8 2020: D+13.2 2016: D+32.5 2012: D+32.4 2008: D+28.8
Not yet ingested
- Civics
- —
Market trends
- HPI YoY
- ▼ -52.91%
- Current HPI
- 214.4335
- Rent YoY
- ▲ 11.41%
- Metro
- Brownsville-Harlingen, TX
- State GDP YoY
- ▲ 3.95%
- F500 in state
- 110
Industry mix (Fortune 500 HQ in TX)
| Industry | F500 HQs | Revenue |
|---|---|---|
| Energy | 16 | $1,198B |
|
||
| Technology | 5 | $198B |
|
||
| Engineering / Construction | 4 | $72B |
|
||
| Energy Services | 3 | $60B |
|
||
| Utilities | 3 | $41B |
|
||
| Healthcare | 2 | $330B |
|
||
Price history
-8.3% since first listed8 events — show timeline
- 2026-04-29 Pending — MCALLENMLS
- 2026-04-13 Contingent — MCALLENMLS
- 2026-04-08 Pending — RGVMLS
- 2026-01-05 Price Changed $109,995 RGVMLS
- 2026-01-05 Price Changed $109,995 MCALLENMLS
- 2025-06-06 Listed $120,000 RGVMLS
- 2025-06-06 Listed $120,000 MCALLENMLS
- 2019-12-17 Sold (Public Records) — Public Records
Property tax history
+1.4%/yrLatest (2025): $1,272 · -8.9% YoY. Source: county tax records.
Cash-flow waterfall
monthlySold comps — $/sqft
last 12 mo · ≤1 miLoading sold comps…