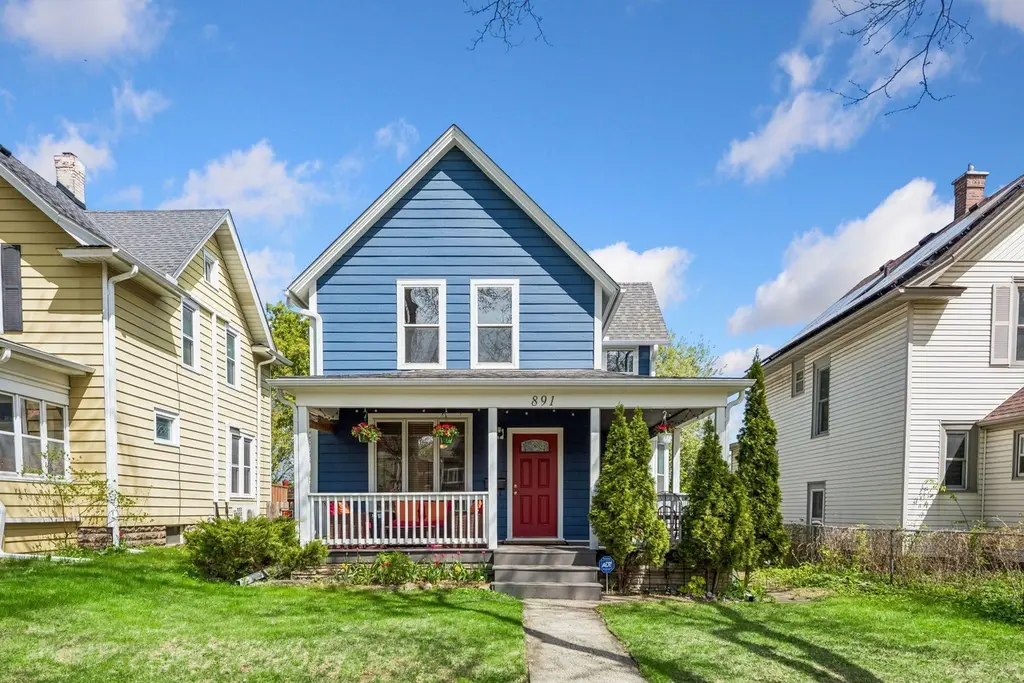
891 Carroll Ave · St. Paul, MN
Flood risk 1/10 · Minimal
- FEMA flood zone
- X (unshaded)
- Chance of flooding over 30 yrs
- 0.0%
- Est. flood insurance / yr
- $473 – $860
Fire risk 1/10 · Minimal
- Est. fire insurance / yr
- $888 – $1,650
Heat risk 2/10 · Minimal
- Hot days now (above 99°F)
- 7 days/yr
- Hot days in 30 yrs
- 14 days/yr
Wind risk 2/10 · Minimal
- Chance of severe wind over 30 yrs
- —
Air-quality risk 2/10 · Minimal
- Unhealthy air days now
- 1 days/yr
- Unhealthy air days in 30 yrs
- 1 days/yr
Risk factors via First Street. Map © Google.
Why this score? — see what drove the F grade
The composite is a weighted blend of 9 inputs, each scored 0–100. Each bar is that input's sub-score; the figure is the points it added to the 100-point composite (weight × sub-score).
- Cash flow +9.7/30.0
- ARV discount +7.5/15.0
- 1% rule +3.3/10.0
- Rent growth +3.1/5.0
- DSCR +2.8/10.0
- Livability +2.5/5.0
- Condition / age +2.5/5.0
- Schools +2.4/10.0
- Appreciation +0.0/10.0
$375,000
🖨 Deal sheet 📄 Offer letter ✓ Due diligence
Listing remarks MLS
FINISHING TOUCHES NOW COMPLETE, THIS IS SURE TO PLEASE! NEW WOOD BLINDS ON MAIN FLR,NEW KIT CABINETS,SS APPLS.NEW BATHROOM VANITIES,TUB & SHOWER.NEW MAPLE FLRS IN LR,DR & ENTRY.NEW CARPET & PAINT.2ND FLR LAUNDRY. NEW 2 CAR GAR.
Key facts
- 4,878 sq ft lot
- 2 garage spots
- Built 1900
Property features AI
Exterior
- Parking: Detached or attached 2-car garage
- Utilities: City water connected; City sewer connected; Natural gas
- Home design: Residential property; Two levels; Entry facing city street
- Construction: Stone foundation; Asphalt roof (age 8 years or less)
- Exterior features: Front porch; Side porch; Wrap-around porch; City street frontage; Publicly maintained road
Interior
- Kitchen: Dishwasher; Disposal; Microwave; Range; Refrigerator; Stainless steel appliances
- Bedrooms: 4 bedrooms (multiple upper-level bedrooms)
- Bathrooms: One full bathroom; One three-quarter bathroom; One half bathroom; Primary suite with private and 3/4 bath
- Heating & cooling: Forced air heating; Central air conditioning
- Interior features: Den; Separate/formal dining room; Living room; Unfinished basement; 3 BR on one level; 4 BR on one level; 2nd floor laundry
- Laundry & utility: Washer; Dryer; Upper-level laundry; Humidifier; Gas water heater
Neighborhood map
What this means for you Summary
Snapshot
- This is a 4-bed/2.5-bath single-family listed at $375k.
Deal economics
- At list price, monthly cash flow is $-244 ($-3k/yr) — negative.
- To cash-flow at today's rent, offer at most $332k (11.5% below list).
- To meet the 1% rule (rent ≥ 1% of price), the offer needs to be $313k (16.6% below list).
- Recommended offer: $313k (16.6% below list) — sets the bar for 1% rule.
Location & tenants
- Location reads: area grade F — affects rentability + tenant quality, not the cash-flow math above.
- St. Paul Public School District (urban): math 21% / reading 33% proficiency, ranked #270 of 301 in MN (top 90%) — low school quality limits family demand, transient renter base, plan for 1-2y turnover; 64% free/reduced lunch — lower-income household profile, screen leases tightly.
- Market conditions: Rents rising (+2.5%/yr); 191 active listings in the ZIP; 2 comparable units currently listed for rent nearby; solid renter incomes; 1,202 units permitted in Ramsey County in 2024 (880 in 5+ unit buildings).
- At $3,128/mo this rent would consume 50% of the median local household income ($76k/yr) (locally 2116% of renters already pay >50% of income on rent) — very limited rent-growth headroom before tenants either downsize or default.
Forward outlook
- Local home prices are declining (-3.0%/yr); year-one equity from $3k of loan paydown is wiped out by about $11k of value loss. Plan a longer hold.
- Ramsey County population projected at +27% by 2050 — long-run rental-demand tailwind backs the buy-and-hold thesis.
Negotiation context
- Only 5 days on market — expect competitive offers; lowballing is unlikely to land.
- 11 sale attempts since 23y ago with the ask held roughly flat each time — persistent listings suggest the price (not the market) is what's stuck; bring a comps-based counter.
- Current owner paid $203k; list at $375k implies a 85% gain — meaningful room to come down on a strong offer.
Risks & watch-outs
- Watch-outs: built in 1900 — expect roof / HVAC / electrical / plumbing capex.
Questions for the listing agent
- What do current leases actually rent for vs. the listed asking? Can we see a recent rent roll and the last 12 months of T-12 income?
- Built in 1900 — when were the roof, HVAC, electrical panel, plumbing, and water heater last replaced?
- Is there a deadline driving the sale (1031 exchange, divorce, estate, relocation)? That informs how much negotiation room exists.
- The area grade is low — what's the realistic commute time and amenity access for the typical tenant pool here? Any planned neighborhood developments (good or bad) we should know about?
- What's the average days-on-market for RENTAL listings here right now (not sales)? A rising rental-DOM trend means longer vacancies and softer asking-rent achievability than the comps imply.
- What's the recent tenant-quality profile in this submarket — average credit score on applications, eviction rate, late-payment / NSF rate, and stable-employment percentage? A property-management company in the area should have these aggregated.
- How much new for-sale + rental construction is in the pipeline within 1–3 miles? Heavy new supply typically softens prices + rents 12–24 months out; constrained supply supports both.
Investment metrics
- 1% rule
- 0.83% ✗
- Cap rate
- 5.51%
- Cash-on-cash
- -2.79%
- DSCR
- 0.88
- GRM
- 10.0
CMA / ARV
No comps found within radius.
Projected returns pro-forma
-3.0% appreciation · 2.5% rent growth · sell at horizon
- IRR
- -21.5%
- Equity multiple
- 0.26×
- Total profit
- $-77,752
- Equity at exit
- $55,914
- IRR
- -16.3%
- Equity multiple
- 0.11×
- Total profit
- $-93,580
- Equity at exit
- $32,423
Cash invested: $105,000 (down + closing). Projections, not guarantees.
Landlord ↔ Tenant lean methodology
- Overall (STATE)
- 46 Balanced
- State Minnesota
- 46 Balanced · D+2
- County
- — inherits STATE
- City
- — inherits STATE
ZIP-level market 55104
- Rents YoY
- 2.5%
- Active inventory
- 191
- Price-to-rent
- 10.0×
Monthly cashflow live
- Estimated rent
- $3,128 medium interval (Pro) →
- Mortgage (P&I)
- −$1,967
- Tax from tax record
- −$593 /mo · $7,112/yr
- Insurance
- −$156
- HOA
- −$0
- Vacancy / Maint / Mgmt
- −$657
- Net cashflow
- $-244
Break-even live
UW: 25.0% down · 7.5% · 30yr · 1.5% tax · 5.0% vac · 8.0% maint · 8.0% mgmt
Financing live
Cash to close
- Down payment
- $93,750
- Closing costs
- $11,250
- Reserves months
- —
- Total cash needed
- —
Loan-product check · same deal, 3 products live
Conventional
25% down · 7.5% · 30yr
- Down + closing
- —
- Monthly P&I
- —
- Monthly cashflow
- —
- DSCR
- —
- Eligible?
- —
Personal DTI + credit; lowest rate.
DSCR
20% down · 8.5% · 30yr
- Down + closing
- —
- Monthly P&I
- —
- Monthly cashflow
- —
- DSCR
- —
- Eligible?
- —
No personal income docs; deal must DSCR.
Hard money
10% down · 12.0% · 12mo
- Down + closing
- —
- Monthly P&I
- —
- Monthly cashflow
- —
- DSCR
- —
- Eligible?
- —
Short-term bridge; refi at stabilization.
Rent comps 2 comps
| Address | Beds | Baths | Sqft | Rent | $/sqft | DOM | Units | Dist |
|---|---|---|---|---|---|---|---|---|
| 255 Western Ave N Saint Paul, MN | 3.0 | 1.0–2.0 | 1049 | $3,700 | $3.53 | 1d | 23 | 1.05mi |
| 1555 Selby Ave Saint Paul, MN | 3.0 | 1.0–2.0 | 1129 | $4,398 | $3.90 | 2d | 7 | 1.39mi |
Listing history 29 events
-
2026-05-22status Pending
-
2026-05-11$375,000 Active
-
2026-05-08historical $375,000
-
2009-12-18soldstatus $203,000
-
2009-12-14soldstatus $203,000 239-char remark
Show marketing remark (239 chars)
FINISHING TOUCHES NOW COMPLETE, THIS IS SURE TO PLEASE! NEW WOOD BLINDS ON MAIN FLR,NEW KIT CABINETS,SS APPLS.NEW BATHROOM VANITIES,TUB & SHOWER.NEW MAPLE FLRS IN LR,DR & ENTRY.NEW CARPET & PAINT.2ND FLR LAUNDRY. NEW 2 CAR GAR.
-
2009-11-23historical 239-char remark
Show marketing remark (239 chars)
FINISHING TOUCHES NOW COMPLETE, THIS IS SURE TO PLEASE! NEW WOOD BLINDS ON MAIN FLR,NEW KIT CABINETS,SS APPLS.NEW BATHROOM VANITIES,TUB & SHOWER.NEW MAPLE FLRS IN LR,DR & ENTRY.NEW CARPET & PAINT.2ND FLR LAUNDRY. NEW 2 CAR GAR.
-
2009-11-11$199,900 239-char remark
Show marketing remark (239 chars)
FINISHING TOUCHES NOW COMPLETE, THIS IS SURE TO PLEASE! NEW WOOD BLINDS ON MAIN FLR,NEW KIT CABINETS,SS APPLS.NEW BATHROOM VANITIES,TUB & SHOWER.NEW MAPLE FLRS IN LR,DR & ENTRY.NEW CARPET & PAINT.2ND FLR LAUNDRY. NEW 2 CAR GAR.
-
2009-11-11historical
Show marketing remark (239 chars)
FINISHING TOUCHES NOW COMPLETE, THIS IS SURE TO PLEASE! NEW WOOD BLINDS ON MAIN FLR,NEW KIT CABINETS,SS APPLS.NEW BATHROOM VANITIES,TUB & SHOWER.NEW MAPLE FLRS IN LR,DR & ENTRY.NEW CARPET & PAINT.2ND FLR LAUNDRY. NEW 2 CAR GAR.
-
2009-10-12$199,900
-
2009-05-13historical
-
2009-03-31soldstatus $34,900
-
2009-03-03$29,900
-
2009-02-28historical
-
2009-01-31$29,900
-
2009-01-30historical
-
2008-11-10$34,900
-
2008-11-09historical
-
2008-10-23$49,900
-
2008-10-16historical
-
2008-05-01$54,900
-
2008-04-04historical
-
2008-01-17$64,900
-
2007-10-30historical
-
2007-06-05$135,000
-
2003-02-19historical
-
2003-02-11$154,900
-
2002-07-25soldstatus $125,000
-
2002-06-17soldstatus $88,000
-
1991-12-13soldstatus $59,000
ⓘ Source: listings_history table (triggers on properties + properties_extension) + one-shot
backfill from property_details.listing_events for pre-trigger history.
Tax reassessment forecast MN · Partial reset (capped growth)
- Current annual tax
- $7,112 · $593/mo
- Projected year-2 tax
- $7,112 · $593/mo
- Expected delta
- $0/yr ($0/mo · 0.0%)
ⓘ Screening estimate from a state-policy table — verify with the county assessor before closing.
Climate risk First Street
- Flood 1/10 Low FEMA zone X (unshaded) · 0% chance over 30 yrs
- Wildfire 1/10 Low
- Heat 2/10 Low 7 d/yr ≥99°F today · 14 d/yr by 30 yrs out
- Wind 2/10 Low
- Air quality 2/10 Low 1 unhealthy d/yr today · 1 by 30 yrs out
Nearby sold comps map
Loading sold comps map…
Walkable amenities ~0.75 mi
Loading nearby amenities…
Taxation est. · year 1
- Rental income
- $37,540
- − Mortgage interest
- −$21,006
- − Property taxes
- −$7,112
- − Insurance
- −$1,875
- − Repairs & maintenance
- −$3,003
- − Management
- −$3,003
- − Depreciation
- −$10,909
- Taxable loss
- −$9,368
- Est. tax savings @ 24.0%
- +$2,248
- After-tax cash flow
- $-680/yr
For passive investors: Depreciation is non-cash, so a rental often shows a tax loss while cash-flowing — sheltering income. Rental losses are passive: they offset passive income freely, and up to $25,000/yr can offset ordinary (W-2) income if you actively participate and your MAGI is under $100k (phasing out to $0 by $150k); unused losses carry forward. On sale, claimed depreciation is recaptured at up to 25%, and gains may owe capital-gains tax (a 1031 exchange can defer both). Figures are a year-1 estimate at your 24.0% rate — not tax advice; consult a CPA.
Schools (NCES district)
- District
- St. Paul Public School District
- NCES district ID
- 2733840
- Math proficiency
- 21% ▼ -11.00%
- Reading proficiency
- 33% ▼ -7.00%
- Median HH income
- $48,316
- Composite
- 23.51/100
- National rank
- #7868
- State rank
- #270 of 301 in MN
Livability — St. Paul
No livability data for this city. (Only ~50 U.S. cities are tracked.)
Census & demographics
- Census place
- St. Paul, MN
- County
- Ramsey County · 542,837 people
- City population
- 280,599
- Metro
- Minneapolis-St. Paul-Bloomington, MN-WI
- Population (ZIP)
- 45,762
- Household income
- $75,712
- Rent vs Own
- Severe rent burden
- 2116.0
Population outlook (Ramsey County) Hauer SSP2
- Today (2025)
- 603,431 people
- By 2030
- 636,459 · +5.5%
- By 2040
- 700,596 · +16.1%
- By 2050
- 765,819 · +26.9%
- By 2075
- 929,297 · +54.0%
- By 2100
- 1,053,924 · +74.7%
Race, ethnicity, and origin ACS 2023
- Neighborhood character
- Diverse neighborhood (Simpson 0.60)
- Race & ethnicity
- White 60% Black 19% Two or more races 10% Asian 7% Hispanic / Latino 7%
- Hispanic origin (detail)
- Mexican 4%
- Common ancestry
- Portuguese 8% Romanian 3% Lithuanian 3%
- Foreign-born
- 12% · Canada, Vietnam, China
- Languages at home
- 83% English-only · Spanish 4% Other Asian/Pacific 4% French/Haitian/Cajun 1%
Political lean MEDSL · Ramsey
- 2024 margin
- Solid D (+43.3) · D 70.5% · R 27.2% · Other 2.3%
- 2008→2024 swing
- +9.4pp toward D · 2008: 33.9pp · 2024: 43.3pp
- All cycles
- 2024: D+43.3 2020: D+45.4 2016: D+39.4 2012: D+35.3 2008: D+33.9
Not yet ingested
- Civics
- —
Market trends
- HPI YoY
- ▼ -532.26%
- Current HPI
- 245.6146
- Rent YoY
- ▲ 2.50%
- Metro
- Minneapolis-St. Paul-Bloomington, MN-WI
- State GDP YoY
- ▲ 2.41%
- F500 in state
- 34
Industry mix (Fortune 500 HQ in MN)
| Industry | F500 HQs | Revenue |
|---|---|---|
| Healthcare | 2 | $407B |
|
||
| Retail | 2 | $150B |
|
||
| Consumer Goods | 2 | $32B |
|
||
| Industrial Machinery | 2 | $6B |
|
||
| Agriculture | 1 | $40B |
|
||
| Healthcare / Medical Devices | 1 | $32B |
|
||
Price history
+535.6% since first listed29 events — show timeline
- 2026-05-22 Pending — NORTHSTARMLS as Distributed by MLS Grid
- 2026-05-11 Listed $375,000 NORTHSTARMLS as Distributed by MLS Grid
- 2026-05-08 Coming Soon $375,000 NORTHSTARMLS as Distributed by MLS Grid
- 2009-12-18 Sold (Public Records) $203,000 Public Records
- 2009-12-14 Sold (MLS) $203,000 NORTHSTARMLS as Distributed by MLS Grid
- 2009-11-23 Listing Removed — NORTHSTARMLS as Distributed by MLS Grid
- 2009-11-11 Listing Removed — NORTHSTARMLS as Distributed by MLS Grid
- 2009-11-11 Listed $199,900 NORTHSTARMLS as Distributed by MLS Grid
- 2009-10-12 Listed $199,900 NORTHSTARMLS as Distributed by MLS Grid
- 2009-05-13 Listing Removed — NORTHSTARMLS as Distributed by MLS Grid
- 2009-03-31 Sold (MLS) $34,900 NORTHSTARMLS as Distributed by MLS Grid
- 2009-03-03 Listed $29,900 NORTHSTARMLS as Distributed by MLS Grid
- 2009-02-28 Listing Removed — NORTHSTARMLS as Distributed by MLS Grid
- 2009-01-31 Listed $29,900 NORTHSTARMLS as Distributed by MLS Grid
- 2009-01-30 Listing Removed — NORTHSTARMLS as Distributed by MLS Grid
- 2008-11-10 Listed $34,900 NORTHSTARMLS as Distributed by MLS Grid
- 2008-11-09 Listing Removed — NORTHSTARMLS as Distributed by MLS Grid
- 2008-10-23 Listed $49,900 NORTHSTARMLS as Distributed by MLS Grid
- 2008-10-16 Listing Removed — NORTHSTARMLS as Distributed by MLS Grid
- 2008-05-01 Listed $54,900 NORTHSTARMLS as Distributed by MLS Grid
- 2008-04-04 Listing Removed — NORTHSTARMLS as Distributed by MLS Grid
- 2008-01-17 Listed $64,900 NORTHSTARMLS as Distributed by MLS Grid
- 2007-10-30 Listing Removed — NORTHSTARMLS as Distributed by MLS Grid
- 2007-06-05 Listed $135,000 NORTHSTARMLS as Distributed by MLS Grid
- 2003-02-19 Listing Removed — NORTHSTARMLS as Distributed by MLS Grid
- 2003-02-11 Listed $154,900 NORTHSTARMLS as Distributed by MLS Grid
- 2002-07-25 Sold (Public Records) $125,000 Public Records
- 2002-06-17 Sold (Public Records) $88,000 Public Records
- 1991-12-13 Sold (Public Records) $59,000 Public Records
Property tax history
+6.2%/yrLatest (2025): $7,112 · +12.6% YoY. Source: county tax records.
Cash-flow waterfall
monthlySold comps — $/sqft
last 12 mo · ≤1 miLoading sold comps…