206 S Lyons Ave · Naylor, MO
Flood risk 1/10 · Minimal
- FEMA flood zone
- X (unshaded)
- Chance of flooding over 30 yrs
- 0.0%
- Est. flood insurance / yr
- $473 – $860
Fire risk 1/10 · Minimal
- Est. fire insurance / yr
- $1,054 – $1,958
Heat risk 6/10 · Moderate
- Hot days now (above 108°F)
- 7 days/yr
- Hot days in 30 yrs
- 21 days/yr
Wind risk 3/10 · Minor
- Chance of severe wind over 30 yrs
- 5.0%
Air-quality risk 1/10 · Minimal
- Unhealthy air days now
- 0 days/yr
- Unhealthy air days in 30 yrs
- 0 days/yr
Risk factors via First Street. Map © Google.
Why this score? — see what drove the C+ grade
The composite is a weighted blend of 9 inputs, each scored 0–100. Each bar is that input's sub-score; the figure is the points it added to the 100-point composite (weight × sub-score).
- Cash flow +23.2/30.0
- ARV discount +8.6/15.0
- DSCR +7.5/10.0
- 1% rule +6.1/10.0
- Appreciation +5.0/10.0
- Schools +4.3/10.0
- Livability +3.0/5.0
- Rent growth +2.5/5.0
- Condition / age +2.2/5.0
$80,000
🖨 Deal sheet 📄 Offer letter ✓ Due diligence
Listing remarks MLS
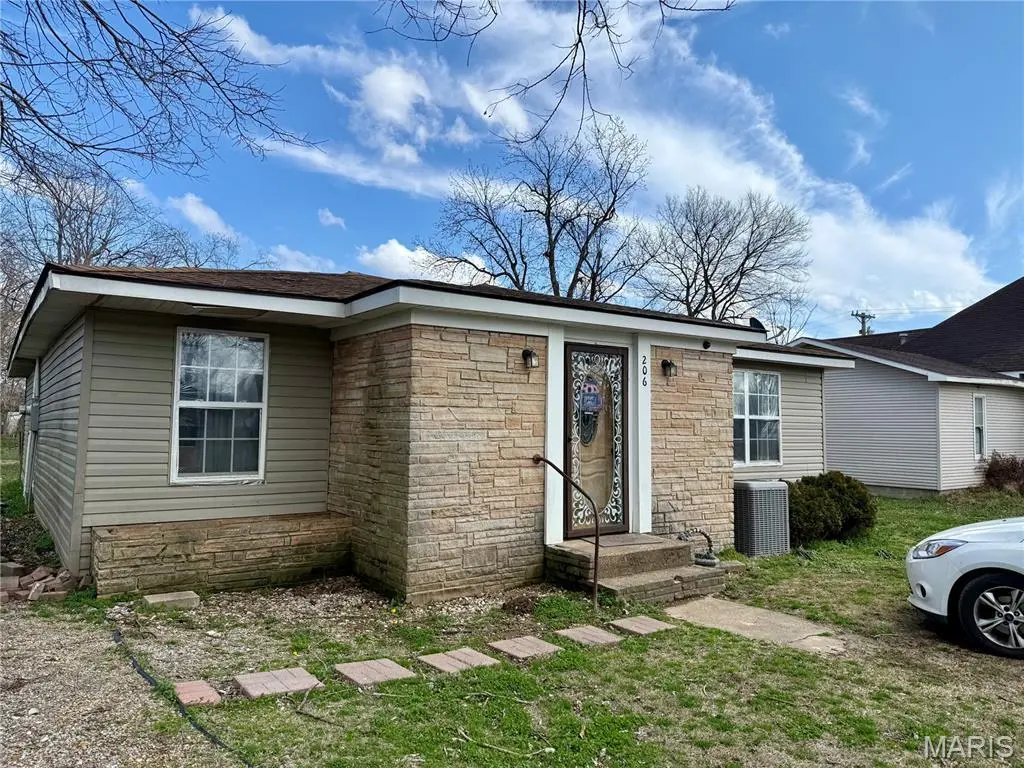
ocated at 206 South Lyons Avenue in Naylor, Missouri, this 2 bedroom, 2 full bathroom home offers approximately 990 square feet of living space with generously sized rooms throughout. Built in 1957, the home sits on a large city lot of approximately 0.29 acres and includes a fenced backyard, providing privacy and outdoor space for recreation or pets. The property also features a detached shop/outbuilding, offering additional storage or workspace. Conveniently located within the city limits of Naylor, this property provides small-town living with plenty of outdoor space.
Key facts
- Large city lot
- Detached shop
- Outdoor space
Tags
Neighborhood map
What this means for you Summary
Snapshot
- This is a 2-bed/2.0-bath single-family listed at $80k. Condition is rated fair.
Deal economics
- At list price, monthly cash flow is $146 ($2k/yr) — positive.
- The deal already cash-flows at list — no discount required.
- Meets the 1% rule at list price ($884 rent vs $80k).
- Recommended offer: $75k (6.0% below list) — sets the bar for market timing.
Location & tenants
- Location reads 59/100 on livability (#537 in MO) — a working-class tenant base; expect higher turnover. Strengths: cost of living A+, housing A+; Watch: health & safety C-, schools D+, crime F.
- Naylor R-II (rural): math 50% / reading 50% proficiency, ranked #138 of 535 in MO (top 26%) — acceptable for families but not a draw, mixed tenant base, ~2y average lease.
- Market conditions: 7 active listings in the ZIP.
Forward outlook
- In year one you build about $3k of equity ($553 loan paydown + $2k appreciation (3.0% local appreciation)).
- Ripley County population projected at -20% by 2050 — secular population decline; favor cash flow + early exit over multi-decade hold.
- At projected returns (3.0% appreciation + 3.0% rent growth), your $22k cash investment doubles in ~5 years — after that, you're playing with house money.
Negotiation context
- It's been on market 79 days — a 6% lower offer ($75k) is reasonable based on typical stale-listing flexibility.
Risks & watch-outs
- Watch-outs: built in 1957 — expect roof / HVAC / electrical / plumbing capex.
- Climate carrying-cost: extreme-heat days projected 7→21/yr by 2055 (HVAC capex compounding) — expect insurance premiums to compound above CPI over the hold.
Questions for the listing agent
- It's been on market 79 days. Have you received any prior offers? Is the seller open to a 6% concession, seller financing, or rate buy-down credit?
- Have any recent inspections been done? Can we get a copy of the seller's disclosures and any deferred-maintenance estimates?
- Built in 1957 — when were the roof, HVAC, electrical panel, plumbing, and water heater last replaced?
- Why hasn't it sold? Are there any deal-killer items the seller is aware of (foundation, flood, title, zoning, code violations)?
- Is there a deadline driving the sale (1031 exchange, divorce, estate, relocation)? That informs how much negotiation room exists.
- Schools are D-rated, which usually means shorter tenancies and higher turnover. Who's the typical renter profile here, and what's been the actual vacancy rate?
- Crime grade is F in this area — have there been break-ins, vandalism, or insurance claims at this property in the last 3 years? What carrier currently insures it and at what premium?
- What's the average days-on-market for RENTAL listings here right now (not sales)? A rising rental-DOM trend means longer vacancies and softer asking-rent achievability than the comps imply.
- What's the recent tenant-quality profile in this submarket — average credit score on applications, eviction rate, late-payment / NSF rate, and stable-employment percentage? A property-management company in the area should have these aggregated.
- How much new for-sale + rental construction is in the pipeline within 1–3 miles? Heavy new supply typically softens prices + rents 12–24 months out; constrained supply supports both.
Investment metrics
- 1% rule
- 1.11% ✓
- Cap rate
- 8.48%
- Cash-on-cash
- 7.80%
- DSCR
- 1.35
- GRM
- 7.5
CMA / ARV
- ARV (median comp)
- $82,000
- List price
- $80,000
- Delta
- -2.44%
- Verdict
- FAIR
- Comps
- 5 within 1.0 mi
Projected returns pro-forma
3.0% appreciation · 3.0% rent growth · sell at horizon
- IRR
- 14.8%
- Equity multiple
- 1.84×
- Total profit
- $18,926
- Equity at exit
- $35,971
- IRR
- 16.5%
- Equity multiple
- 3.43×
- Total profit
- $54,407
- Equity at exit
- $55,436
Cash invested: $22,400 (down + closing). Projections, not guarantees.
Landlord ↔ Tenant lean methodology
- Overall (STATE)
- 81 Strongly Landlord-Friendly
- State Missouri
- 81 Strongly Landlord-Friendly · R+10
- County
- — inherits STATE
- City
- — inherits STATE
ZIP-level market 63953
- Active inventory
- 7
- Price-to-rent
- 7.5×
Monthly cashflow live
- Estimated rent
- $884 medium interval (Pro) →
- Mortgage (P&I)
- −$420
- Tax est. 1.5%
- −$100 /mo · $1,200/yr
- Insurance
- −$33
- HOA
- −$0
- Vacancy / Maint / Mgmt
- −$186
- Net cashflow
- $146
Break-even live
UW: 25.0% down · 7.5% · 30yr · 1.5% tax · 5.0% vac · 8.0% maint · 8.0% mgmt
Financing live
Cash to close
- Down payment
- $20,000
- Closing costs
- $2,400
- Reserves months
- —
- Total cash needed
- —
Loan-product check · same deal, 3 products live
Conventional
25% down · 7.5% · 30yr
- Down + closing
- —
- Monthly P&I
- —
- Monthly cashflow
- —
- DSCR
- —
- Eligible?
- —
Personal DTI + credit; lowest rate.
DSCR
20% down · 8.5% · 30yr
- Down + closing
- —
- Monthly P&I
- —
- Monthly cashflow
- —
- DSCR
- —
- Eligible?
- —
No personal income docs; deal must DSCR.
Hard money
10% down · 12.0% · 12mo
- Down + closing
- —
- Monthly P&I
- —
- Monthly cashflow
- —
- DSCR
- —
- Eligible?
- —
Short-term bridge; refi at stabilization.
Listing history 8 events
-
2026-06-18days on market $80,000 Active 79 DOM
-
2026-06-17days on market $80,000 Active 78 DOM
-
2026-06-16days on market $80,000 Active 77 DOM
-
2026-06-15days on market $80,000 Active 76 DOM
-
2026-06-13days on market $80,000 Active 74 DOM
-
2026-06-12days on market $80,000 Active 73 DOM
-
2026-06-09status $80,000 Active 70 DOM
-
2026-03-11$80,000 Active 578-char remark
Show marketing remark (578 chars)
ocated at 206 South Lyons Avenue in Naylor, Missouri, this 2 bedroom, 2 full bathroom home offers approximately 990 square feet of living space with generously sized rooms throughout. Built in 1957, the home sits on a large city lot of approximately 0.29 acres and includes a fenced backyard, providing privacy and outdoor space for recreation or pets. The property also features a detached shop/outbuilding, offering additional storage or workspace. Conveniently located within the city limits of Naylor, this property provides small-town living with plenty of outdoor space.
ⓘ Source: listings_history table (triggers on properties + properties_extension) + one-shot
backfill from property_details.listing_events for pre-trigger history.
Climate risk First Street
- Flood 1/10 Low FEMA zone X (unshaded) · 0% chance over 30 yrs
- Wildfire 1/10 Low
- Heat 6/10 Major 7 d/yr ≥108°F today · 21 d/yr by 30 yrs out
- Wind 3/10 Moderate 5% chance of damaging wind over 30 yrs
- Air quality 1/10 Low 0 unhealthy d/yr today · 0 by 30 yrs out
Nearby sold comps map
Loading sold comps map…
Walkable amenities ~0.75 mi
Loading nearby amenities…
Taxation est. · year 1
- Rental income
- $10,610
- − Mortgage interest
- −$4,481
- − Property taxes
- −$1,200
- − Insurance
- −$400
- − Repairs & maintenance
- −$849
- − Management
- −$849
- − Depreciation
- −$2,327
- Taxable income
- $504
- Est. tax owed @ 24.0%
- −$121
- After-tax cash flow
- $1,627/yr
For passive investors: Depreciation is non-cash, so a rental often shows a tax loss while cash-flowing — sheltering income. Rental losses are passive: they offset passive income freely, and up to $25,000/yr can offset ordinary (W-2) income if you actively participate and your MAGI is under $100k (phasing out to $0 by $150k); unused losses carry forward. On sale, claimed depreciation is recaptured at up to 25%, and gains may owe capital-gains tax (a 1031 exchange can defer both). Figures are a year-1 estimate at your 24.0% rate — not tax advice; consult a CPA.
Condition & rehab AI · 12 photos
This home requires extensive repairs and maintenance, including a new roof, exterior siding, HVAC system, and windows. Improvements to the interior walls and ceilings, landscaping, and curb appeal can significantly increase its value.
Repairs flagged
- Major roof — The roof appears to be in poor condition, with visible wear and tear.
- Major exterior siding — The siding shows signs of wear and discoloration.
- Major interior walls and ceilings — The interior walls and ceilings show signs of wear and discoloration.
- Major bathrooms — The bathrooms appear to be in poor condition, with visible wear and discoloration.
- Major HVAC system — The HVAC system appears to be in poor condition, with visible wear and discoloration.
- Major landscaping — The landscaping and curb appeal are poor, with overgrown grass and a lack of maintenance.
- Major windows — The windows appear to be in poor condition, with visible wear and discoloration.
Value-add opportunities
- Both paint interior walls and ceilings — Painting the interior walls and ceilings can improve the overall appearance and value of the home.
- Both repair and replace roof — A new roof can significantly increase the home's value and reduce maintenance costs.
- Both repair and replace exterior siding — A new exterior siding can improve the home's curb appeal and increase its value.
- Both repair and replace HVAC system — A new HVAC system can improve the home's comfort and energy efficiency, increasing its value.
- Both landscape and improve curb appeal — A well-maintained and landscaped yard can increase the home's curb appeal and value.
- Both repair and replace windows — New windows can improve the home's energy efficiency and increase its value.
Renovation cost estimate screening
| Repair item | Severity | Est. cost |
|---|---|---|
| roof · The roof appears to be in poor condition, with visible wear and tear. | Major | $15,000–50,000 |
| exterior siding · The siding shows signs of wear and discoloration. | Major | $15,000–50,000 |
| interior walls and ceilings · The interior walls and ceilings show signs of wear and discoloration. | Major | $15,000–50,000 |
| bathrooms · The bathrooms appear to be in poor condition, with visible wear and discoloration. | Major | $15,000–50,000 |
| HVAC system · The HVAC system appears to be in poor condition, with visible wear and discoloration. | Major | $15,000–50,000 |
| landscaping · The landscaping and curb appeal are poor, with overgrown grass and a lack of maintenance. | Major | $15,000–50,000 |
| windows · The windows appear to be in poor condition, with visible wear and discoloration. | Major | $15,000–50,000 |
| Total estimated repair cost · 7 items | $105,000–350,000 |
Value-add ROI direction
- Both paint interior walls and ceilings — Painting the interior walls and ceilings can improve the overall appearance and value of the home. ↑
- Both repair and replace roof — A new roof can significantly increase the home's value and reduce maintenance costs. ↑
- Both repair and replace exterior siding — A new exterior siding can improve the home's curb appeal and increase its value. ↑
- Both repair and replace HVAC system — A new HVAC system can improve the home's comfort and energy efficiency, increasing its value. ↑
- Both landscape and improve curb appeal — A well-maintained and landscaped yard can increase the home's curb appeal and value. ↑
- Both repair and replace windows — New windows can improve the home's energy efficiency and increase its value. ↑
ⓘ Cost ranges are severity-bucket heuristics (US national rule-of-thumb). Get contractor quotes + a written scope before underwriting a rehab budget.
Schools (NCES district)
- District
- Naylor R-II
- NCES district ID
- 2921720
- Math proficiency
- 50% ▲ 5.00%
- Reading proficiency
- 50% ▲ 3.00%
- Median HH income
- $31,842
- Composite
- 43.07/100
- National rank
- #6636
- State rank
- #138 of 535 in MO
Livability — Naylor
- Score
- 59/100
- State rank
- #537
- US rank
- #20039
Category grades
Schools grade is shown separately in the Schools card above.
Census & demographics
- Census place
- Naylor, MO
- Population (ZIP)
- 684
Population outlook (Ripley County) Hauer SSP2
- Today (2025)
- 13,011 people
- By 2030
- 12,515 · -3.8%
- By 2040
- 11,512 · -11.5%
- By 2050
- 10,427 · -19.9%
- By 2075
- 7,833 · -39.8%
- By 2100
- 5,692 · -56.3%
Race, ethnicity, and origin ACS 2023
- Neighborhood character
- Predominantly White (85%)
- Race & ethnicity
- White 85% Two or more races 9% Hispanic / Latino 2%
- Common ancestry
- Lithuanian 3% Iranian 3% Serbian 2%
- Languages at home
- 98% English-only · German/W. Germanic 2%
Political lean MEDSL · Ripley
- 2024 margin
- Solid R (+73.0) · D 13.2% · R 86.2%
- 2008→2024 swing
- -43.0pp toward R · 2008: -30.1pp · 2024: -73.0pp
- All cycles
- 2024: R+73.0 2020: R+70.1 2016: R+66.9 2012: R+44.6 2008: R+30.1
Not yet ingested
- Civics
- —
Market trends
- HPI YoY
- —
- Current HPI
- —
- Rent YoY
- —
- Metro
- —
- State GDP YoY
- ▲ 1.84%
- F500 in state
- 20
Industry mix (Fortune 500 HQ in MO)
| Industry | F500 HQs | Revenue |
|---|---|---|
| Healthcare | 1 | $163B |
|
||
| Insurance | 1 | $21B |
|
||
| Industrial Technology | 1 | $17B |
|
||
| Retail | 1 | $16B |
|
||
| Industrial Distribution | 1 | $10B |
|
||
| Utilities | 1 | $9B |
|
||
Price history
1 event — show timeline
- 2026-03-11 Listed $80,000 MARIS as Distributed by MLS Grid
Cash-flow waterfall
monthlySold comps — $/sqft
last 12 mo · ≤1 miLoading sold comps…