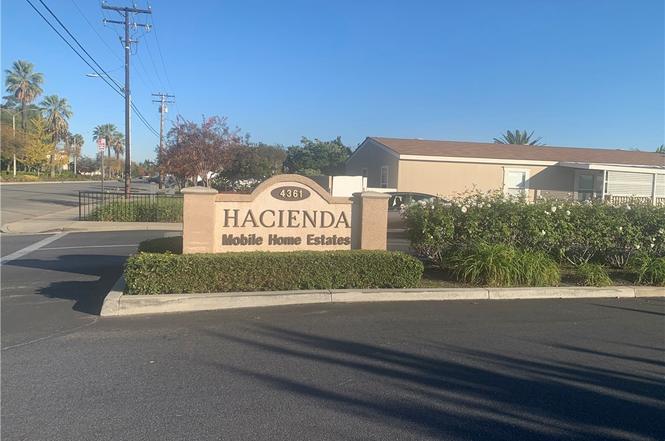
4361 Mission Blvd #80 · Montclair, CA
Flood risk 1/10 · Minimal
- FEMA flood zone
- X (unshaded)
- Chance of flooding over 30 yrs
- 0.0%
- Est. flood insurance / yr
- $507 – $1,088
Fire risk 1/10 · Minimal
- Est. fire insurance / yr
- $659 – $1,223
Heat risk 7/10 · Major
- Hot days now (above 100°F)
- 7 days/yr
- Hot days in 30 yrs
- 18 days/yr
Wind risk 1/10 · Minimal
- Chance of severe wind over 30 yrs
- —
Air-quality risk 8/10 · Major
- Unhealthy air days now
- 16 days/yr
- Unhealthy air days in 30 yrs
- 19 days/yr
Risk factors via First Street. Map © Google.
Why this score? — see what drove the B+ grade
The composite is a weighted blend of 9 inputs, each scored 0–100. Each bar is that input's sub-score; the figure is the points it added to the 100-point composite (weight × sub-score).
- Cash flow +30.0/30.0
- ARV discount +15.0/15.0
- 1% rule +10.0/10.0
- DSCR +10.0/10.0
- Schools +3.7/10.0
- Rent growth +3.6/5.0
- Livability +3.0/5.0
- Condition / age +2.5/5.0
- Appreciation +0.0/10.0
$145,000
🖨 Deal sheet (PDF) 📄 Offer letter ✓ Due diligence
Listing remarks
PLEASE NOTE: THIS LISTING IS ON HOLD. If it is showing as Active it was a system generated change. Spacious & ready to make your own! This mobile home still boasts it's late 70's decor for a trip back in time. Master bedroom with walk in closet and in-suite bathroom with sunk in tub. Second bedroom is on the other side of the home with Jack and Jill style bathroom. TV room hosts a vintage built in bar with colored glass windows. Cozy kitchen with built in double oven and bar area for dining; accessible from dining area and formal living room. Keep the vintage look or update for a modern feel. Easy access to freeways, shopping, dining and parks.
Key facts
- 1,296 sq ft lot
- 2 parking spots
- Community pool
Property features AI
Finance
- Other: Lot size and living area sourced from assessor/public records; Located on a corner lot
- Financial info: Assessments: Unknown; Land lease applies
- HOA & community: Part of an association; Home located in a land-lease park (Hacenda Mobile Estates)
Exterior
- Parking: Assigned parking; Two parking spaces; Two carport spaces
- Utilities: Public sewer; District/Public water; Cable available; Electricity available; Telephone service to street
- Home design: Mobile home (24' x 56') — mobile home remains on site; Double body type; Single story
- Construction: Year built per public records; Mobile construction
- Exterior features: Awning; Community pool; Corner lot; Street lighting in the community
Interior
- Kitchen: Built-in range
- Flooring: Carpet; Vinyl
- Bathrooms: One full bath; One three-quarter bath
- Heating & cooling: Central furnace heating
- Interior features: One-level home with front-door entry; Family room and living room; Jack & Jill layout between rooms; Bathtub and separate shower
- Laundry & utility: Washer hookup; On-site laundry available
Neighborhood map
What this means for you Summary
Snapshot
- This is a 3-bed/2.0-bath manufactured listed at $145k.
Deal economics
- At list price, monthly cash flow is $1k ($16k/yr) — positive.
- The deal already cash-flows at list — no discount required.
- Meets the 1% rule at list price ($3k rent vs $145k).
- Recommended offer: $128k (12.0% below list) — sets the bar for market timing.
- Cap rate 17.6% vs local median 3.4% in Montclair — top-decile yield for the area; either an underpriced asset or a hidden risk that comps aren't pricing in. Stress-test before assuming the spread holds.
Location & tenants
- Location reads 59/100 on livability (#643 in CA) — a working-class tenant base; expect higher turnover. Strengths: housing B+; Watch: schools C-, commute D, crime F.
- Ontario-Montclair (urban): math 35% / reading 44% proficiency, ranked #731 of 1,400 in CA (top 52%) — families likely to look elsewhere, expect single-tenant / working-renter base with shorter leases; 75% free/reduced lunch — lower-income household profile, screen leases tightly.
- Market conditions: Rents rising fast (+4.2%/yr); 28 active listings in the ZIP; 11 comparable units currently listed for rent nearby; rentals leasing fast (median 6d on market — plan ~1-2 weeks tenant-placement turnaround); solid renter incomes; 5,458 units permitted in San Bernardino County in 2024 (1,500 in 5+ unit buildings).
- At $3,003/mo this rent would consume 46% of the median local household income ($79k/yr) (locally 1575% of renters already pay >50% of income on rent) — very limited rent-growth headroom before tenants either downsize or default.
Forward outlook
- Local home prices are declining (-3.0%/yr); year-one equity from $1k of loan paydown is wiped out by about $4k of value loss. Plan a longer hold.
- San Bernardino County population projected at +15% by 2050 — modest demand growth; plan on rents tracking national, not racing it.
- At projected returns (-3.0% appreciation + 4.2% rent growth), your $41k cash investment doubles in ~3 years — after that, you're playing with house money.
Negotiation context
- It's been on market 318 days — a 12% lower offer ($128k) is reasonable based on typical stale-listing flexibility.
Risks & watch-outs
- Climate carrying-cost: extreme-heat days projected 7→18/yr by 2055 (HVAC capex compounding) — expect insurance premiums to compound above CPI over the hold.
Questions for the listing agent
- It's been on market 318 days. Have you received any prior offers? Is the seller open to a 12% concession, seller financing, or rate buy-down credit?
- Built in 1979 — when were the roof, HVAC, electrical panel, plumbing, and water heater last replaced?
- Why hasn't it sold? Are there any deal-killer items the seller is aware of (foundation, flood, title, zoning, code violations)?
- Is there a deadline driving the sale (1031 exchange, divorce, estate, relocation)? That informs how much negotiation room exists.
- Crime grade is F in this area — have there been break-ins, vandalism, or insurance claims at this property in the last 3 years? What carrier currently insures it and at what premium?
- What's the average days-on-market for RENTAL listings here right now (not sales)? A rising rental-DOM trend means longer vacancies and softer asking-rent achievability than the comps imply.
- What's the recent tenant-quality profile in this submarket — average credit score on applications, eviction rate, late-payment / NSF rate, and stable-employment percentage? A property-management company in the area should have these aggregated.
- How much new for-sale + rental construction is in the pipeline within 1–3 miles? Heavy new supply typically softens prices + rents 12–24 months out; constrained supply supports both.
Investment metrics
- 1% rule
- 2.07% ✓
- Cap rate
- 17.63%
- Cash-on-cash
- 40.50%
- DSCR
- 2.80
- GRM
- 4.0
CMA / ARV
- ARV (on-the-fly)
- $259,392
- Comps found
- 9
Show comp detail 9 sales within ~0.75 mi
| Address | Dist | Beds/Ba | Sqft | Sold | Price | $/sf | Match |
|---|---|---|---|---|---|---|---|
| 4361 Mission Blvd #151 | 0.00mi | 3/2.0 | 1,395 (+4%) | 10mo | $276,000 | $198 | 86 |
| 4361 Mission Blvd #121 | 0.00mi | 3/2.0 | 1,248 (-7%) | 6mo | $220,000 | $176 | 83 |
| 4361 Mission Blvd #38 | 0.00mi | 3/2.0 | 1,440 (+7%) | 8mo | $232,000 | $161 | 81 |
| 4361 Mission Blvd #100 | 0.00mi | 4/2.0 (+1) | 1,440 (+7%) | 7mo | $299,900 | $208 | 77 |
| 4361 Mission Blvd #193 | 0.00mi | 4/2.0 (+1) | 1,440 (+7%) | 12mo | $277,500 | $193 | 73 |
| 11250 Ramona #216 | 0.39mi | 3/2.0 | 1,440 (+7%) | 1mo | $292,000 | $203 | 69 |
| 4361 E Mission Blvd Sp. 89 | 0.00mi | 3/2.0 | 1,152 (-14%) | 10mo | $175,000 | $152 | 67 |
| 11250 Ramona Ave #118 | 0.28mi | 2/2.0 (-1) | 1,440 (+7%) | 12mo | $200,000 | $139 | 61 |
| 11250 Ramona Ave #306 | 0.31mi | 3/2.0 | 1,232 (-8%) | 15mo | $280,000 | $227 | 59 |
Match score weights: distance 35% · size 25% · config 20% · recency 20%. Top-matched comps best support the ARV.
Projected returns pro-forma
-3.0% appreciation · 4.24% rent growth · sell at horizon
- IRR
- 38.4%
- Equity multiple
- 2.67×
- Total profit
- $67,617
- Equity at exit
- $21,620
- IRR
- 45.5%
- Equity multiple
- 5.62×
- Total profit
- $187,406
- Equity at exit
- $12,537
Cash invested: $40,600 (down + closing). Projections, not guarantees.
Landlord ↔ Tenant lean methodology
- Overall (STATE)
- 18 Strongly Tenant-Friendly
- State California
- 18 Strongly Tenant-Friendly · D+13
- County
- — inherits STATE
- City
- — inherits STATE
ZIP-level market 91763
- Rents YoY
- 4.2%
- Active inventory
- 28
- Price-to-rent
- 4.0×
Monthly cashflow live
- Estimated rent
- $3,003 high interval (Pro) →
- Mortgage (P&I)
- −$760
- Tax est. 1.5%
- −$181 /mo · $2,175/yr
- Insurance
- −$60
- HOA
- −$0
- Vacancy / Maint / Mgmt
- −$631
- Net cashflow
- $1,370
Break-even live
Sensitivity live
| Price | -10% $1,471 | -5% $1,420 | +0% $1,370 | +5% $1,320 | +10% $1,270 |
|---|---|---|---|---|---|
| Rent | -10% $1,133 | -5% $1,252 | +0% $1,370 | +5% $1,489 | +10% $1,608 |
| Rate | -1.0pp $1,443 | -0.5pp $1,407 | base $1,370 | +0.5pp $1,333 | +1.0pp $1,295 |
UW: 25.0% down · 7.5% · 30yr · 1.5% tax · 5.0% vac · 8.0% maint · 8.0% mgmt
Financing live
Cash to close
- Down payment
- $36,250
- Closing costs
- $4,350
- Reserves months
- —
- Total cash needed
- —
Loan-product check · same deal, 3 products live
Conventional
25% down · 7.5% · 30yr
- Down + closing
- —
- Monthly P&I
- —
- Monthly cashflow
- —
- DSCR
- —
- Eligible?
- —
Personal DTI + credit; lowest rate.
DSCR
20% down · 8.5% · 30yr
- Down + closing
- —
- Monthly P&I
- —
- Monthly cashflow
- —
- DSCR
- —
- Eligible?
- —
No personal income docs; deal must DSCR.
Hard money
10% down · 12.0% · 12mo
- Down + closing
- —
- Monthly P&I
- —
- Monthly cashflow
- —
- DSCR
- —
- Eligible?
- —
Short-term bridge; refi at stabilization.
Rent comps 11 comps
| Address | Beds | Baths | Sqft | Rent | $/sqft | DOM | Units | Dist |
|---|---|---|---|---|---|---|---|---|
| 11054 Wesley Ave Montclair, CA | 3.0 | 2.0 | 1645 | $3,125 | $1.90 | 0d | 1 | 0.17mi |
| 10216 Ramona Ave Montclair, CA | 2.0 | 2.0 | 1197 | $2,500 | $2.09 | 0d | 1 | 1.01mi |
| 4830 Canoga St Unit J Montclair, CA | 2.0 | 1.0 | 950 | $1,795 | $1.89 | 0d | 1 | 1.05mi |
| 5095 Phillips Blvd Chino, CA | 2.0 | 1.0 | 900 | $2,800 | $3.11 | 6d | 1 | 1.06mi |
| 10290 Monte Vista Ave Montclair, CA | 4.0 | 2.0 | 1154 | $4,500 | $3.90 | 6d | 1 | 1.14mi |
| 5213 Coventry Way Montclair, CA | 2.0 | 2.5 | 960 | $2,295 | $2.39 | 0d | 1 | 1.15mi |
| 5212 Berkshire Way Montclair, CA | 2.0 | 2.5 | 1216 | $2,700 | $2.22 | 11d | 1 | 1.15mi |
| 1723 Lincoln Ave Pomona, CA | 2.0 | 2.0 | 1000 | $2,500 | $2.50 | 44d | 1 | 1.23mi |
| 4937 Taft St Unit Main House Chino, CA | 3.0 | 2.0 | 1195 | $3,400 | $2.85 | 19d | 1 | 1.26mi |
| 787 N Reservoir St Pomona, CA | 2.0 | 2.0 | 1000 | $2,450 | $2.45 | 0d | 1 | 1.49mi |
| 787 N Reservoir St Pomona, CA | 2.0 | 2.0 | 1000 | $2,450 | $2.45 | 5d | 1 | 1.49mi |
Listing history 20 events
-
2026-06-21days on market $145,000 Active 318 DOM
-
2026-06-18days on market $145,000 Active 315 DOM
-
2026-06-17days on market $145,000 Active 314 DOM
-
2026-06-16days on market $145,000 Active 313 DOM
-
2026-06-15days on market $145,000 Active 312 DOM
-
2026-06-13days on market $145,000 Active 310 DOM
-
2026-06-13days on market $145,000 Active 309 DOM
-
2026-06-09days on market $145,000 Active 306 DOM
-
2026-06-08days on market $145,000 Active 305 DOM
-
2026-06-07days on market $145,000 Active 304 DOM
-
2026-06-04days on market $145,000 Active 301 DOM
-
2026-06-03days on market $145,000 Active 300 DOM
-
2026-06-02days on market $145,000 Active 299 DOM
-
2026-06-01days on market $145,000 Active 298 DOM
-
2026-05-31days on market $145,000 Active 297 DOM
-
2025-09-12status Active
-
2025-08-23status Active
-
2025-08-16status Active
-
2025-07-21status Active
-
2025-07-05historical $145,000
ⓘ Source: listings_history table (triggers on properties + properties_extension) + one-shot
backfill from property_details.listing_events for pre-trigger history.
Climate risk First Street
- Flood 1/10 Low FEMA zone X (unshaded) · 0% chance over 30 yrs
- Wildfire 1/10 Low
- Heat 7/10 Severe 7 d/yr ≥100°F today · 18 d/yr by 30 yrs out
- Wind 1/10 Low
- Air quality 8/10 Severe 16 unhealthy d/yr today · 19 by 30 yrs out
Nearby sold comps map
Loading sold comps map…
Walkable amenities ~0.75 mi
Loading nearby amenities…
Taxation est. · year 1
- Rental income
- $36,036
- − Mortgage interest
- −$8,122
- − Property taxes
- −$2,175
- − Insurance
- −$725
- − Repairs & maintenance
- −$2,883
- − Management
- −$2,883
- − Depreciation
- −$4,218
- Taxable income
- $15,030
- Est. tax owed @ 24.0%
- −$3,607
- After-tax cash flow
- $12,836/yr
For passive investors: Depreciation is non-cash, so a rental often shows a tax loss while cash-flowing — sheltering income. Rental losses are passive: they offset passive income freely, and up to $25,000/yr can offset ordinary (W-2) income if you actively participate and your MAGI is under $100k (phasing out to $0 by $150k); unused losses carry forward. On sale, claimed depreciation is recaptured at up to 25%, and gains may owe capital-gains tax (a 1031 exchange can defer both). Figures are a year-1 estimate at your 24.0% rate — not tax advice; consult a CPA.
Schools (NCES district)
- District
- Ontario-Montclair
- NCES district ID
- 0628470
- Math proficiency
- 35% ▲ 4.00%
- Reading proficiency
- 44% ▲ 2.00%
- Median HH income
- $50,668
- Composite
- 36.57/100
- National rank
- #9282
- State rank
- #731 of 1400 in CA
Livability — Montclair
- Score
- 59/100
- State rank
- #643
- US rank
- #20130
Category grades
Schools grade is shown separately in the Schools card above.
Census & demographics
- Census place
- Montclair, CA
- County
- San Bernardino County · 2,030,291 people
- City population
- 37,700
- Metro
- Riverside-San Bernardino-Ontario, CA
- Population (ZIP)
- 37,700
- Household income
- $78,770
- Rent vs Own
- Severe rent burden
- 1575.0
Population outlook (San Bernardino County) Hauer SSP2
- Today (2025)
- 2,300,329 people
- By 2030
- 2,378,907 · +3.4%
- By 2040
- 2,523,137 · +9.7%
- By 2050
- 2,642,388 · +14.9%
- By 2075
- 2,880,769 · +25.2%
- By 2100
- 2,909,436 · +26.5%
Race, ethnicity, and origin ACS 2023
- Neighborhood character
- Predominantly Hispanic (72%)
- Race & ethnicity
- Hispanic / Latino 72% Two or more races 21% White 11% Asian 10% Black 5% Native American 3%
- Hispanic origin (detail)
- Mexican 61%
- Common ancestry
- Italian 0%
- Foreign-born
- 31% · Canada, Vietnam, China
- Languages at home
- 42% English-only · Spanish 47% Vietnamese 4% Chinese 2%
Political lean MEDSL · San Bernardino
- 2024 margin
- Toss-up / Even · D 47.5% · R 49.7% · Other 2.8%
- 2008→2024 swing
- -8.5pp toward R · 2008: 6.3pp · 2024: -2.1pp
- All cycles
- 2024: R+2.1 2020: D+10.7 2016: D+9.8 2012: D+5.4 2008: D+6.3
Not yet ingested
- Civics
- —
Market trends
- HPI YoY
- ▼ -437.39%
- Current HPI
- 438.7739
- Rent YoY
- ▲ 4.24%
- Metro
- Riverside-San Bernardino-Ontario, CA
- State GDP YoY
- ▲ 3.21%
- F500 in state
- 116
Industry mix (Fortune 500 HQ in CA)
| Industry | F500 HQs | Revenue |
|---|---|---|
| Technology | 27 | $1,492B |
|
||
| Financial Services | 3 | $174B |
|
||
| Retail | 3 | $44B |
|
||
| Insurance | 3 | $26B |
|
||
| Media / Entertainment | 2 | $115B |
|
||
| Pharmaceuticals / Biotech | 2 | $62B |
|
||
Price history
5 events — show timeline
- 2025-09-12 Relisted — CRMLS
- 2025-08-23 Relisted — CRMLS
- 2025-08-16 Relisted — CRMLS
- 2025-07-21 Relisted — CRMLS
- 2025-07-05 Coming Soon $145,000 CRMLS
Property tax history
+0.1%/yrLatest (2025): $257 · +0.3% YoY. Source: county tax records.
Cash-flow waterfall
monthlySold comps — $/sqft
last 12 mo · ≤1 miLoading sold comps…