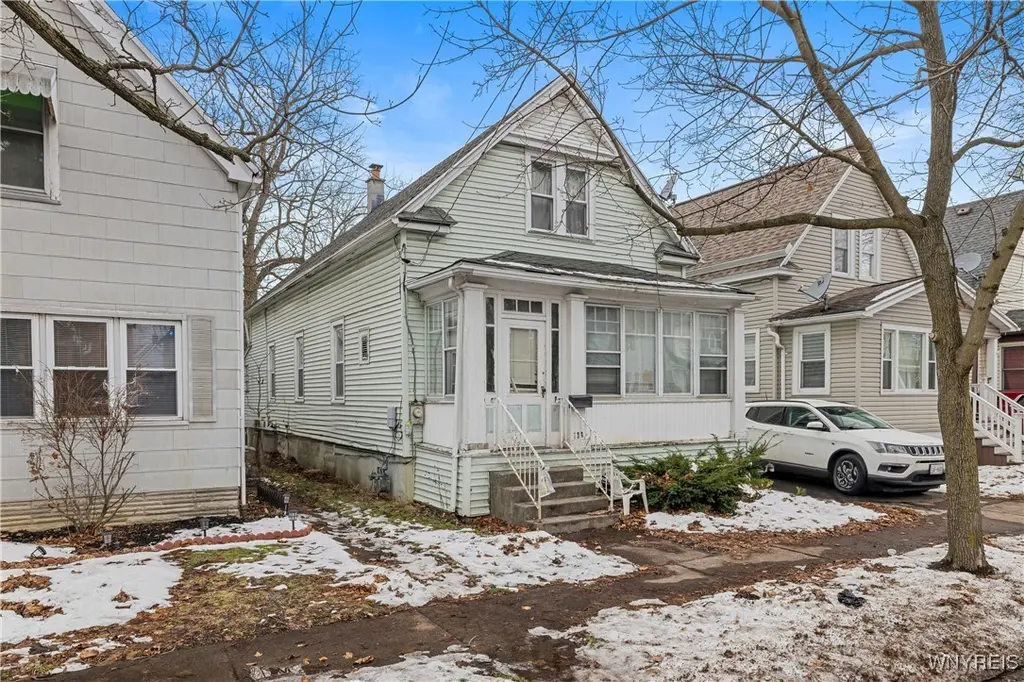
136 Humason Ave · Buffalo, NY
Flood risk 6/10 · Moderate
- FEMA flood zone
- X (unshaded)
- Chance of flooding over 30 yrs
- 0.64%
- Est. flood insurance / yr
- $473 – $860
Fire risk 1/10 · Minimal
- Est. fire insurance / yr
- $691 – $1,283
Heat risk 2/10 · Minimal
- Hot days now (above 93°F)
- 7 days/yr
- Hot days in 30 yrs
- 15 days/yr
Wind risk 1/10 · Minimal
- Chance of severe wind over 30 yrs
- —
Air-quality risk 3/10 · Minor
- Unhealthy air days now
- 2 days/yr
- Unhealthy air days in 30 yrs
- 3 days/yr
Risk factors via First Street. Map © Google.
Why this score? — see what drove the B grade
The composite is a weighted blend of 9 inputs, each scored 0–100. Each bar is that input's sub-score; the figure is the points it added to the 100-point composite (weight × sub-score).
- Cash flow +27.4/30.0
- ARV discount +13.3/15.0
- DSCR +9.6/10.0
- 1% rule +6.3/10.0
- Appreciation +6.0/10.0
- Livability +3.9/5.0
- Schools +3.3/10.0
- Rent growth +2.5/5.0
- Condition / age +2.5/5.0
$125,000
🖨 Deal sheet (PDF) 📄 Offer letter ✓ Due diligence
Listing remarks
Welcome to 136 Humason, located in the desirable Schiller Park neighborhood. This well-maintained home offers three generously sized bedrooms and one full bathroom. The exterior features low-maintenance vinyl siding, newer windows, and a newer roof. Inside, you’ll find spacious rooms with hardwood floors throughout. The kitchen showcases beautiful woodwork and built-in cabinetry, adding character and functionality. Upstairs includes an additional bonus room along with another spacious bedroom. Newer HWT. The property is currently rented for $1,250 per month . The seller owns multiple properties on the street and prefers to sell as a package, though individual sales will be considered.
Key facts
- Built-in cabinetry
- Newer roof
- Newer windows
Tags
Property features AI
Exterior
- Parking: No garage
- Utilities: Public water connected; Sewer connected
- Home design: Single-story property; Resale condition
- Construction: Vinyl siding; Stone foundation; Existing (original) construction
- Exterior features: Concrete driveway; Near public transit; Rectangular residential lot (approx. 30 x 100)
Interior
- Kitchen: See remarks for kitchen details
- Bedrooms: Two main-level bedrooms
- Flooring: Carpet; Hardwood; Laminate; Varies
- Bathrooms: One full bathroom on the main level
- Heating & cooling: Gas heating with radiators
- Interior features: Varied interior finishes with some rooms noted as 'Other' — see remarks
- Laundry & utility: Gas water heater
Neighborhood map
What this means for you Summary
Snapshot
- This is a 3-bed/1.0-bath single-family listed at $125k.
Deal economics
- At list price, monthly cash flow is $367 ($4k/yr) — positive.
- The deal already cash-flows at list — no discount required.
- Meets the 1% rule at list price ($1k rent vs $125k).
- Recommended offer: $123k (1.5% below list) — sets the bar for market timing.
- Cap rate 9.8% vs local median 8.0% in Buffalo — meaningfully above typical; check what's discounted (condition, days-on-market, listing class) to confirm the premium yield is real.
Location & tenants
- Location reads 77/100 on livability (#195 in NY, #3,011 nationally) — a middle-class / working-renter tenant base. Strengths: commute A+, housing A+, health & safety A+; Watch: crime F, employment D-.
- Buffalo City School District (urban): math 41% / reading 40% proficiency, ranked #535 of 590 in NY (top 91%) — families likely to look elsewhere, expect single-tenant / working-renter base with shorter leases; 75% free/reduced lunch — lower-income household profile, screen leases tightly.
- Zoned schools: International School (math 8% / reading 17%, grade F, #2,048 of 2,108 statewide, top 97%, 981 students, 92% FRL); Hutchinson Central Technical High School (math 96% / reading 32%, grade B-, #807 of 1,100 statewide, top 73%, 1,175 students, 78% FRL).
- Market conditions: 173 active listings in the ZIP; 23 comparable units currently listed for rent nearby; rentals at typical pace (median 26d on market — plan ~3-4 weeks tenant-placement turnaround); 43% of comp listings sitting > 30 days — soft ceiling on asking rent; lower-income renter base — watch delinquency; 1,244 units permitted in Erie County in 2024 (563 in 5+ unit buildings).
- At $1,411/mo this rent would consume 47% of the median local household income ($36k/yr) (locally 1804% of renters already pay >50% of income on rent) — very limited rent-growth headroom before tenants either downsize or default.
Forward outlook
- In year one you build about $3k of equity ($864 loan paydown + $3k appreciation (2.0% local appreciation)).
- At projected returns (2.0% appreciation + 3.0% rent growth), your $35k cash investment doubles in ~5 years — after that, you're playing with house money.
- By year 10, paydown + projected appreciation supports a ~$33k cash-out refi (75% LTV) — recoverable capital for the next deal without selling this one.
Negotiation context
- It's been on market 16 days — a 2% lower offer ($123k) is reasonable based on typical stale-listing flexibility.
- 2 sale attempts with the ask held roughly flat each time — persistent listings suggest the price (not the market) is what's stuck; bring a comps-based counter.
Risks & watch-outs
- Watch-outs: built in 1902 — expect roof / HVAC / electrical / plumbing capex.
- Climate carrying-cost: major flood risk — expect insurance premiums to compound above CPI over the hold.
Questions for the listing agent
- Built in 1902 — when were the roof, HVAC, electrical panel, plumbing, and water heater last replaced?
- Is there a deadline driving the sale (1031 exchange, divorce, estate, relocation)? That informs how much negotiation room exists.
- Crime grade is F in this area — have there been break-ins, vandalism, or insurance claims at this property in the last 3 years? What carrier currently insures it and at what premium?
- What's the average days-on-market for RENTAL listings here right now (not sales)? A rising rental-DOM trend means longer vacancies and softer asking-rent achievability than the comps imply.
- What's the recent tenant-quality profile in this submarket — average credit score on applications, eviction rate, late-payment / NSF rate, and stable-employment percentage? A property-management company in the area should have these aggregated.
- How much new for-sale + rental construction is in the pipeline within 1–3 miles? Heavy new supply typically softens prices + rents 12–24 months out; constrained supply supports both.
Investment metrics
- 1% rule
- 1.13% ✓
- Cap rate
- 9.82%
- Cash-on-cash
- 12.59%
- DSCR
- 1.56
- GRM
- 7.4
CMA / ARV
- ARV (median comp)
- $143,647
- List price
- $125,000
- Delta
- -19.25%
- Verdict
- UNDERPRICED
- Comps
- 20 within 1.0 mi
Show comp detail 12 sales within ~0.75 mi
| Address | Dist | Beds/Ba | Sqft | Sold | Price | $/sf | Match |
|---|---|---|---|---|---|---|---|
| 76 Humason Ave | 0.11mi | 3/1.0 | 1,212 (-10%) | 4mo | $125,000 | $103 | 74 |
| 54 Roma Ave | 0.48mi | 3/1.5 | 1,320 (-2%) | 1mo | $165,000 | $125 | 71 |
| 70 Eggert Rd | 0.51mi | 3/1.0 | 1,342 (-1%) | 6mo | $215,000 | $160 | 70 |
| 74 Domedion Ave | 0.16mi | 3/1.0 | 1,196 (-11%) | 4mo | $120,000 | $100 | 70 |
| 105 Hoerner Ave | 0.57mi | 3/1.0 | 1,367 (+1%) | 2mo | $90,000 | $66 | 70 |
| 17 Eller Ave | 0.23mi | 4/2.0 (+1) | 1,274 (-6%) | 4mo | $167,500 | $131 | 68 |
| 67 Carol Dr | 0.58mi | 3/1.0 | 1,384 (+2%) | 2mo | $225,000 | $163 | 67 |
| 98 E End Ave | 0.26mi | 3/2.0 | 1,217 (-10%) | 2mo | $160,000 | $131 | 66 |
| 32 Wildy Ave | 0.48mi | 3/2.0 | 1,267 (-6%) | 1mo | $210,000 | $166 | 62 |
| 117 Newburgh Ave | 0.44mi | 4/1.0 (+1) | 1,255 (-7%) | 6mo | $120,000 | $96 | 58 |
| 62 Haller Ave | 0.65mi | 3/2.0 | 1,397 (+4%) | 4mo | $125,000 | $89 | 56 |
| 64 Westchester Dr | 0.69mi | 2/1.0 (-1) | 1,194 (-12%) | 2mo | $190,000 | $159 | 41 |
Match score weights: distance 35% · size 25% · config 20% · recency 20%. Top-matched comps best support the ARV.
Projected returns pro-forma
2.05% appreciation · 3.0% rent growth · sell at horizon
- IRR
- 17.0%
- Equity multiple
- 1.92×
- Total profit
- $32,219
- Equity at exit
- $49,636
- IRR
- 19.3%
- Equity multiple
- 3.57×
- Total profit
- $89,863
- Equity at exit
- $71,733
Cash invested: $35,000 (down + closing). Projections, not guarantees.
Landlord ↔ Tenant lean methodology
- Overall (STATE)
- 15 Strongly Tenant-Friendly
- State New York
- 15 Strongly Tenant-Friendly · D+10
- County
- — inherits STATE
- City
- — inherits STATE
ZIP-level market 14211
- Home prices YoY
- 0.6%
- Active inventory
- 173
- Price-to-rent
- 7.4×
Monthly cashflow live
- Estimated rent
- $1,411 high interval (Pro) →
- Mortgage (P&I)
- −$656
- Tax from tax record
- −$40 /mo · $476/yr
- Insurance
- −$52
- HOA
- −$0
- Vacancy / Maint / Mgmt
- −$296
- Net cashflow
- $367
Break-even live
Sensitivity live
| Price | -10% $438 | -5% $403 | +0% $367 | +5% $332 | +10% $296 |
|---|---|---|---|---|---|
| Rent | -10% $256 | -5% $311 | +0% $367 | +5% $423 | +10% $479 |
| Rate | -1.0pp $430 | -0.5pp $399 | base $367 | +0.5pp $335 | +1.0pp $302 |
UW: 25.0% down · 7.5% · 30yr · 1.5% tax · 5.0% vac · 8.0% maint · 8.0% mgmt
Financing live
Cash to close
- Down payment
- $31,250
- Closing costs
- $3,750
- Reserves months
- —
- Total cash needed
- —
Loan-product check · same deal, 3 products live
Conventional
25% down · 7.5% · 30yr
- Down + closing
- —
- Monthly P&I
- —
- Monthly cashflow
- —
- DSCR
- —
- Eligible?
- —
Personal DTI + credit; lowest rate.
DSCR
20% down · 8.5% · 30yr
- Down + closing
- —
- Monthly P&I
- —
- Monthly cashflow
- —
- DSCR
- —
- Eligible?
- —
No personal income docs; deal must DSCR.
Hard money
10% down · 12.0% · 12mo
- Down + closing
- —
- Monthly P&I
- —
- Monthly cashflow
- —
- DSCR
- —
- Eligible?
- —
Short-term bridge; refi at stabilization.
Rent comps 23 comps
| Address | Beds | Baths | Sqft | Rent | $/sqft | DOM | Units | Dist |
|---|---|---|---|---|---|---|---|---|
| 65 Domedion Ave Buffalo, NY | 3.0 | 1.0 | 1632 | $1,500 | $0.92 | 3d | 1 | 0.19mi |
| 50 Pine Ridge Ter Unit 3 Cheektowaga, NY | 2.0 | 1.0 | 900 | $1,400 | $1.56 | 19d | 1 | 0.25mi |
| 61 Courtland Ave Unit Lower Buffalo, NY | 2.0 | 1.0 | 1000 | $1,300 | $1.30 | 45d | 1 | 0.40mi |
| 216 Newburgh Ave Buffalo, NY | 2.0 | 1.0 | 1690 | $1,150 | $0.68 | 25d | 1 | 0.49mi |
| 249 Newburgh Ave Unit 2 Buffalo, NY | 2.0 | 1.0 | 930 | $1,300 | $1.40 | 45d | 1 | 0.50mi |
| 85 Blake St Unit 1 Buffalo, NY | 4.0 | 2.0 | 1022 | $1,000 | $0.98 | 45d | 1 | 0.56mi |
| 103 Preston Rd Unit Lower Cheektowaga, NY | 2.0 | 1.0 | 882 | $1,300 | $1.47 | 5d | 1 | 0.58mi |
| 11 Kaufman Dr Buffalo, NY | 2.0 | 1.0 | 900 | $1,500 | $1.67 | 45d | 1 | 0.65mi |
| 24 Euclid Ave Buffalo, NY | 3.0 | 2.0 | 1150 | $1,700 | $1.48 | 45d | 1 | 0.71mi |
| 71 Gerald Ave Buffalo, NY | 2.0 | 1.0 | 1773 | $1,100 | $0.62 | 45d | 1 | 0.73mi |
| 143 Reo Ave Buffalo, NY | 3.0 | 2.0 | 1143 | $1,600 | $1.40 | 13d | 1 | 0.75mi |
| 67 Moeller St Unit LOWER Buffalo, NY | 3.0 | 1.0 | 960 | $1,200 | $1.25 | 25d | 1 | 0.77mi |
| 67 Moeller St Unit UPPER Buffalo, NY | 3.0 | 1.0 | 960 | $1,000 | $1.04 | 5d | 1 | 0.77mi |
| 979 Walden Ave Buffalo, NY | 4.0 | 3.0 | 1793 | $2,000 | $1.12 | 3d | 1 | 0.79mi |
| 1202 Walden Ave Unit 3 Buffalo, NY | 3.0 | 1.0 | 1500 | $1,400 | $0.93 | 19d | 1 | 0.84mi |
| 17 Proctor Ave Unit 1 Buffalo, NY | 2.0 | 1.0 | 900 | $1,100 | $1.22 | 45d | 1 | 0.89mi |
| 74 Dorris Ave Buffalo, NY | 3.0 | 1.0 | 1200 | $1,450 | $1.21 | 45d | 1 | 0.98mi |
| 517 Goodyear Ave Buffalo, NY | 3.0 | 1.0 | 1559 | $1,800 | $1.15 | 21d | 1 | 1.24mi |
| 2935 Genesee St Unit Up Buffalo, NY | 2.0 | 1.0 | 1400 | $1,400 | $1.00 | 12d | 1 | 1.26mi |
| 47 Awood Pl Buffalo, NY | 3.0 | 1.0 | 1840 | $1,500 | $0.82 | 3d | 1 | 1.34mi |
| 97 Davidson Ave Buffalo, NY | 3.0 | 1.0 | 925 | $1,495 | $1.62 | 3d | 1 | 1.41mi |
| 90 Sussex St Unit 2 Buffalo, NY | 2.0 | 1.0 | 1000 | $1,000 | $1.00 | 45d | 1 | 1.46mi |
| 1777 Broadway Unit 2 Buffalo, NY | 3.0 | 1.0 | 1300 | $1,200 | $0.92 | 45d | 1 | 1.50mi |
Listing history 12 events
-
2026-06-21days on market $125,000 Active 16 DOM
-
2026-06-18days on market $125,000 Active 13 DOM
-
2026-06-17days on market $125,000 Active 12 DOM
-
2026-06-16days on market $125,000 Active 11 DOM
-
2026-06-15days on market $125,000 Active 10 DOM
-
2026-06-13days on market $125,000 Active 8 DOM
-
2026-06-13days on market $125,000 Active 7 DOM
-
2026-06-10days on market $125,000 Active 5 DOM
-
2026-06-09days on market $125,000 Active 4 DOM
-
2026-06-08days on market $125,000 Active 3 DOM
-
2026-06-07pricedays on market $125,000 Active 2 DOM
-
2025-12-31$116,000 Active 844-char remark
ⓘ Source: listings_history table (triggers on properties + properties_extension) + one-shot
backfill from property_details.listing_events for pre-trigger history.
Tax reassessment forecast NY · Partial reset (capped growth)
- Current annual tax
- $476 · $40/mo
- Projected year-2 tax
- $1,294 · $108/mo
- Expected delta
- +$818/yr (+$68/mo · 172.1%)
ⓘ Screening estimate from a state-policy table — verify with the county assessor before closing.
Climate risk First Street
- Flood 6/10 Major FEMA zone X (unshaded) · 64% chance over 30 yrs
- Wildfire 1/10 Low
- Heat 2/10 Low 7 d/yr ≥93°F today · 15 d/yr by 30 yrs out
- Wind 1/10 Low
- Air quality 3/10 Moderate 2 unhealthy d/yr today · 3 by 30 yrs out
Nearby sold comps map
Loading sold comps map…
Walkable amenities ~0.75 mi
Loading nearby amenities…
Taxation est. · year 1
- Rental income
- $16,928
- − Mortgage interest
- −$7,002
- − Property taxes
- −$476
- − Insurance
- −$625
- − Repairs & maintenance
- −$1,354
- − Management
- −$1,354
- − Depreciation
- −$3,636
- Taxable income
- $2,481
- Est. tax owed @ 24.0%
- −$595
- After-tax cash flow
- $3,811/yr
For passive investors: Depreciation is non-cash, so a rental often shows a tax loss while cash-flowing — sheltering income. Rental losses are passive: they offset passive income freely, and up to $25,000/yr can offset ordinary (W-2) income if you actively participate and your MAGI is under $100k (phasing out to $0 by $150k); unused losses carry forward. On sale, claimed depreciation is recaptured at up to 25%, and gains may owe capital-gains tax (a 1031 exchange can defer both). Figures are a year-1 estimate at your 24.0% rate — not tax advice; consult a CPA.
Schools (NCES district)
- District
- Buffalo City School District
- NCES district ID
- 3605850
- Math proficiency
- 41% ▲ 11.00%
- Reading proficiency
- 40% ▲ 7.00%
- Median HH income
- $31,665
- Composite
- 33.17/100
- National rank
- #5544
- State rank
- #535 of 590 in NY
Livability — Buffalo
- Score
- 77/100
- State rank
- #195
- US rank
- #3011
Category grades
Schools grade is shown separately in the Schools card above.
Census & demographics
- Census place
- Buffalo, NY
- County
- Erie County · 714,559 people
- City population
- 440,021
- Metro
- Buffalo-Cheektowaga, NY
- Population (ZIP)
- 24,663
- Household income
- $36,300
- Rent vs Own
- Severe rent burden
- 1804.0
Population outlook (Erie County) Hauer SSP2
- Today (2025)
- 933,037 people
- By 2030
- 935,181 · +0.2%
- By 2040
- 928,531 · -0.5%
- By 2050
- 905,725 · -2.9%
- By 2075
- 834,037 · -10.6%
- By 2100
- 708,033 · -24.1%
Race, ethnicity, and origin ACS 2023
- Neighborhood character
- Diverse neighborhood (Simpson 0.60)
- Race & ethnicity
- Black 59% Asian 20% Hispanic / Latino 9% White 9% Two or more races 5%
- Hispanic origin (detail)
- Puerto Rican 6%
- Common ancestry
- Romanian 4%
- Foreign-born
- 17% · Canada, Philippines, Vietnam
- Languages at home
- 74% English-only · Other Indo-European 14% Spanish 6% Other Asian/Pacific 1%
Political lean MEDSL · Erie
- 2024 margin
- Lean D (+9.7) · D 54.8% · R 45.2%
- 2008→2024 swing
- -7.9pp toward R · 2008: 17.5pp · 2024: 9.7pp
- All cycles
- 2024: D+9.7 2020: D+14.7 2016: D+4.8 2012: D+15.6 2008: D+17.5
Not yet ingested
- Civics
- —
Market trends
- HPI YoY
- ▲ 2.05%
- Current HPI
- 357.6438
- Rent YoY
- —
- Metro
- Buffalo-Cheektowaga, NY
- State GDP YoY
- ▲ 2.60%
- F500 in state
- 92
Industry mix (Fortune 500 HQ in NY)
| Industry | F500 HQs | Revenue |
|---|---|---|
| Financial Services | 10 | $950B |
|
||
| Consumer Goods | 9 | $162B |
|
||
| Insurance | 4 | $225B |
|
||
| Telecommunications | 2 | $144B |
|
||
| Pharmaceuticals | 2 | $112B |
|
||
| Media / Entertainment | 2 | $69B |
|
||
Price history
+7.8% since first listed3 events — show timeline
- 2026-06-05 Listed $125,000 WNYREIS
- 2026-05-29 Listing Removed — WNYREIS
- 2025-12-31 Listed $116,000 WNYREIS
Property tax history
+10.2%/yrLatest (2025): $476 · +142.4% YoY. Source: county tax records.
Cash-flow waterfall
monthlySold comps — $/sqft
last 12 mo · ≤1 miLoading sold comps…