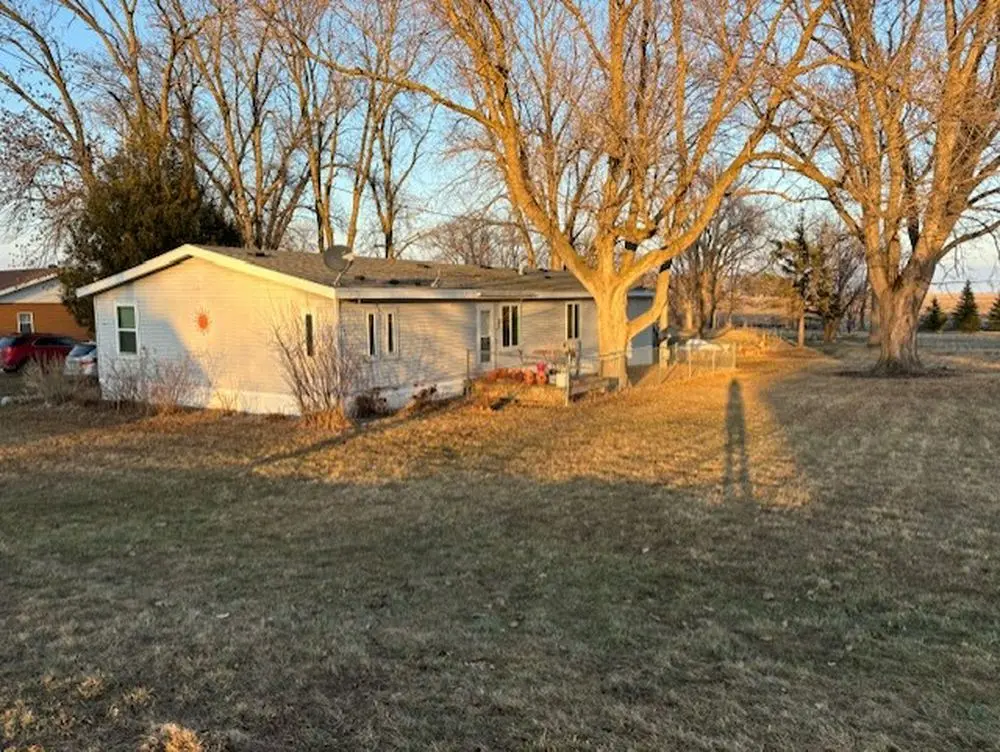
660 11th St · Lafayette, MN
Flood risk No data
- FEMA flood zone
- —
- Chance of flooding over 30 yrs
- —
- Est. flood insurance / yr
- —
Fire risk No data
- Est. fire insurance / yr
- —
Heat risk No data
- Hot days now (above threshold)
- —
- Hot days in 30 yrs
- —
Wind risk No data
- Chance of severe wind over 30 yrs
- —
Air-quality risk No data
- Unhealthy air days now
- —
- Unhealthy air days in 30 yrs
- —
Risk factors via First Street. Map © Google.
Why this score? — see what drove the B+ grade
The composite is a weighted blend of 9 inputs, each scored 0–100. Each bar is that input's sub-score; the figure is the points it added to the 100-point composite (weight × sub-score).
- Cash flow +30.0/30.0
- DSCR +10.0/10.0
- 1% rule +9.1/10.0
- ARV discount +7.5/15.0
- Appreciation +7.4/10.0
- Schools +4.4/10.0
- Livability +3.2/5.0
- Rent growth +2.5/5.0
- Condition / age +2.5/5.0
$90,000
🖨 Deal sheet (PDF) 📄 Offer letter ✓ Due diligence
Listing remarks
Single-Owner Manufactured Home on Large Lot Backing to Farmland. 1996 manufactured home offering 3 bedrooms and 2 bathrooms with a functional layout. The home includes two living areas, one featuring built-in shelves and cabinets, along with a kitchen and separate mud room. Situated on a large, irregular lot, the property backs up to a farm field, providing open space and added privacy. Patio cement slab, approximately 10'x10' near garage. A detached 15' x 15' single-car garage with a storage loft offers additional space for parking or storage. Hooked up to city sewer and water. Interior photos coming soon.
Key facts
- Separate mud room
- Large lot
- Two living areas
Tags
Property features AI
Exterior
- Home design: House
- Construction: Built or listed as having 1792 square feet
Neighborhood map
What this means for you Summary
Snapshot
- This is a 3-bed/2.0-bath single-family listed at $90k.
Deal economics
- At list price, monthly cash flow is $451 ($5k/yr) — positive.
- The deal already cash-flows at list — no discount required.
- Meets the 1% rule at list price ($1k rent vs $90k).
- Recommended offer: $89k (1.5% below list) — sets the bar for market timing.
Location & tenants
- Location reads 64/100 on livability (#570 in MN) — a middle-class / working-renter tenant base. Strengths: employment A+, cost of living A+, housing A+; Watch: crime C-, amenities F, commute F.
- New Ulm Public School District (town): math 51% / reading 51% proficiency, ranked #104 of 301 in MN (top 35%) — acceptable for families but not a draw, mixed tenant base, ~2y average lease.
- Zoned schools: Jefferson Elementary (math 47% / reading 39%, grade F, #574 of 857 statewide, top 67%, 619 students, 40% FRL); Washington Learning Center (188 students, 47% FRL); New Ulm High School (math 67% / reading 67%, grade B, #19 of 471 statewide, top 4%, 706 students, 29% FRL) — zoned schools average 39% FRL vs 21% district-wide (18 pts higher); higher-poverty schools than district average — tighter screening recommended.
- Market conditions: 6 active listings in the ZIP; 109 units permitted in Nicollet County in 2024 (47 in 5+ unit buildings).
Forward outlook
- In year one you build about $5k of equity ($622 loan paydown + $4k appreciation (4.7% local appreciation)).
- At projected returns (4.7% appreciation + 3.0% rent growth), your $25k cash investment doubles in ~3 years — after that, you're playing with house money.
- By year 7, paydown + projected appreciation supports a ~$31k cash-out refi (75% LTV) — recoverable capital for the next deal without selling this one.
Negotiation context
- It's been on market 17 days — a 2% lower offer ($89k) is reasonable based on typical stale-listing flexibility.
Questions for the listing agent
- Is there a deadline driving the sale (1031 exchange, divorce, estate, relocation)? That informs how much negotiation room exists.
- What's the average days-on-market for RENTAL listings here right now (not sales)? A rising rental-DOM trend means longer vacancies and softer asking-rent achievability than the comps imply.
- What's the recent tenant-quality profile in this submarket — average credit score on applications, eviction rate, late-payment / NSF rate, and stable-employment percentage? A property-management company in the area should have these aggregated.
- How much new for-sale + rental construction is in the pipeline within 1–3 miles? Heavy new supply typically softens prices + rents 12–24 months out; constrained supply supports both.
Investment metrics
- 1% rule
- 1.41% ✓
- Cap rate
- 12.30%
- Cash-on-cash
- 21.46%
- DSCR
- 1.95
- GRM
- 5.9
CMA / ARV
No comps found within radius.
Projected returns pro-forma
4.72% appreciation · 3.0% rent growth · sell at horizon
- IRR
- 31.0%
- Equity multiple
- 2.90×
- Total profit
- $47,964
- Equity at exit
- $49,457
- IRR
- 29.8%
- Equity multiple
- 5.80×
- Total profit
- $120,865
- Equity at exit
- $84,105
Cash invested: $25,200 (down + closing). Projections, not guarantees.
Landlord ↔ Tenant lean methodology
- Overall (STATE)
- 46 Balanced
- State Minnesota
- 46 Balanced · D+2
- County
- — inherits STATE
- City
- — inherits STATE
ZIP-level market 56054
- Home prices YoY
- 2.0%
- Active inventory
- 6
- Price-to-rent
- 5.9×
Monthly cashflow live
- Estimated rent
- $1,268 medium interval (Pro) →
- Mortgage (P&I)
- −$472
- Tax from tax record
- −$42 /mo · $502/yr
- Insurance
- −$38
- HOA
- −$0
- Vacancy / Maint / Mgmt
- −$266
- Net cashflow
- $451
Break-even live
Sensitivity live
| Price | -10% $502 | -5% $476 | +0% $451 | +5% $425 | +10% $400 |
|---|---|---|---|---|---|
| Rent | -10% $350 | -5% $400 | +0% $451 | +5% $501 | +10% $551 |
| Rate | -1.0pp $496 | -0.5pp $473 | base $451 | +0.5pp $427 | +1.0pp $404 |
UW: 25.0% down · 7.5% · 30yr · 1.5% tax · 5.0% vac · 8.0% maint · 8.0% mgmt
Financing live
Cash to close
- Down payment
- $22,500
- Closing costs
- $2,700
- Reserves months
- —
- Total cash needed
- —
Loan-product check · same deal, 3 products live
Conventional
25% down · 7.5% · 30yr
- Down + closing
- —
- Monthly P&I
- —
- Monthly cashflow
- —
- DSCR
- —
- Eligible?
- —
Personal DTI + credit; lowest rate.
DSCR
20% down · 8.5% · 30yr
- Down + closing
- —
- Monthly P&I
- —
- Monthly cashflow
- —
- DSCR
- —
- Eligible?
- —
No personal income docs; deal must DSCR.
Hard money
10% down · 12.0% · 12mo
- Down + closing
- —
- Monthly P&I
- —
- Monthly cashflow
- —
- DSCR
- —
- Eligible?
- —
Short-term bridge; refi at stabilization.
Listing history 13 events
-
2026-06-21days on market $90,000 Active 17 DOM
-
2026-06-21days on market $90,000 Active 16 DOM
-
2026-06-18days on market $90,000 Active 14 DOM
-
2026-06-17days on market $90,000 Active 13 DOM
-
2026-06-16days on market $90,000 Active 12 DOM
-
2026-06-15days on market $90,000 Active 11 DOM
-
2026-06-13days on market $90,000 Active 9 DOM
-
2026-06-12days on market $90,000 Active 8 DOM
-
2026-06-09days on market $90,000 Active 5 DOM
-
2026-06-08days on market $90,000 Active 4 DOM
-
2026-06-07days on market $90,000 Active 3 DOM
-
2026-06-07remarks 614-char remark
-
2026-06-07$90,000 Active 2 DOM
ⓘ Source: listings_history table (triggers on properties + properties_extension) + one-shot
backfill from property_details.listing_events for pre-trigger history.
Tax reassessment forecast MN · Partial reset (capped growth)
- Current annual tax
- $502 · $42/mo
- Projected year-2 tax
- $755 · $63/mo
- Expected delta
- +$253/yr (+$21/mo · 50.4%)
ⓘ Screening estimate from a state-policy table — verify with the county assessor before closing.
Nearby sold comps map
Loading sold comps map…
Walkable amenities ~0.75 mi
Loading nearby amenities…
Taxation est. · year 1
- Rental income
- $15,218
- − Mortgage interest
- −$5,041
- − Property taxes
- −$502
- − Insurance
- −$450
- − Repairs & maintenance
- −$1,217
- − Management
- −$1,217
- − Depreciation
- −$2,618
- Taxable income
- $4,172
- Est. tax owed @ 24.0%
- −$1,001
- After-tax cash flow
- $4,406/yr
For passive investors: Depreciation is non-cash, so a rental often shows a tax loss while cash-flowing — sheltering income. Rental losses are passive: they offset passive income freely, and up to $25,000/yr can offset ordinary (W-2) income if you actively participate and your MAGI is under $100k (phasing out to $0 by $150k); unused losses carry forward. On sale, claimed depreciation is recaptured at up to 25%, and gains may owe capital-gains tax (a 1031 exchange can defer both). Figures are a year-1 estimate at your 24.0% rate — not tax advice; consult a CPA.
Schools (NCES district)
- District
- New Ulm Public School District
- NCES district ID
- 2723490
- Math proficiency
- 51% ▼ -3.00%
- Reading proficiency
- 51% ▼ -7.00%
- Median HH income
- $53,171
- Composite
- 43.93/100
- National rank
- #2906
- State rank
- #104 of 301 in MN
Livability — Lafayette
- Score
- 64/100
- State rank
- #570
- US rank
- #13738
Category grades
Schools grade is shown separately in the Schools card above.
Census & demographics
- Census place
- Lafayette, MN
- Population (ZIP)
- 865
Population outlook (Nicollet County) Hauer SSP2
- Today (2025)
- 34,373 people
- By 2030
- 34,666 · +0.9%
- By 2040
- 34,616 · +0.7%
- By 2050
- 34,340 · -0.1%
- By 2075
- 33,171 · -3.5%
- By 2100
- 31,949 · -7.1%
Race, ethnicity, and origin ACS 2023
- Neighborhood character
- Predominantly White (97%)
- Race & ethnicity
- White 97% Two or more races 2%
- Common ancestry
- Portuguese 10% Lithuanian 5% Iranian 2%
- Foreign-born
- 0%
- Languages at home
- 98% English-only · German/W. Germanic 1% Spanish 1%
Political lean MEDSL · Nicollet
- 2024 margin
- Toss-up / Even · D 48.8% · R 49.3% · Other 1.9%
- 2008→2024 swing
- -11.0pp toward R · 2008: 10.5pp · 2024: -0.5pp
- All cycles
- 2024: R+0.5 2020: D+3.2 2016: R+3.1 2012: D+7.9 2008: D+10.5
Not yet ingested
- Civics
- —
Market trends
- HPI YoY
- ▲ 4.72%
- Current HPI
- 239.2149
- Rent YoY
- —
- Metro
- —
- State GDP YoY
- ▲ 2.41%
- F500 in state
- 34
Industry mix (Fortune 500 HQ in MN)
| Industry | F500 HQs | Revenue |
|---|---|---|
| Healthcare | 2 | $407B |
|
||
| Retail | 2 | $150B |
|
||
| Consumer Goods | 2 | $32B |
|
||
| Industrial Machinery | 2 | $6B |
|
||
| Agriculture | 1 | $40B |
|
||
| Healthcare / Medical Devices | 1 | $32B |
|
||
Price history
1 event — show timeline
- 2026-06-04 Listed $90,000 ForSaleByOwner.com
Property tax history
+1.3%/yrLatest (2025): $502 · -6.0% YoY. Source: county tax records.
Cash-flow waterfall
monthlySold comps — $/sqft
last 12 mo · ≤1 miLoading sold comps…