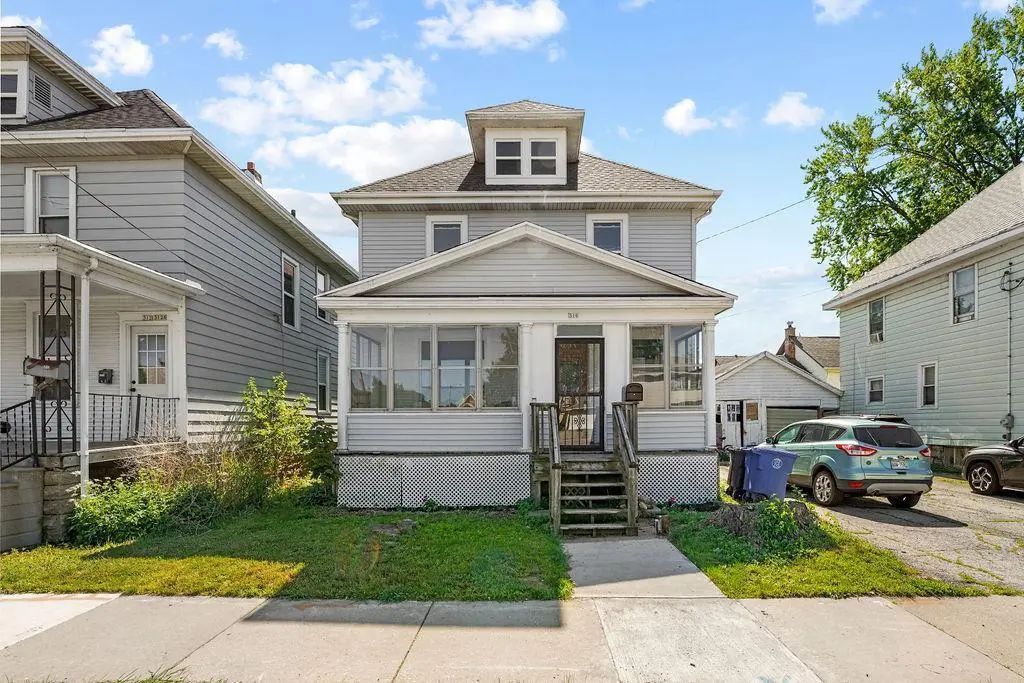
310 Broad St · Oshkosh, WI
Flood risk 1/10 · Minimal
- FEMA flood zone
- X (unshaded)
- Chance of flooding over 30 yrs
- 0.0%
- Est. flood insurance / yr
- $473 – $860
Fire risk 1/10 · Minimal
- Est. fire insurance / yr
- $636 – $1,182
Heat risk 2/10 · Minimal
- Hot days now (above 97°F)
- 7 days/yr
- Hot days in 30 yrs
- 13 days/yr
Wind risk 2/10 · Minimal
- Chance of severe wind over 30 yrs
- —
Air-quality risk 2/10 · Minimal
- Unhealthy air days now
- 1 days/yr
- Unhealthy air days in 30 yrs
- 2 days/yr
Risk factors via First Street. Map © Google.
Why this score? — see what drove the D grade
The composite is a weighted blend of 9 inputs, each scored 0–100. Each bar is that input's sub-score; the figure is the points it added to the 100-point composite (weight × sub-score).
- Cash flow +13.9/30.0
- ARV discount +7.5/15.0
- DSCR +4.2/10.0
- Livability +4.2/5.0
- 1% rule +3.7/10.0
- Rent growth +3.7/5.0
- Schools +2.9/10.0
- Condition / age +2.5/5.0
- Appreciation +0.0/10.0
$224,900
🖨 Deal sheet (PDF) 📄 Offer letter ✓ Due diligence
Listing remarks
Welcome to a spectacular, newly renovated home located at 310 Broad St in Oshkosh. This impressive, two-story residence boasts a spacious and functional layout featuring 4 generous bedrooms and 2 full bathrooms. Experience the perfect blend of classic charm and modern convenience with fresh renovations throughout, making this property completely move-in ready. An ideal opportunity for anyone seeking a turn-key home in a desirable Oshkosh location.
Key facts
- 3,484 sq ft lot
- Garage
- Built 1905
Property features AI
Finance
- Other: Includes refrigerator, stove, washer and dryer; Sellers' personal property excluded
Exterior
- Parking: Detached 1-car garage
- Utilities: Municipal water; Municipal sewer; Natural gas
- Home design: Two-story single-family home; Construction completed
- Construction: Estimated 1,751–2,000 finished square feet above grade
- Exterior features: Vinyl exterior; Lot less than 1/2 acre
Interior
- Kitchen: Kitchen on main level — 12 x 13; Refrigerator; Range/Oven
- Bedrooms: Master bedroom (Upper) — 11 x 14; Bedroom 2 (Upper) — 12 x 10; Bedroom 3 (Upper) — 10 x 10; Bedroom 4 (Upper) — 11 x 12
- Bathrooms: 2 full bathrooms
- Heating & cooling: Forced air heating (natural gas)
- Interior features: Full basement with stone foundation; Foyer/vestibule
- Laundry & utility: Washer and Dryer
Neighborhood map
What this means for you Summary
Snapshot
- This is a 4-bed/2.0-bath other listed at $225k.
Deal economics
- At list price, monthly cash flow is $24 ($292/yr) — positive.
- The deal already cash-flows at list — no discount required.
- To meet the 1% rule (rent ≥ 1% of price), the offer needs to be $196k (12.7% below list).
- Recommended offer: $196k (12.7% below list) — sets the bar for 1% rule.
- Cap rate 6.4% vs local median 3.7% in Oshkosh — top-decile yield for the area; either an underpriced asset or a hidden risk that comps aren't pricing in. Stress-test before assuming the spread holds.
Location & tenants
- Location reads 85/100 on livability (#29 in WI, #574 nationally) — a professional / high-income tenant draw. Strengths: cost of living A+, housing A+, health & safety A+.
- Oshkosh Area School District (urban): math 33% / reading 34% proficiency, ranked #246 of 342 in WI (top 72%) — families likely to look elsewhere, expect single-tenant / working-renter base with shorter leases.
- Market conditions: Rents rising fast (+5.0%/yr); 82 active listings in the ZIP; 16 comparable units currently listed for rent nearby; rentals at typical pace (median 22d on market — plan ~3-4 weeks tenant-placement turnaround); 652 units permitted in Winnebago County in 2024 (333 in 5+ unit buildings).
- This rent runs 38% of the median local income ($62k/yr) — at the standard rent-burdened threshold; future hikes will face affordability resistance.
Forward outlook
- Local home prices are declining (-3.0%/yr); year-one equity from $2k of loan paydown is wiped out by about $7k of value loss. Plan a longer hold.
- Winnebago County population projected at +3% by 2050 — modest demand growth; plan on rents tracking national, not racing it.
Negotiation context
- It's been on market 21 days — a 2% lower offer ($222k) is reasonable based on typical stale-listing flexibility.
- Current owner paid $175k; 29% above their basis — modest negotiation headroom, anchor on the comps not their cost.
Risks & watch-outs
- Watch-outs: built in 1905 — expect roof / HVAC / electrical / plumbing capex.
Questions for the listing agent
- Built in 1905 — when were the roof, HVAC, electrical panel, plumbing, and water heater last replaced?
- Is there a deadline driving the sale (1031 exchange, divorce, estate, relocation)? That informs how much negotiation room exists.
- The area grade is low — what's the realistic commute time and amenity access for the typical tenant pool here? Any planned neighborhood developments (good or bad) we should know about?
- What's the average days-on-market for RENTAL listings here right now (not sales)? A rising rental-DOM trend means longer vacancies and softer asking-rent achievability than the comps imply.
- What's the recent tenant-quality profile in this submarket — average credit score on applications, eviction rate, late-payment / NSF rate, and stable-employment percentage? A property-management company in the area should have these aggregated.
- How much new for-sale + rental construction is in the pipeline within 1–3 miles? Heavy new supply typically softens prices + rents 12–24 months out; constrained supply supports both.
Investment metrics
- 1% rule
- 0.87% ✗
- Cap rate
- 6.42%
- Cash-on-cash
- 0.46%
- DSCR
- 1.02
- GRM
- 9.5
CMA / ARV
No comps found within radius.
Projected returns pro-forma
-3.0% appreciation · 4.97% rent growth · sell at horizon
- IRR
- -13.4%
- Equity multiple
- 0.51×
- Total profit
- $-30,913
- Equity at exit
- $33,533
- IRR
- -1.7%
- Equity multiple
- 0.87×
- Total profit
- $-7,919
- Equity at exit
- $19,445
Cash invested: $62,972 (down + closing). Projections, not guarantees.
Landlord ↔ Tenant lean methodology
- Overall (STATE)
- 73 Landlord-Friendly
- State Wisconsin
- 73 Landlord-Friendly · R+2
- County
- — inherits STATE
- City
- — inherits STATE
ZIP-level market 54901
- Rents YoY
- 5.0%
- Active inventory
- 82
- Price-to-rent
- 9.5×
Monthly cashflow live
- Estimated rent
- $1,963 high interval (Pro) →
- Mortgage (P&I)
- −$1,179
- Tax from tax record
- −$254 /mo · $3,044/yr
- Insurance
- −$94
- HOA
- −$0
- Vacancy / Maint / Mgmt
- −$412
- Net cashflow
- $24
Break-even live
Sensitivity live
| Price | -10% $152 | -5% $88 | +0% $24 | +5% $-39 | +10% $-103 |
|---|---|---|---|---|---|
| Rent | -10% $-131 | -5% $-53 | +0% $24 | +5% $102 | +10% $179 |
| Rate | -1.0pp $138 | -0.5pp $82 | base $24 | +0.5pp $-34 | +1.0pp $-93 |
UW: 25.0% down · 7.5% · 30yr · 1.5% tax · 5.0% vac · 8.0% maint · 8.0% mgmt
Financing live
Cash to close
- Down payment
- $56,225
- Closing costs
- $6,747
- Reserves months
- —
- Total cash needed
- —
Loan-product check · same deal, 3 products live
Conventional
25% down · 7.5% · 30yr
- Down + closing
- —
- Monthly P&I
- —
- Monthly cashflow
- —
- DSCR
- —
- Eligible?
- —
Personal DTI + credit; lowest rate.
DSCR
20% down · 8.5% · 30yr
- Down + closing
- —
- Monthly P&I
- —
- Monthly cashflow
- —
- DSCR
- —
- Eligible?
- —
No personal income docs; deal must DSCR.
Hard money
10% down · 12.0% · 12mo
- Down + closing
- —
- Monthly P&I
- —
- Monthly cashflow
- —
- DSCR
- —
- Eligible?
- —
Short-term bridge; refi at stabilization.
Rent comps 16 comps
| Address | Beds | Baths | Sqft | Rent | $/sqft | DOM | Units | Dist |
|---|---|---|---|---|---|---|---|---|
| 513 Evans St Unit 1514469P Oshkosh, WI | 3.0 | 1.5 | 1270 | $2,909 | $2.29 | 22d | 1 | 0.34mi |
| 319 E Irving Ave Oshkosh, WI | 3.0 | 1.5 | 1384 | $1,250 | $0.90 | 44d | 1 | 0.53mi |
| 1113 Harney Ave Unit 1061625P Oshkosh, WI | 3.0 | 2.0 | 1991 | $3,154 | $1.58 | 14d | 1 | 0.55mi |
| 685 Franklin St Unit B Oshkosh, WI | 4.0 | 2.0 | 1721 | $1,700 | $0.99 | 22d | 1 | 0.72mi |
| 95 Dawes St Oshkosh, WI | 3.0 | 2.0 | 1520 | $1,650 | $1.09 | 44d | 1 | 0.72mi |
| 728 Franklin St Oshkosh, WI | 5.0 | 1.0 | 1540 | $2,250 | $1.46 | 22d | 1 | 0.77mi |
| 500 Marion Rd Unit F204 Oshkosh, WI | 4.0 | 2.0 | 1528 | $2,000 | $1.31 | 22d | 1 | 0.77mi |
| 306 Wisconsin St Oshkosh, WI | 3.0 | 1.0 | 1500 | $1,500 | $1.00 | 44d | 1 | 0.79mi |
| 306 Wisconsin St Oshkosh, WI | 4.0 | 1.0 | 1500 | $2,000 | $1.33 | 22d | 1 | 0.79mi |
| 418 W Irving Ave Oshkosh, WI | 4.0 | 1.5 | 1536 | $2,225 | $1.45 | 44d | 1 | 0.80mi |
| 733 Wright St Oshkosh, WI | 5.0 | 2.0 | 1642 | $2,200 | $1.34 | 44d | 1 | 0.86mi |
| 825 Wisconsin St Apt 3A Oshkosh, WI | 4.0 | 1.0 | 1400 | $1,449 | $1.03 | 44d | 1 | 0.98mi |
| 825 Wisconsin St Unit 2C Oshkosh, WI | 4.0 | 1.0 | 1400 | $1,399 | $1.00 | 22d | 1 | 0.98mi |
| 835 Wisconsin St Unit 2D Oshkosh, WI | 4.0 | 1.0 | 1400 | $1,399 | $1.00 | 22d | 1 | 0.99mi |
| 1745 Oregon St Oshkosh, WI | 1.0–3.0 | 1.0–2.0 | 1079 | $1,491 | $1.38 | 14d | 6 | 1.32mi |
| 904 W 8th Ave Oshkosh, WI | 3.0 | 1.0 | 1759 | $1,600 | $0.91 | 14d | 1 | 1.47mi |
Listing history 16 events
-
2026-06-19days on market $224,900 Active 21 DOM
-
2026-06-18days on market $224,900 Active 20 DOM
-
2026-06-17days on market $224,900 Active 19 DOM
-
2026-06-16days on market $224,900 Active 18 DOM
-
2026-06-15days on market $224,900 Active 17 DOM
-
2026-06-14days on market $224,900 Active 15 DOM
-
2026-06-13days on market $224,900 Active 14 DOM
-
2026-06-10days on market $224,900 Active 12 DOM
-
2026-06-09days on market $224,900 Active 11 DOM
-
2026-06-08days on market $224,900 Active 10 DOM
-
2026-06-07days on market $224,900 Active 9 DOM
-
2026-06-02days on market $224,900 Active 4 DOM
-
2026-06-01days on market $224,900 Active 3 DOM
-
2026-05-31days on market $224,900 Active 2 DOM
-
2026-05-30remarks 451-char remark
-
2026-05-30$224,900 Active 1 DOM
ⓘ Source: listings_history table (triggers on properties + properties_extension) + one-shot
backfill from property_details.listing_events for pre-trigger history.
Tax reassessment forecast WI · Partial reset (capped growth)
- Current annual tax
- $3,044 · $254/mo
- Projected year-2 tax
- $3,602 · $300/mo
- Expected delta
- +$558/yr (+$47/mo · 18.3%)
ⓘ Screening estimate from a state-policy table — verify with the county assessor before closing.
Climate risk First Street
- Flood 1/10 Low FEMA zone X (unshaded) · 0% chance over 30 yrs
- Wildfire 1/10 Low
- Heat 2/10 Low 7 d/yr ≥97°F today · 13 d/yr by 30 yrs out
- Wind 2/10 Low
- Air quality 2/10 Low 1 unhealthy d/yr today · 2 by 30 yrs out
Nearby sold comps map
Loading sold comps map…
Walkable amenities ~0.75 mi
Loading nearby amenities…
Taxation est. · year 1
- Rental income
- $23,561
- − Mortgage interest
- −$12,598
- − Property taxes
- −$3,044
- − Insurance
- −$1,124
- − Repairs & maintenance
- −$1,885
- − Management
- −$1,885
- − Depreciation
- −$6,543
- Taxable loss
- −$3,518
- Est. tax savings @ 24.0%
- +$844
- After-tax cash flow
- $1,136/yr
For passive investors: Depreciation is non-cash, so a rental often shows a tax loss while cash-flowing — sheltering income. Rental losses are passive: they offset passive income freely, and up to $25,000/yr can offset ordinary (W-2) income if you actively participate and your MAGI is under $100k (phasing out to $0 by $150k); unused losses carry forward. On sale, claimed depreciation is recaptured at up to 25%, and gains may owe capital-gains tax (a 1031 exchange can defer both). Figures are a year-1 estimate at your 24.0% rate — not tax advice; consult a CPA.
Schools (NCES district)
- District
- Oshkosh Area School District
- NCES district ID
- 5511190
- Math proficiency
- 33% ▼ -7.00%
- Reading proficiency
- 34% ▼ -2.00%
- Median HH income
- $48,048
- Composite
- 28.92/100
- National rank
- #6634
- State rank
- #246 of 342 in WI
Livability — Oshkosh
- Score
- 85/100
- State rank
- #29
- US rank
- #574
Category grades
Schools grade is shown separately in the Schools card above.
Census & demographics
- Census place
- Oshkosh, WI
- County
- Winnebago County · 155,689 people
- City population
- 81,810
- Metro
- Oshkosh-Neenah, WI
- Population (ZIP)
- 37,294
- Household income
- $61,794
- Rent vs Own
- Severe rent burden
- 1484.0
Population outlook (Winnebago County) Hauer SSP2
- Today (2025)
- 175,480 people
- By 2030
- 177,928 · +1.4%
- By 2040
- 180,873 · +3.1%
- By 2050
- 181,302 · +3.3%
- By 2075
- 184,071 · +4.9%
- By 2100
- 175,932 · +0.3%
Race, ethnicity, and origin ACS 2023
- Neighborhood character
- Predominantly White (80%)
- Race & ethnicity
- White 80% Black 6% Hispanic / Latino 6% Two or more races 5% Asian 4%
- Hispanic origin (detail)
- Mexican 3% Puerto Rican 2%
- Common ancestry
- Romanian 6% Portuguese 4% Lithuanian 2%
- Foreign-born
- 4% · Canada
- Languages at home
- 93% English-only · Other Asian/Pacific 2% Spanish 2% Arabic 1%
Political lean MEDSL · Winnebago
- 2024 margin
- Toss-up / Even · D 46.9% · R 51.7% · Other 1.4%
- 2008→2024 swing
- -16.4pp toward R · 2008: 11.7pp · 2024: -4.8pp
- All cycles
- 2024: R+4.8 2020: R+4.0 2016: R+7.4 2012: D+3.8 2008: D+11.7
Not yet ingested
- Civics
- —
Market trends
- HPI YoY
- ▼ -128.12%
- Current HPI
- 187.7253
- Rent YoY
- ▲ 4.97%
- Metro
- Oshkosh-Neenah, WI
- State GDP YoY
- ▲ 2.10%
- F500 in state
- 20
Industry mix (Fortune 500 HQ in WI)
| Industry | F500 HQs | Revenue |
|---|---|---|
| Industrial Machinery | 4 | $23B |
|
||
| Industrial Technology | 2 | $36B |
|
||
| Insurance | 1 | $36B |
|
||
| Professional Services | 1 | $19B |
|
||
| Utilities | 1 | $9B |
|
||
| Consumer Goods | 1 | $3B |
|
||
Price history
+423.0% since first listed4 events — show timeline
- 2026-05-28 Listed $224,900 RANW
- 2024-04-17 Sold (Public Records) $174,900 Public Records
- 2002-07-19 Sold (Public Records) $62,000 Public Records
- 2000-03-02 Sold (Public Records) $43,000 Public Records
Property tax history
+5.7%/yrLatest (2024): $3,044 · +103.3% YoY. Source: county tax records.
Cash-flow waterfall
monthlySold comps — $/sqft
last 12 mo · ≤1 miLoading sold comps…