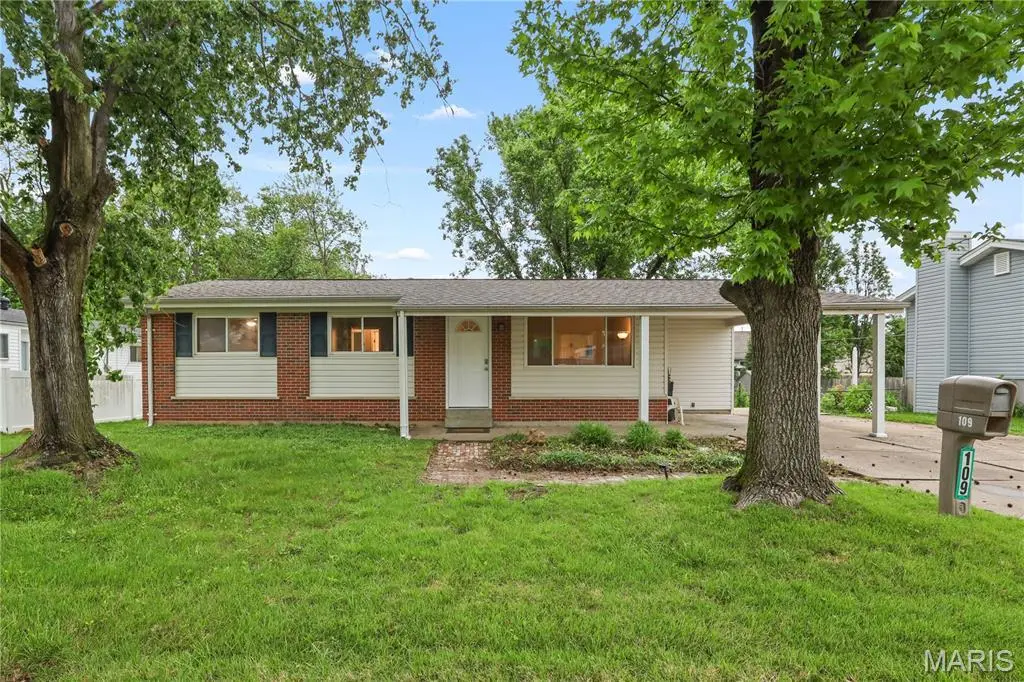
109 Morningside Ln · O'Fallon, MO
Flood risk 1/10 · Minimal
- FEMA flood zone
- X (unshaded)
- Chance of flooding over 30 yrs
- 0.0%
- Est. flood insurance / yr
- $473 – $860
Fire risk 1/10 · Minimal
- Est. fire insurance / yr
- $1,054 – $1,958
Heat risk 5/10 · Moderate
- Hot days now (above 108°F)
- 7 days/yr
- Hot days in 30 yrs
- 20 days/yr
Wind risk 2/10 · Minimal
- Chance of severe wind over 30 yrs
- 1.0%
Air-quality risk 2/10 · Minimal
- Unhealthy air days now
- 1 days/yr
- Unhealthy air days in 30 yrs
- 1 days/yr
Risk factors via First Street. Map © Google.
Why this score? — see what drove the D- grade
The composite is a weighted blend of 9 inputs, each scored 0–100. Each bar is that input's sub-score; the figure is the points it added to the 100-point composite (weight × sub-score).
- Cash flow +12.5/30.0
- ARV discount +5.6/15.0
- Schools +5.1/10.0
- Rent growth +4.4/5.0
- DSCR +3.7/10.0
- 1% rule +3.0/10.0
- Livability +2.5/5.0
- Condition / age +2.5/5.0
- Appreciation +0.0/10.0
$249,900
🖨 Deal sheet (PDF) 📄 Offer letter ✓ Due diligence
Listing remarks
Welcome home to affordable luxury! This newly remodeled O'Fallon ranch features a new kitchen and bathrooms, fresh paint, refinished hardwood floors, updated lighting, a covered carport, and a comfortable deck overlooking the fenced yard. The kitchen offers new white cabinetry and counters, waterproof flooring, and brand-new stainless appliances that stay. Major improvements include a new roof, new water heater, and new electric panel. The full unfinished basement provides excellent storage, laundry/workspace area, or future finishing potential. No HOA!
Key facts
- 8,999 sq ft lot
- Parking
- Built 1964
Property features AI
Finance
- Other: Private ownership; Seller may consider concessions; Lease not considered
Exterior
- Parking: Has a 1-space carport
- Security: Smoke detector(s)
- Utilities: Public water; Public sewer; Electric service by Ameren; Cable available; Electricity connected; Natural gas connected; Phone available; Sewer connected; Water connected
- Home design: Single-family residence; Updated/remodeled condition; One story; House structure
- Construction: Brick veneer and vinyl siding exterior; Architectural shingle roof; Basement present
- Exterior features: Entry steps/stairs; Private yard; Back yard; Few trees; Front yard; Level lot; Near public transit; Private lot; Chain link fencing (full fence)
Interior
- Kitchen: ENERGY STAR qualified stainless steel appliances; Dishwasher; Disposal; Exhaust fan; Microwave; Gas oven; Self-cleaning oven; Range / Range hood; Free-standing gas range; Refrigerator; Pantry
- Bedrooms: Three bedrooms, all on the main level
- Flooring: Hardwood; Laminate
- Bathrooms: One full bathroom; One half bathroom
- Heating & cooling: Forced air heating (natural gas); Central air conditioning; Ceiling fans
- Interior features: Ceiling fans; Eat-in kitchen; Open floorplan; Pantry; Basement (full, unfinished); Smoke detector(s)
- Laundry & utility: Dedicated laundry room; Gas water heater
Neighborhood map
What this means for you Summary
Snapshot
- This is a 3-bed/1.5-bath single-family listed at $250k.
Deal economics
- At list price, monthly cash flow is $-37 ($-446/yr) — negative.
- To cash-flow at today's rent, offer at most $243k (2.6% below list).
- To meet the 1% rule (rent ≥ 1% of price), the offer needs to be $200k (20.1% below list).
- Recommended offer: $200k (20.1% below list) — sets the bar for 1% rule.
- Cap rate 6.1% vs local median 3.2% in O'Fallon — top-decile yield for the area; either an underpriced asset or a hidden risk that comps aren't pricing in. Stress-test before assuming the spread holds.
Location & tenants
- Location reads: area grade D — affects rentability + tenant quality, not the cash-flow math above.
- Ft. Zumwalt R-II (suburban): math 54% / reading 60% proficiency, ranked #14 of 324 in MO (top 4%) — acceptable for families but not a draw, mixed tenant base, ~2y average lease; only 18% free/reduced lunch — higher-income household profile.
- Zoned schools: Westhoff Elem. (math 48% / reading 52%, grade D+, #280 of 1,115 statewide, top 25%, 545 students, 21% FRL); Ft. Zumwalt North High (math 49% / reading 58%, grade C-, #83 of 521 statewide, top 16%, 1,497 students, 18% FRL) — zoned schools at 19% FRL track the district average.
- Market conditions: Rents rising fast (+7.4%/yr); 254 active listings in the ZIP; 8 comparable units currently listed for rent nearby; rentals leasing fast (median 13d on market — plan ~1-2 weeks tenant-placement turnaround); solid renter incomes; 2,021 units permitted in St. Charles County in 2024 (568 in 5+ unit buildings).
Forward outlook
- Local home prices are declining (-3.0%/yr); year-one equity from $2k of loan paydown is wiped out by about $7k of value loss. Plan a longer hold.
- St. Charles County population projected at +22% by 2050 — long-run rental-demand tailwind backs the buy-and-hold thesis.
Negotiation context
- Only 6 days on market — expect competitive offers; lowballing is unlikely to land.
- Current owner paid $73k; list at $250k implies a 241% gain — meaningful room to come down on a strong offer.
Risks & watch-outs
- Climate carrying-cost: extreme-heat days projected 7→20/yr by 2055 (HVAC capex compounding) — expect insurance premiums to compound above CPI over the hold.
Questions for the listing agent
- What do current leases actually rent for vs. the listed asking? Can we see a recent rent roll and the last 12 months of T-12 income?
- Built in 1964 — when were the roof, HVAC, electrical panel, plumbing, and water heater last replaced?
- Is there a deadline driving the sale (1031 exchange, divorce, estate, relocation)? That informs how much negotiation room exists.
- The area grade is low — what's the realistic commute time and amenity access for the typical tenant pool here? Any planned neighborhood developments (good or bad) we should know about?
- What's the average days-on-market for RENTAL listings here right now (not sales)? A rising rental-DOM trend means longer vacancies and softer asking-rent achievability than the comps imply.
- What's the recent tenant-quality profile in this submarket — average credit score on applications, eviction rate, late-payment / NSF rate, and stable-employment percentage? A property-management company in the area should have these aggregated.
- How much new for-sale + rental construction is in the pipeline within 1–3 miles? Heavy new supply typically softens prices + rents 12–24 months out; constrained supply supports both.
Investment metrics
- 1% rule
- 0.80% ✗
- Cap rate
- 6.11%
- Cash-on-cash
- -0.64%
- DSCR
- 0.97
- GRM
- 10.4
CMA / ARV
- ARV (on-the-fly)
- $239,984
- Comps found
- 12
Show comp detail 12 sales within ~0.75 mi
| Address | Dist | Beds/Ba | Sqft | Sold | Price | $/sf | Match |
|---|---|---|---|---|---|---|---|
| 204 Briscoe Ave | 0.29mi | 3/1.0 | 1,151 (+2%) | 9mo | $225,000 | $195 | 74 |
| 201 Allen Dr | 0.41mi | 3/1.5 | 1,090 (-4%) | 1mo | $234,000 | $215 | 74 |
| 904 Saint Paul Ln | 0.38mi | 4/1.5 (+1) | 1,130 (-0%) | 7mo | $120,000 | $106 | 71 |
| 555 Knob Hill Dr | 0.36mi | 3/2.0 | 1,057 (-7%) | 8mo | $214,900 | $203 | 63 |
| 502 Allen Dr | 0.60mi | 3/1.5 | 1,174 (+4%) | 8mo | $240,000 | $204 | 59 |
| 411 Saint Christopher Dr | 0.75mi | 3/1.5 | 1,130 (-0%) | 8mo | $259,900 | $230 | 58 |
| 1343 Goldenrod Dr | 0.28mi | 3/2.0 | 1,022 (-10%) | 14mo | $264,900 | $259 | 57 |
| 771 Homerun Dr | 0.51mi | 2/2.0 (-1) | 1,172 (+4%) | 9mo | $265,000 | $226 | 56 |
| 909 Saint Bernard Dr | 0.42mi | 3/1.0 | 1,036 (-8%) | 14mo | $120,000 | $116 | 53 |
| 301 Bittersweet Dr | 0.26mi | 3/2.0 | 1,296 (+14%) | 14mo | $275,000 | $212 | 50 |
| 411 Saint Joseph Ave | 0.65mi | 3/1.5 | 1,000 (-12%) | 7mo | $249,000 | $249 | 45 |
| 403 Saint Christopher Dr | 0.72mi | 3/1.5 | 1,235 (+9%) | 13mo | $240,000 | $194 | 40 |
Match score weights: distance 35% · size 25% · config 20% · recency 20%. Top-matched comps best support the ARV.
Projected returns pro-forma
-3.0% appreciation · 7.43% rent growth · sell at horizon
- IRR
- -12.8%
- Equity multiple
- 0.52×
- Total profit
- $-33,607
- Equity at exit
- $37,261
- IRR
- 1.6%
- Equity multiple
- 1.13×
- Total profit
- $9,318
- Equity at exit
- $21,607
Cash invested: $69,972 (down + closing). Projections, not guarantees.
Landlord ↔ Tenant lean methodology
- Overall (STATE)
- 81 Strongly Landlord-Friendly
- State Missouri
- 81 Strongly Landlord-Friendly · R+10
- County
- — inherits STATE
- City
- — inherits STATE
ZIP-level market 63366
- Rents YoY
- 7.4%
- Active inventory
- 254
- Price-to-rent
- 10.4×
Monthly cashflow live
- Estimated rent
- $1,996 high interval (Pro) →
- Mortgage (P&I)
- −$1,311
- Tax from tax record
- −$199 /mo · $2,390/yr
- Insurance
- −$104
- HOA
- −$0
- Vacancy / Maint / Mgmt
- −$419
- Net cashflow
- $-37
Break-even live
Sensitivity live
| Price | -10% $104 | -5% $34 | +0% $-37 | +5% $-108 | +10% $-179 |
|---|---|---|---|---|---|
| Rent | -10% $-195 | -5% $-116 | +0% $-37 | +5% $42 | +10% $121 |
| Rate | -1.0pp $89 | -0.5pp $26 | base $-37 | +0.5pp $-102 | +1.0pp $-168 |
UW: 25.0% down · 7.5% · 30yr · 1.5% tax · 5.0% vac · 8.0% maint · 8.0% mgmt
Financing live
Cash to close
- Down payment
- $62,475
- Closing costs
- $7,497
- Reserves months
- —
- Total cash needed
- —
Loan-product check · same deal, 3 products live
Conventional
25% down · 7.5% · 30yr
- Down + closing
- —
- Monthly P&I
- —
- Monthly cashflow
- —
- DSCR
- —
- Eligible?
- —
Personal DTI + credit; lowest rate.
DSCR
20% down · 8.5% · 30yr
- Down + closing
- —
- Monthly P&I
- —
- Monthly cashflow
- —
- DSCR
- —
- Eligible?
- —
No personal income docs; deal must DSCR.
Hard money
10% down · 12.0% · 12mo
- Down + closing
- —
- Monthly P&I
- —
- Monthly cashflow
- —
- DSCR
- —
- Eligible?
- —
Short-term bridge; refi at stabilization.
Rent comps 8 comps
| Address | Beds | Baths | Sqft | Rent | $/sqft | DOM | Units | Dist |
|---|---|---|---|---|---|---|---|---|
| 229 Old Schaeffer Ln Unit O O'Fallon, MO | 2.0 | 2.0 | 1202 | $2,350 | $1.96 | 13d | 1 | 0.31mi |
| 555 Whitegate Dr O'Fallon, MO | 2.0 | 1.5 | 1000 | $1,650 | $1.65 | 24d | 1 | 0.39mi |
| 16 Homefield Gardens Dr O'Fallon, MO | 2.0 | 2.0 | 992 | $1,500 | $1.51 | 20d | 1 | 0.61mi |
| 16 Homefield Gardens Dr O'Fallon, MO | 2.0 | 2.0 | 992 | $1,600 | $1.61 | 17d | 1 | 0.61mi |
| 1606 Homefield Meadows Dr O Fallon, MO | 2.0 | 2.0 | 1124 | $1,692 | $1.51 | 2d | 1 | 0.82mi |
| 204 N Main St O'Fallon, MO | 1.0–2.0 | 1.0 | 611 | $1,704 | $2.79 | 2d | 8 | 0.87mi |
| 20 Rodrick Dr O Fallon, MO | 4.0 | 2.0 | 1250 | $2,250 | $1.80 | 5d | 1 | 1.32mi |
| 200 Casalon Pkwy O'Fallon, MO | 1.0–2.0 | 1.0 | 741 | $1,854 | $2.50 | 2d | 23 | 1.37mi |
Listing history 5 events
-
2026-05-05status Pending
-
2026-04-30$249,900 Active
-
2026-04-29historical $249,900
-
1997-04-01soldstatus $73,200
-
1982-10-01soldstatus $43,500
ⓘ Source: listings_history table (triggers on properties + properties_extension) + one-shot
backfill from property_details.listing_events for pre-trigger history.
Tax reassessment forecast MO · Resets to sale price
- Current annual tax
- $2,390 · $199/mo
- Projected year-2 tax
- $2,424 · $202/mo
- Expected delta
- +$34/yr (+$3/mo · 1.4%)
ⓘ Screening estimate from a state-policy table — verify with the county assessor before closing.
Climate risk First Street
- Flood 1/10 Low FEMA zone X (unshaded) · 0% chance over 30 yrs
- Wildfire 1/10 Low
- Heat 5/10 Major 7 d/yr ≥108°F today · 20 d/yr by 30 yrs out
- Wind 2/10 Low 100% chance of damaging wind over 30 yrs
- Air quality 2/10 Low 1 unhealthy d/yr today · 1 by 30 yrs out
Nearby sold comps map
Loading sold comps map…
Walkable amenities ~0.75 mi
Loading nearby amenities…
Taxation est. · year 1
- Rental income
- $23,950
- − Mortgage interest
- −$13,998
- − Property taxes
- −$2,390
- − Insurance
- −$1,250
- − Repairs & maintenance
- −$1,916
- − Management
- −$1,916
- − Depreciation
- −$7,270
- Taxable loss
- −$4,790
- Est. tax savings @ 24.0%
- +$1,150
- After-tax cash flow
- $704/yr
For passive investors: Depreciation is non-cash, so a rental often shows a tax loss while cash-flowing — sheltering income. Rental losses are passive: they offset passive income freely, and up to $25,000/yr can offset ordinary (W-2) income if you actively participate and your MAGI is under $100k (phasing out to $0 by $150k); unused losses carry forward. On sale, claimed depreciation is recaptured at up to 25%, and gains may owe capital-gains tax (a 1031 exchange can defer both). Figures are a year-1 estimate at your 24.0% rate — not tax advice; consult a CPA.
Schools (NCES district)
- District
- Ft. Zumwalt R-II
- NCES district ID
- 2908370
- Math proficiency
- 54% ▼ -7.00%
- Reading proficiency
- 60% ▼ -4.00%
- Median HH income
- $75,817
- Composite
- 51.04/100
- National rank
- #1772
- State rank
- #14 of 324 in MO
Livability — O'Fallon
No livability data for this city. (Only ~50 U.S. cities are tracked.)
Census & demographics
- Census place
- O'Fallon, MO
- County
- Saint Charles County · 399,703 people
- City population
- 45,862
- Metro
- St. Louis, MO-IL
- Population (ZIP)
- 54,769
- Household income
- $100,621
- Rent vs Own
- Severe rent burden
- 869.0
Population outlook (St. Charles County) Hauer SSP2
- Today (2025)
- 437,857 people
- By 2030
- 461,707 · +5.4%
- By 2040
- 503,222 · +14.9%
- By 2050
- 534,684 · +22.1%
- By 2075
- 597,047 · +36.4%
- By 2100
- 609,682 · +39.2%
Race, ethnicity, and origin ACS 2023
- Neighborhood character
- Predominantly White (81%)
- Race & ethnicity
- White 81% Two or more races 8% Hispanic / Latino 6% Black 5% Asian 3%
- Hispanic origin (detail)
- Mexican 3%
- Common ancestry
- Lithuanian 3% Romanian 3% Italian 3%
- Foreign-born
- 5% · Canada, Vietnam, South Korea
- Languages at home
- 94% English-only · Spanish 2% Vietnamese 1% Other Asian/Pacific 1%
Political lean MEDSL · St. Charles
- 2024 margin
- R (+17.0) · D 40.8% · R 57.8% · Other 1.4%
- 2008→2024 swing
- -7.2pp toward R · 2008: -9.7pp · 2024: -17.0pp
- All cycles
- 2024: R+17.0 2020: R+17.5 2016: R+26.4 2012: R+21.0 2008: R+9.7
Not yet ingested
- Civics
- —
Market trends
- HPI YoY
- ▼ -219.79%
- Current HPI
- 226.7579
- Rent YoY
- ▲ 7.43%
- Metro
- St. Louis, MO-IL
- State GDP YoY
- ▲ 1.84%
- F500 in state
- 20
Industry mix (Fortune 500 HQ in MO)
| Industry | F500 HQs | Revenue |
|---|---|---|
| Healthcare | 1 | $163B |
|
||
| Insurance | 1 | $21B |
|
||
| Industrial Technology | 1 | $17B |
|
||
| Retail | 1 | $16B |
|
||
| Industrial Distribution | 1 | $10B |
|
||
| Utilities | 1 | $9B |
|
||
Price history
+474.5% since first listed5 events — show timeline
- 2026-05-05 Pending — MARIS as Distributed by MLS Grid
- 2026-04-30 Listed $249,900 MARIS as Distributed by MLS Grid
- 2026-04-29 Coming Soon $249,900 MARIS as Distributed by MLS Grid
- 1997-04-01 Sold (Public Records) $73,200 Public Records
- 1982-10-01 Sold (Public Records) $43,500 Public Records
Property tax history
+5.9%/yrLatest (2025): $2,390 · +0.2% YoY. Source: county tax records.
Cash-flow waterfall
monthlySold comps — $/sqft
last 12 mo · ≤1 miLoading sold comps…