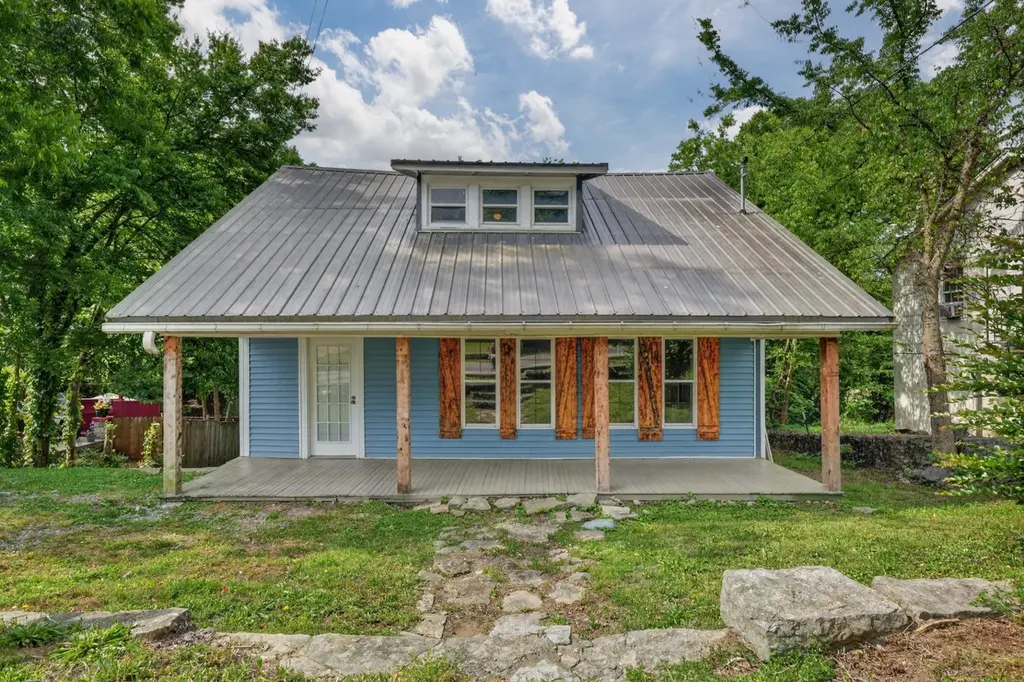
408 Washington St W · Fayetteville, TN
Flood risk 1/10 · Minimal
- FEMA flood zone
- X (unshaded)
- Chance of flooding over 30 yrs
- 0.0%
- Est. flood insurance / yr
- $507 – $1,088
Fire risk 3/10 · Minor
- Est. fire insurance / yr
- $949 – $1,763
Heat risk 6/10 · Moderate
- Hot days now (above 105°F)
- 7 days/yr
- Hot days in 30 yrs
- 20 days/yr
Wind risk 4/10 · Minor
- Chance of severe wind over 30 yrs
- 13.0%
Air-quality risk 1/10 · Minimal
- Unhealthy air days now
- 0 days/yr
- Unhealthy air days in 30 yrs
- 0 days/yr
Risk factors via First Street. Map © Google.
Why this score? — see what drove the D grade
The composite is a weighted blend of 9 inputs, each scored 0–100. Each bar is that input's sub-score; the figure is the points it added to the 100-point composite (weight × sub-score).
- Cash flow +15.7/30.0
- ARV discount +7.5/15.0
- DSCR +4.8/10.0
- Livability +3.2/5.0
- 1% rule +3.0/10.0
- Rent growth +2.5/5.0
- Condition / age +2.5/5.0
- Schools +1.7/10.0
- Appreciation +0.0/10.0
$145,000
🖨 Deal sheet 📄 Offer letter ✓ Due diligence
Listing remarks
Updated and adorable! 2 Bedroom, 1 bath home in town features new flooring throughout, tiled shower, and a private, level backyard. Perfect investment property or starter home!
Key facts
- New flooring
- Tiled shower
- 7,840 sq ft lot
Tags
Property features AI
Finance
- Financial info: Annual tax amount listed (see broker for details)
Exterior
- Parking: No covered or designated parking spaces listed
- Utilities: Public water; Public sewer; Natural gas available
- Home design: Single-family residence; One-story home
- Construction: Vinyl siding; Existing home
- Exterior features: Lot approximately 0.18 acre (60 x 140 irregular); Public water and sewer available
Interior
- Kitchen: Electric range; Refrigerator
- Bedrooms: Two bedrooms on the main level
- Flooring: Carpet; Laminate
- Bathrooms: One full bathroom
- Heating & cooling: Natural gas heating; No central cooling
- Interior features: Crawl space with exterior entry; Electric range, refrigerator, washer and dryer included
- Laundry & utility: Washer and dryer
Neighborhood map
What this means for you Summary
Snapshot
- This is a 2-bed/1.0-bath single-family listed at $145k.
Deal economics
- At list price, monthly cash flow is $63 ($762/yr) — positive.
- The deal already cash-flows at list — no discount required.
- To meet the 1% rule (rent ≥ 1% of price), the offer needs to be $116k (19.9% below list).
- Recommended offer: $116k (19.9% below list) — sets the bar for 1% rule.
- Cap rate 6.8% vs local median 2.9% in Fayetteville — top-decile yield for the area; either an underpriced asset or a hidden risk that comps aren't pricing in. Stress-test before assuming the spread holds.
Location & tenants
- Location reads 63/100 on livability (#204 in TN) — a middle-class / working-renter tenant base. Strengths: cost of living A+, housing A+; Watch: crime F, amenities F, commute F.
- Fayetteville (town): math 18% / reading 24% proficiency, ranked #114 of 139 in TN (top 82%) — low school quality limits family demand, transient renter base, plan for 1-2y turnover.
- Zoned schools: Ralph Askins School (math 32% / reading 32%, grade F, #369 of 952 statewide, top 42%, 555 students, 0% FRL); Fayetteville High School (math 8% / reading 37%, grade F, #156 of 332 statewide, top 49%, 383 students, 0% FRL) — zoned schools average 0% FRL vs 58% district-wide (58 pts lower); this property's tenant base skews higher-income than the district average.
- Market conditions: 188 active listings in the ZIP; 173 units permitted in Lincoln County in 2024 (0 in 5+ unit buildings).
Forward outlook
- Local home prices are declining (-3.0%/yr); year-one equity from $1k of loan paydown is wiped out by about $4k of value loss. Plan a longer hold.
- Lincoln County population projected to shrink 3% by 2050 — rents likely to lag national; underwrite the cash flow, not the appreciation.
Negotiation context
- It's been on market 31 days — a 3% lower offer ($141k) is reasonable based on typical stale-listing flexibility.
- Current owner paid $48k; list at $145k implies a 202% gain — meaningful room to come down on a strong offer.
Risks & watch-outs
- Watch-outs: built in 1930 — expect roof / HVAC / electrical / plumbing capex.
- Climate carrying-cost: extreme-heat days projected 7→20/yr by 2055 (HVAC capex compounding) — expect insurance premiums to compound above CPI over the hold.
Questions for the listing agent
- It's been on market 31 days. Have you received any prior offers? Is the seller open to a 20% concession, seller financing, or rate buy-down credit?
- Built in 1930 — when were the roof, HVAC, electrical panel, plumbing, and water heater last replaced?
- Is there a deadline driving the sale (1031 exchange, divorce, estate, relocation)? That informs how much negotiation room exists.
- Schools are D-rated, which usually means shorter tenancies and higher turnover. Who's the typical renter profile here, and what's been the actual vacancy rate?
- Crime grade is F in this area — have there been break-ins, vandalism, or insurance claims at this property in the last 3 years? What carrier currently insures it and at what premium?
- The area grade is low — what's the realistic commute time and amenity access for the typical tenant pool here? Any planned neighborhood developments (good or bad) we should know about?
- What's the average days-on-market for RENTAL listings here right now (not sales)? A rising rental-DOM trend means longer vacancies and softer asking-rent achievability than the comps imply.
- What's the recent tenant-quality profile in this submarket — average credit score on applications, eviction rate, late-payment / NSF rate, and stable-employment percentage? A property-management company in the area should have these aggregated.
- How much new for-sale + rental construction is in the pipeline within 1–3 miles? Heavy new supply typically softens prices + rents 12–24 months out; constrained supply supports both.
Investment metrics
- 1% rule
- 0.80% ✗
- Cap rate
- 6.82%
- Cash-on-cash
- 1.88%
- DSCR
- 1.08
- GRM
- 10.4
CMA / ARV
No comps found within radius.
Projected returns pro-forma
-3.0% appreciation · 3.0% rent growth · sell at horizon
- IRR
- -13.4%
- Equity multiple
- 0.52×
- Total profit
- $-19,527
- Equity at exit
- $21,620
- IRR
- -4.5%
- Equity multiple
- 0.70×
- Total profit
- $-12,096
- Equity at exit
- $12,537
Cash invested: $40,600 (down + closing). Projections, not guarantees.
Landlord ↔ Tenant lean methodology
- Overall (STATE)
- 87 Strongly Landlord-Friendly
- State Tennessee
- 87 Strongly Landlord-Friendly · R+13
- County
- — inherits STATE
- City
- — inherits STATE
ZIP-level market 37334
- Home prices YoY
- -16.9%
- Active inventory
- 188
- Price-to-rent
- 10.4×
Monthly cashflow live
- Estimated rent
- $1,161 medium interval (Pro) →
- Mortgage (P&I)
- −$760
- Tax from tax record
- −$33 /mo · $393/yr
- Insurance
- −$60
- HOA
- −$0
- Vacancy / Maint / Mgmt
- −$244
- Net cashflow
- $63
Break-even live
UW: 25.0% down · 7.5% · 30yr · 1.5% tax · 5.0% vac · 8.0% maint · 8.0% mgmt
Financing live
Cash to close
- Down payment
- $36,250
- Closing costs
- $4,350
- Reserves months
- —
- Total cash needed
- —
Loan-product check · same deal, 3 products live
Conventional
25% down · 7.5% · 30yr
- Down + closing
- —
- Monthly P&I
- —
- Monthly cashflow
- —
- DSCR
- —
- Eligible?
- —
Personal DTI + credit; lowest rate.
DSCR
20% down · 8.5% · 30yr
- Down + closing
- —
- Monthly P&I
- —
- Monthly cashflow
- —
- DSCR
- —
- Eligible?
- —
No personal income docs; deal must DSCR.
Hard money
10% down · 12.0% · 12mo
- Down + closing
- —
- Monthly P&I
- —
- Monthly cashflow
- —
- DSCR
- —
- Eligible?
- —
Short-term bridge; refi at stabilization.
Listing history 16 events
-
2026-06-18days on market $145,000 Active 31 DOM
-
2026-06-17days on market $145,000 Active 30 DOM
-
2026-06-16days on market $145,000 Active 29 DOM
-
2026-06-15days on market $145,000 Active 28 DOM
-
2026-06-13days on market $145,000 Active 26 DOM
-
2026-06-12days on market $145,000 Active 25 DOM
-
2026-06-09days on market $145,000 Active 22 DOM
-
2026-06-08days on market $145,000 Active 21 DOM
-
2026-06-08days on market $145,000 Active 20 DOM
-
2026-06-07days on market $145,000 Active 19 DOM
-
2026-06-03days on market $145,000 Active 16 DOM
-
2026-06-02days on market $145,000 Active 15 DOM
-
2026-06-01days on market $145,000 Active 14 DOM
-
2026-05-31days on market $145,000 Active 13 DOM
-
2026-05-18$145,000 Active
-
2012-02-17soldstatus $48,000
ⓘ Source: listings_history table (triggers on properties + properties_extension) + one-shot
backfill from property_details.listing_events for pre-trigger history.
Tax reassessment forecast TN · Resets to sale price
- Current annual tax
- $393 · $33/mo
- Projected year-2 tax
- $1,030 · $86/mo
- Expected delta
- +$636/yr (+$53/mo · 162.0%)
ⓘ Screening estimate from a state-policy table — verify with the county assessor before closing.
Climate risk First Street
- Flood 1/10 Low FEMA zone X (unshaded) · 0% chance over 30 yrs
- Wildfire 3/10 Moderate
- Heat 6/10 Major 7 d/yr ≥105°F today · 20 d/yr by 30 yrs out
- Wind 4/10 Moderate 13% chance of damaging wind over 30 yrs
- Air quality 1/10 Low 0 unhealthy d/yr today · 0 by 30 yrs out
Nearby sold comps map
Loading sold comps map…
Walkable amenities ~0.75 mi
Loading nearby amenities…
Taxation est. · year 1
- Rental income
- $13,930
- − Mortgage interest
- −$8,122
- − Property taxes
- −$393
- − Insurance
- −$725
- − Repairs & maintenance
- −$1,114
- − Management
- −$1,114
- − Depreciation
- −$4,218
- Taxable loss
- −$1,757
- Est. tax savings @ 24.0%
- +$422
- After-tax cash flow
- $1,184/yr
For passive investors: Depreciation is non-cash, so a rental often shows a tax loss while cash-flowing — sheltering income. Rental losses are passive: they offset passive income freely, and up to $25,000/yr can offset ordinary (W-2) income if you actively participate and your MAGI is under $100k (phasing out to $0 by $150k); unused losses carry forward. On sale, claimed depreciation is recaptured at up to 25%, and gains may owe capital-gains tax (a 1031 exchange can defer both). Figures are a year-1 estimate at your 24.0% rate — not tax advice; consult a CPA.
Schools (NCES district)
- District
- Fayetteville
- NCES district ID
- 4701200
- Math proficiency
- 18% ▼ -15.00%
- Reading proficiency
- 24% ▼ -3.00%
- Median HH income
- $31,291
- Composite
- 16.93/100
- National rank
- #9138
- State rank
- #114 of 139 in TN
Livability — Fayetteville
- Score
- 63/100
- State rank
- #204
- US rank
- #16029
Category grades
Schools grade is shown separately in the Schools card above.
Census & demographics
- Census place
- Fayetteville, TN
- City population
- 24,168
- Population (ZIP)
- 24,168
Population outlook (Lincoln County) Hauer SSP2
- Today (2025)
- 34,400 people
- By 2030
- 34,550 · +0.4%
- By 2040
- 34,345 · -0.2%
- By 2050
- 33,310 · -3.2%
- By 2075
- 30,199 · -12.2%
- By 2100
- 24,960 · -27.4%
Race, ethnicity, and origin ACS 2023
- Neighborhood character
- Predominantly White (82%)
- Race & ethnicity
- White 82% Black 8% Two or more races 6% Hispanic / Latino 5%
- Common ancestry
- Serbian 2% Italian 2% Slovak 2%
- Foreign-born
- 3% · Canada
- Languages at home
- 97% English-only · Spanish 2%
Political lean MEDSL · Lincoln
- 2024 margin
- Solid R (+64.6) · D 17.2% · R 81.9%
- 2008→2024 swing
- -22.5pp toward R · 2008: -42.2pp · 2024: -64.6pp
- All cycles
- 2024: R+64.6 2020: R+60.0 2016: R+59.0 2012: R+49.1 2008: R+42.2
Not yet ingested
- Civics
- —
Market trends
- HPI YoY
- ▼ -58.76%
- Current HPI
- 288.9104
- Rent YoY
- —
- Metro
- —
- State GDP YoY
- ▲ 2.78%
- F500 in state
- 22
Industry mix (Fortune 500 HQ in TN)
| Industry | F500 HQs | Revenue |
|---|---|---|
| Healthcare | 3 | $91B |
|
||
| Retail | 3 | $72B |
|
||
| Transportation / Logistics | 1 | $88B |
|
||
| Paper / Packaging | 1 | $19B |
|
||
| Insurance | 1 | $13B |
|
||
| Energy | 1 | $12B |
|
||
Price history
+202.1% since first listed2 events — show timeline
- 2026-05-18 Listed $145,000 REALTRACS as Distributed by MLS Grid
- 2012-02-17 Sold (Public Records) $48,000 Public Records
Property tax history
+0.9%/yrLatest (2025): $393 · +0.0% YoY. Source: county tax records.
Cash-flow waterfall
monthlySold comps — $/sqft
last 12 mo · ≤1 miLoading sold comps…