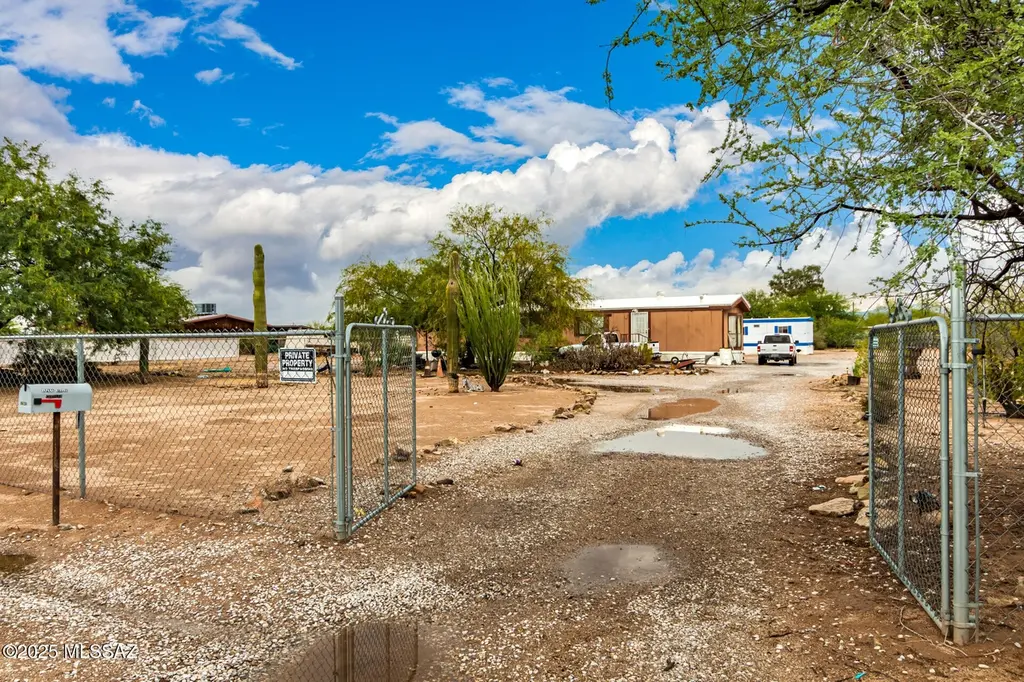
12662 N Springfield Rd · Avra Valley, AZ
Flood risk 1/10 · Minimal
- FEMA flood zone
- X (unshaded)
- Chance of flooding over 30 yrs
- 0.0%
- Est. flood insurance / yr
- $507 – $1,088
Fire risk 6/10 · Moderate
- Est. fire insurance / yr
- $610 – $1,132
Heat risk 8/10 · Major
- Hot days now (above 110°F)
- 7 days/yr
- Hot days in 30 yrs
- 18 days/yr
Wind risk 1/10 · Minimal
- Chance of severe wind over 30 yrs
- —
Air-quality risk 1/10 · Minimal
- Unhealthy air days now
- 0 days/yr
- Unhealthy air days in 30 yrs
- 0 days/yr
Risk factors via First Street. Map © Google.
Why this score? — see what drove the C+ grade
The composite is a weighted blend of 9 inputs, each scored 0–100. Each bar is that input's sub-score; the figure is the points it added to the 100-point composite (weight × sub-score).
- Cash flow +22.3/30.0
- ARV discount +15.0/15.0
- DSCR +7.1/10.0
- 1% rule +4.6/10.0
- Rent growth +3.4/5.0
- Schools +3.1/10.0
- Livability +2.7/5.0
- Condition / age +2.5/5.0
- Appreciation +0.0/10.0
$190,000
🖨 Deal sheet 📄 Offer letter ✓ Due diligence
Listing remarks MLS
Seize the chance to own this sprawling 1-acre horse property! Welcome to this expansive property, showcasing two mobile residences, each complete with two bedrooms, two bathrooms, a comfortable living space, a kitchen, and outdoor storage sheds. The potential here is limitless; seize this fantastic investment opportunity!
Key facts
- 1.04 acre lot
- Built 1994
- Listed 160 days
Neighborhood map
What this means for you Summary
Snapshot
- This is a 2-bed/2.0-bath manufactured listed at $190k.
Deal economics
- At list price, monthly cash flow is $313 ($4k/yr) — positive.
- The deal already cash-flows at list — no discount required.
- To meet the 1% rule (rent ≥ 1% of price), the offer needs to be $182k (4.4% below list).
- Recommended offer: $167k (12.0% below list) — sets the bar for market timing.
- Cap rate 8.3% vs local median 5.9% in Avra Valley — top-decile yield for the area; either an underpriced asset or a hidden risk that comps aren't pricing in. Stress-test before assuming the spread holds.
Location & tenants
- Location reads 54/100 on livability (#275 in AZ) — a working-class tenant base; expect higher turnover. Strengths: cost of living A+, housing A+; Watch: schools F, crime D-, amenities F.
- Marana Unified District (4404) (suburban): math 31% / reading 37% proficiency, ranked #83 of 249 in AZ (top 33%) — families likely to look elsewhere, expect single-tenant / working-renter base with shorter leases.
- Market conditions: Rents rising (+3.4%/yr); 412 active listings in the ZIP; solid renter incomes; 5,268 units permitted in Pima County in 2024 (996 in 5+ unit buildings).
Forward outlook
- Local home prices are declining (-3.0%/yr); year-one equity from $1k of loan paydown is wiped out by about $6k of value loss. Plan a longer hold.
- Pima County population projected at +8% by 2050 — modest demand growth; plan on rents tracking national, not racing it.
Negotiation context
- It's been on market 161 days — a 12% lower offer ($167k) is reasonable based on typical stale-listing flexibility.
- 2 sale attempts with the ask held roughly flat each time — persistent listings suggest the price (not the market) is what's stuck; bring a comps-based counter.
- Current owner paid $42k; list at $190k implies a 352% gain — meaningful room to come down on a strong offer.
Risks & watch-outs
- Climate carrying-cost: major wildfire risk; extreme-heat days projected 7→18/yr by 2055 (HVAC capex compounding) — expect insurance premiums to compound above CPI over the hold.
Questions for the listing agent
- It's been on market 161 days. Have you received any prior offers? Is the seller open to a 12% concession, seller financing, or rate buy-down credit?
- Why hasn't it sold? Are there any deal-killer items the seller is aware of (foundation, flood, title, zoning, code violations)?
- Is there a deadline driving the sale (1031 exchange, divorce, estate, relocation)? That informs how much negotiation room exists.
- Schools are F-rated, which usually means shorter tenancies and higher turnover. Who's the typical renter profile here, and what's been the actual vacancy rate?
- Crime grade is D in this area — have there been break-ins, vandalism, or insurance claims at this property in the last 3 years? What carrier currently insures it and at what premium?
- What's the average days-on-market for RENTAL listings here right now (not sales)? A rising rental-DOM trend means longer vacancies and softer asking-rent achievability than the comps imply.
- What's the recent tenant-quality profile in this submarket — average credit score on applications, eviction rate, late-payment / NSF rate, and stable-employment percentage? A property-management company in the area should have these aggregated.
- How much new for-sale + rental construction is in the pipeline within 1–3 miles? Heavy new supply typically softens prices + rents 12–24 months out; constrained supply supports both.
Investment metrics
- 1% rule
- 0.96% ✗
- Cap rate
- 8.27%
- Cash-on-cash
- 7.07%
- DSCR
- 1.31
- GRM
- 8.7
CMA / ARV
- ARV (median comp)
- $268,487
- List price
- $190,000
- Delta
- -29.23%
- Verdict
- UNDERPRICED
- Comps
- 16 within 1.0 mi
Show comp detail 6 sales within ~0.75 mi
| Address | Dist | Beds/Ba | Sqft | Sold | Price | $/sf | Match |
|---|---|---|---|---|---|---|---|
| 16805 W Weatherby Rd | 0.41mi | 3/2.0 (+1) | 2,016 (+3%) | 9mo | $280,000 | $139 | 64 |
| 12355 N Whitetail Rd | 0.71mi | 3/2.0 (+1) | 1,960 (0%) | 4mo | $259,900 | $133 | 59 |
| 16820 W Placita La Junta | 0.45mi | 3/2.0 (+1) | 1,909 (-3%) | 13mo | $283,000 | $148 | 58 |
| 12201 N Derringer Rd | 0.65mi | 3/2.0 (+1) | 1,736 (-11%) | 2mo | $270,000 | $156 | 44 |
| 12200 N Derringer Rd | 0.65mi | 3/2.0 (+1) | 2,200 (+12%) | 5mo | $127,000 | $58 | 40 |
| 12750 N Anway Rd | 0.32mi | 3/2.0 (+1) | 2,244 (+14%) | 20mo | $400,000 | $178 | 40 |
Match score weights: distance 35% · size 25% · config 20% · recency 20%. Top-matched comps best support the ARV.
Projected returns pro-forma
-3.0% appreciation · 3.43% rent growth · sell at horizon
- IRR
- -5.1%
- Equity multiple
- 0.81×
- Total profit
- $-10,126
- Equity at exit
- $28,330
- IRR
- 5.0%
- Equity multiple
- 1.37×
- Total profit
- $19,788
- Equity at exit
- $16,428
Cash invested: $53,200 (down + closing). Projections, not guarantees.
Landlord ↔ Tenant lean methodology
- Overall (STATE)
- 87 Strongly Landlord-Friendly
- State Arizona
- 87 Strongly Landlord-Friendly · R+3
- County
- — inherits STATE
- City
- — inherits STATE
ZIP-level market 85653
- Home prices YoY
- -21.8%
- Rents YoY
- 3.4%
- Active inventory
- 412
- Price-to-rent
- 8.7×
Monthly cashflow live
- Estimated rent
- $1,816 medium interval (Pro) →
- Mortgage (P&I)
- −$996
- Tax from tax record
- −$46 /mo · $550/yr
- Insurance
- −$79
- HOA
- −$0
- Vacancy / Maint / Mgmt
- −$381
- Net cashflow
- $313
Break-even live
UW: 25.0% down · 7.5% · 30yr · 1.5% tax · 5.0% vac · 8.0% maint · 8.0% mgmt
Financing live
Cash to close
- Down payment
- $47,500
- Closing costs
- $5,700
- Reserves months
- —
- Total cash needed
- —
Loan-product check · same deal, 3 products live
Conventional
25% down · 7.5% · 30yr
- Down + closing
- —
- Monthly P&I
- —
- Monthly cashflow
- —
- DSCR
- —
- Eligible?
- —
Personal DTI + credit; lowest rate.
DSCR
20% down · 8.5% · 30yr
- Down + closing
- —
- Monthly P&I
- —
- Monthly cashflow
- —
- DSCR
- —
- Eligible?
- —
No personal income docs; deal must DSCR.
Hard money
10% down · 12.0% · 12mo
- Down + closing
- —
- Monthly P&I
- —
- Monthly cashflow
- —
- DSCR
- —
- Eligible?
- —
Short-term bridge; refi at stabilization.
Listing history 23 events
-
2026-06-18days on market $190,000 Active 161 DOM
-
2026-06-17days on market $190,000 Active 160 DOM
-
2026-06-16days on market $190,000 Active 159 DOM
-
2026-06-15days on market $190,000 Active 158 DOM
-
2026-06-13days on market $190,000 Active 156 DOM
-
2026-06-13days on market $190,000 Active 155 DOM
-
2026-06-10days on market $190,000 Active 153 DOM
-
2026-06-09days on market $190,000 Active 152 DOM
-
2026-06-08days on market $190,000 Active 151 DOM
-
2026-06-07days on market $190,000 Active 150 DOM
-
2026-06-05days on market $190,000 Active 147 DOM
-
2026-06-03days on market $190,000 Active 146 DOM
-
2026-06-02days on market $190,000 Active 145 DOM
-
2026-06-01days on market $190,000 Active 144 DOM
-
2026-05-31days on market $190,000 Active 143 DOM
-
2026-01-08$190,000 Active 323-char remark
Show marketing remark (323 chars)
Seize the chance to own this sprawling 1-acre horse property! Welcome to this expansive property, showcasing two mobile residences, each complete with two bedrooms, two bathrooms, a comfortable living space, a kitchen, and outdoor storage sheds. The potential here is limitless; seize this fantastic investment opportunity!
-
2026-01-07price $190,000
-
2025-12-28historical
-
2025-07-25$200,000 Active
-
1997-06-12soldstatus $42,000
-
1997-06-12soldstatus $42,000
-
1994-12-30soldstatus $43,000
-
1986-04-01soldstatus $6,000
ⓘ Source: listings_history table (triggers on properties + properties_extension) + one-shot
backfill from property_details.listing_events for pre-trigger history.
Tax reassessment forecast AZ · Resets to sale price
- Current annual tax
- $550 · $46/mo
- Projected year-2 tax
- $1,254 · $104/mo
- Expected delta
- +$704/yr (+$59/mo · 128.2%)
ⓘ Screening estimate from a state-policy table — verify with the county assessor before closing.
Climate risk First Street
- Flood 1/10 Low FEMA zone X (unshaded) · 0% chance over 30 yrs
- Wildfire 6/10 Major
- Heat 8/10 Severe 7 d/yr ≥110°F today · 18 d/yr by 30 yrs out
- Wind 1/10 Low
- Air quality 1/10 Low 0 unhealthy d/yr today · 0 by 30 yrs out
Nearby sold comps map
Loading sold comps map…
Walkable amenities ~0.75 mi
Loading nearby amenities…
Taxation est. · year 1
- Rental income
- $21,794
- − Mortgage interest
- −$10,643
- − Property taxes
- −$550
- − Insurance
- −$950
- − Repairs & maintenance
- −$1,744
- − Management
- −$1,744
- − Depreciation
- −$5,527
- Taxable income
- $637
- Est. tax owed @ 24.0%
- −$153
- After-tax cash flow
- $3,608/yr
For passive investors: Depreciation is non-cash, so a rental often shows a tax loss while cash-flowing — sheltering income. Rental losses are passive: they offset passive income freely, and up to $25,000/yr can offset ordinary (W-2) income if you actively participate and your MAGI is under $100k (phasing out to $0 by $150k); unused losses carry forward. On sale, claimed depreciation is recaptured at up to 25%, and gains may owe capital-gains tax (a 1031 exchange can defer both). Figures are a year-1 estimate at your 24.0% rate — not tax advice; consult a CPA.
Schools (NCES district)
- District
- Marana Unified District (4404)
- NCES district ID
- 0404630
- Math proficiency
- 31% ▼ -11.00%
- Reading proficiency
- 37% ▼ -5.00%
- Median HH income
- $65,282
- Composite
- 30.96/100
- National rank
- #6103
- State rank
- #83 of 249 in AZ
Livability — Avra Valley
- Score
- 54/100
- State rank
- #275
- US rank
- #23869
Category grades
Schools grade is shown separately in the Schools card above.
Census & demographics
- Census place
- Avra Valley, AZ
- County
- Pima County · 1,012,107 people
- Metro
- Tucson, AZ
- Population (ZIP)
- 23,574
- Household income
- $86,154
- Rent vs Own
- Severe rent burden
- 181.0
Population outlook (Pima County) Hauer SSP2
- Today (2025)
- 1,066,056 people
- By 2030
- 1,086,684 · +1.9%
- By 2040
- 1,117,160 · +4.8%
- By 2050
- 1,149,778 · +7.9%
- By 2075
- 1,271,480 · +19.3%
- By 2100
- 1,321,160 · +23.9%
Race, ethnicity, and origin ACS 2023
- Neighborhood character
- Diverse neighborhood (Simpson 0.55)
- Race & ethnicity
- White 61% Hispanic / Latino 27% Two or more races 15% Black 3% Native American 2% Asian 1%
- Hispanic origin (detail)
- Mexican 22% Puerto Rican 2%
- Common ancestry
- Romanian 4% Lithuanian 2% Slovak 2%
- Foreign-born
- 6% · Canada
- Languages at home
- 88% English-only · Spanish 9% Other Asian/Pacific 1%
Political lean MEDSL · Pima
- 2024 margin
- D (+15.2) · D 57.0% · R 41.8% · Other 1.2%
- 2008→2024 swing
- +9.1pp toward D · 2008: 6.1pp · 2024: 15.2pp
- All cycles
- 2024: D+15.2 2020: D+18.7 2016: D+13.5 2012: D+5.8 2008: D+6.1
Not yet ingested
- Civics
- —
Market trends
- HPI YoY
- ▼ -69.29%
- Current HPI
- 249.3403
- Rent YoY
- ▲ 3.43%
- Metro
- Tucson, AZ
- State GDP YoY
- ▲ 4.54%
- F500 in state
- 20
Industry mix (Fortune 500 HQ in AZ)
| Industry | F500 HQs | Revenue |
|---|---|---|
| Technology | 2 | $13B |
|
||
| Mining / Metals | 1 | $23B |
|
||
| Environmental Services | 1 | $16B |
|
||
| Metals / Steel | 1 | $14B |
|
||
| Technology Distribution | 1 | $9B |
|
||
| Homebuilding | 1 | $8B |
|
||
Price history
+3066.7% since first listed8 events — show timeline
- 2026-01-08 Listed $190,000 MLSSAZ
- 2026-01-07 Price Changed $190,000 MLSSAZ
- 2025-12-28 Listing Removed — MLSSAZ
- 2025-07-25 Listed $200,000 MLSSAZ
- 1997-06-12 Sold (Public Records) $42,000 Public Records
- 1997-06-12 Sold (Public Records) $42,000 Public Records
- 1994-12-30 Sold (Public Records) $43,000 Public Records
- 1986-04-01 Sold (Public Records) $6,000 Public Records
Property tax history
+0.3%/yrLatest (2025): $550 · +5.0% YoY. Source: county tax records.
Cash-flow waterfall
monthlySold comps — $/sqft
last 12 mo · ≤1 miLoading sold comps…