 Duplex
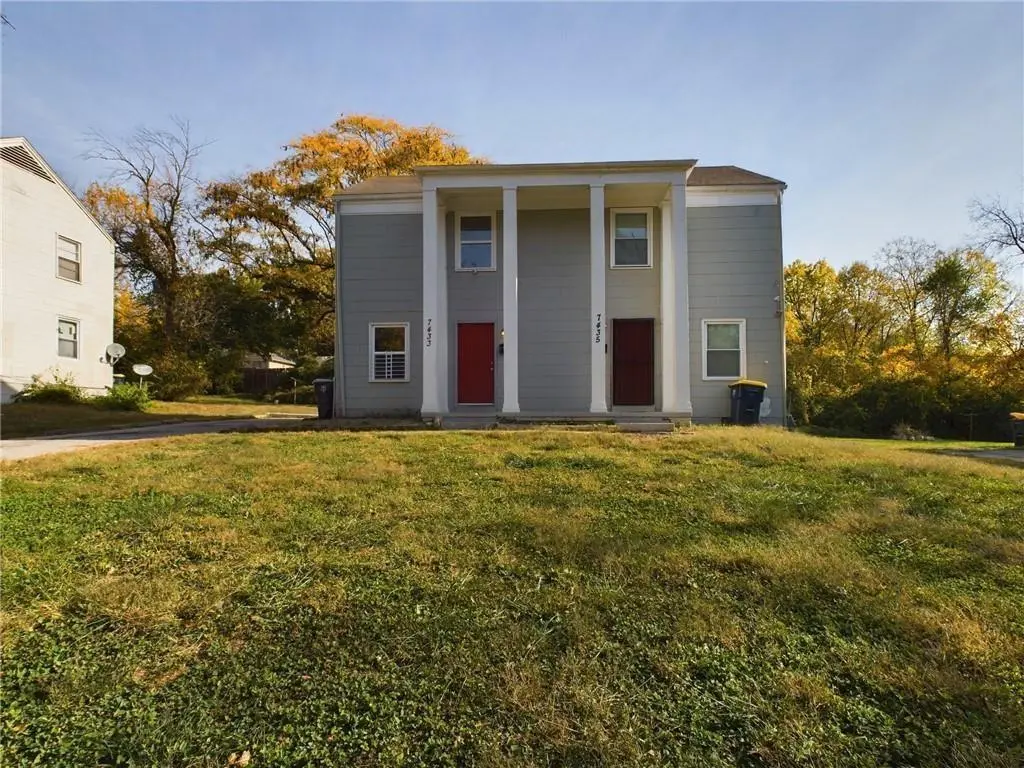
7433 Arleta Blvd · Kansas City, MO
Flood risk 3/10 · Minor
- FEMA flood zone
- X (unshaded)
- Chance of flooding over 30 yrs
- 0.2%
- Est. flood insurance / yr
- $507 – $1,088
Fire risk 1/10 · Minimal
- Est. fire insurance / yr
- $1,054 – $1,958
Heat risk 4/10 · Minor
- Hot days now (above 106°F)
- 7 days/yr
- Hot days in 30 yrs
- 17 days/yr
Wind risk 2/10 · Minimal
- Chance of severe wind over 30 yrs
- —
Air-quality risk 3/10 · Minor
- Unhealthy air days now
- 2 days/yr
- Unhealthy air days in 30 yrs
- 4 days/yr
Risk factors via First Street. Map © Google.
Why this score? — see what drove the B+ grade
The composite is a weighted blend of 9 inputs, each scored 0–100. Each bar is that input's sub-score; the figure is the points it added to the 100-point composite (weight × sub-score).
- Cash flow +30.0/30.0
- DSCR +10.0/10.0
- Appreciation +10.0/10.0
- 1% rule +8.6/10.0
- ARV discount +7.5/15.0
- Livability +3.9/5.0
- Rent growth +3.2/5.0
- Condition / age +2.5/5.0
- Schools +1.5/10.0
$180,000
🖨 Deal sheet 📄 Offer letter ✓ Due diligence
Multi-family units
County records classify this as Multi-Family (2-4 Unit). Listing-text estimate: 2 units. confirmed
Listing remarks
Well-maintained duplex offering immediate cash flow with long-term upside. Both units are occupied with rents of $925/month and $1,085/month, generating $2,010/month in gross rental income. Current owner pays gas and water, providing an opportunity for future expense optimization. This property has been well cared for and offers investors a stable addition to their portfolio with reliable tenants already in place. Whether you're looking to expand your Kansas City rental holdings or acquire your first multifamily property, this duplex provides strong income at an attractive price point. Conveniently located near major highways, shopping, employment centers, and public transportation. Priced
Key facts
- Immediate cash flow
- Reliable tenants
- Long term upside
Tags
Property features AI
Finance
- Other: Lot size approximately 9,840 square feet; Zoned residential
- Financial info: Operating expenses include water and sewer
Exterior
- Parking: Off-street parking
- Utilities: Public water; Public sewer; Other utilities
- Home design: Duplex residential income property; Two-story building
- Construction: Wood siding exterior; Composition roof
- Exterior features: Property is in a flood plain
Interior
- Bedrooms: Units include 2-bedroom layouts
- Heating & cooling: Forced air heating; Electric cooling
- Interior features: Two-unit residential income property (duplex); Over 95% current occupancy
Neighborhood map
What this means for you Summary
Snapshot
- This is a 2 × 2-bed/1.0-bath units multifamily listed at $180k.
Deal economics
- At list price, monthly cash flow is $850 ($10k/yr) — positive. Per door: $425/mo.
- The deal already cash-flows at list — no discount required.
- Meets the 1% rule at list price ($2k rent vs $180k).
- Cap rate 12.0% vs local median 3.9% in Kansas City — top-decile yield for the area; either an underpriced asset or a hidden risk that comps aren't pricing in. Stress-test before assuming the spread holds.
Location & tenants
- Location reads 78/100 on livability (#28 in MO, #2,671 nationally) — a middle-class / working-renter tenant base. Strengths: amenities A+, commute A+, cost of living A+; Watch: schools C-, crime F.
- Kansas City 33 (urban): math 12% / reading 24% proficiency, ranked #308 of 324 in MO (top 95%) — low school quality limits family demand, transient renter base, plan for 1-2y turnover; 75% free/reduced lunch — lower-income household profile, screen leases tightly.
- Market conditions: Rents rising (+3.0%/yr); 93 active listings in the ZIP; 15 comparable units currently listed for rent nearby; rentals at typical pace (median 22d on market — plan ~3-4 weeks tenant-placement turnaround); 4,002 units permitted in Jackson County in 2024 (2,271 in 5+ unit buildings).
- At $2,441/mo this rent would consume 64% of the median local household income ($46k/yr) (locally 679% of renters already pay >50% of income on rent) — very limited rent-growth headroom before tenants either downsize or default.
Forward outlook
- In year one you build about $19k of equity ($1k loan paydown + $18k appreciation (10.0% local appreciation)).
- Jackson County population projected at +4% by 2050 — modest demand growth; plan on rents tracking national, not racing it.
- At projected returns (10.0% appreciation + 3.0% rent growth), your $50k cash investment doubles in ~2 years — after that, you're playing with house money.
- By year 2, paydown + projected appreciation supports a ~$31k cash-out refi (75% LTV) — recoverable capital for the next deal without selling this one.
Negotiation context
- Only 6 days on market — expect competitive offers; lowballing is unlikely to land.
- 13 sale attempts since 24y ago with the ask held roughly flat each time — persistent listings suggest the price (not the market) is what's stuck; bring a comps-based counter.
Risks & watch-outs
- Watch-outs: built in 1954 — expect roof / HVAC / electrical / plumbing capex.
Questions for the listing agent
- Can we see the unit-by-unit rent roll, current vacancy, and any below-market leases? What's the average tenancy length?
- What capital expenditures (roof, boiler, parking lot, exteriors) have been made in the last 5 years, and what's planned in the next 2?
- Built in 1954 — when were the roof, HVAC, electrical panel, plumbing, and water heater last replaced?
- Is there a deadline driving the sale (1031 exchange, divorce, estate, relocation)? That informs how much negotiation room exists.
- Crime grade is F in this area — have there been break-ins, vandalism, or insurance claims at this property in the last 3 years? What carrier currently insures it and at what premium?
- What's the average days-on-market for RENTAL listings here right now (not sales)? A rising rental-DOM trend means longer vacancies and softer asking-rent achievability than the comps imply.
- What's the recent tenant-quality profile in this submarket — average credit score on applications, eviction rate, late-payment / NSF rate, and stable-employment percentage? A property-management company in the area should have these aggregated.
- How much new apartment / multifamily construction is in the pipeline within 1–3 miles? Heavy new supply (>2% of stock underway) typically softens rents 12–24 months out; light construction supports rent growth.
Investment metrics
- 1% rule
- 1.36% ✓
- Cap rate
- 11.96%
- Cash-on-cash
- 20.23%
- DSCR
- 1.90
- GRM
- 6.1
CMA / ARV
No comps found within radius.
Projected returns pro-forma
10.0% appreciation · 2.98% rent growth · sell at horizon
- IRR
- 39.4%
- Equity multiple
- 4.02×
- Total profit
- $152,039
- Equity at exit
- $162,158
- IRR
- 33.9%
- Equity multiple
- 9.03×
- Total profit
- $404,942
- Equity at exit
- $349,700
Cash invested: $50,400 (down + closing). Projections, not guarantees.
Landlord ↔ Tenant lean methodology
- Overall (STATE)
- 81 Strongly Landlord-Friendly
- State Missouri
- 81 Strongly Landlord-Friendly · R+10
- County
- — inherits STATE
- City
- — inherits STATE
ZIP-level market 64132
- Home prices YoY
- 23.6%
- Rents YoY
- 3.0%
- Active inventory
- 93
- Price-to-rent
- 12.3×
Monthly cashflow live
- Estimated rent
- $2,441 high interval (Pro) →
- Mortgage (P&I)
- −$944
- Tax from tax record
- −$60 /mo · $717/yr
- Insurance
- −$75
- HOA
- −$0
- Vacancy / Maint / Mgmt
- −$513
- Net cashflow
- $850
Break-even live
2-unit breakdown (identical units grouped — click to expand)
| Units | Beds | Baths | Est. rent |
|---|---|---|---|
| 2× units | 2 | 1 | $2,442 |
| #1 | 2 | 1 | $1,221 |
| #2 | 2 | 1 | $1,221 |
| Total (2 units) | $2,441 | ||
UW: 25.0% down · 7.5% · 30yr · 1.5% tax · 5.0% vac · 8.0% maint · 8.0% mgmt
Financing live
Cash to close
- Down payment
- $45,000
- Closing costs
- $5,400
- Reserves months
- —
- Total cash needed
- —
Loan-product check · same deal, 3 products live
Conventional
25% down · 7.5% · 30yr
- Down + closing
- —
- Monthly P&I
- —
- Monthly cashflow
- —
- DSCR
- —
- Eligible?
- —
Personal DTI + credit; lowest rate.
DSCR
20% down · 8.5% · 30yr
- Down + closing
- —
- Monthly P&I
- —
- Monthly cashflow
- —
- DSCR
- —
- Eligible?
- —
No personal income docs; deal must DSCR.
Hard money
10% down · 12.0% · 12mo
- Down + closing
- —
- Monthly P&I
- —
- Monthly cashflow
- —
- DSCR
- —
- Eligible?
- —
Short-term bridge; refi at stabilization.
Rent comps 15 comps
| Address | Beds | Baths | Sqft | Rent | $/sqft | DOM | Units | Dist |
|---|---|---|---|---|---|---|---|---|
| 1827 E 75th Ter Kansas City, MO | 3.0 | 1.5 | 1700 | $1,595 | $0.94 | 16d | 1 | 0.16mi |
| 7316 Paseo Blvd Kansas City, MO | 3.0 | 1.5 | 1882 | $1,523 | $0.81 | 43d | 1 | 0.21mi |
| 7240 Agnes Ave Kansas City, MO | 3.0 | 1.0 | 1140 | $1,350 | $1.18 | 2d | 1 | 0.63mi |
| 7133 Agnes Ave Kansas City, MO | 3.0 | 2.0 | 1100 | $1,645 | $1.50 | 23d | 1 | 0.72mi |
| 7022 S Benton Ave Kansas City, MO | 3.0 | 1.5 | 1100 | $1,095 | $1.00 | 14d | 1 | 0.73mi |
| 1850 E 68th Ter Kansas City, MO | 4.0 | 2.0 | 1400 | $1,600 | $1.14 | 16d | 1 | 0.76mi |
| 822 E 72nd St Kansas City, MO | 3.0 | 3.0 | 1800 | $2,400 | $1.33 | 21d | 1 | 0.79mi |
| 7426 Indiana Ave Kansas City, MO | 3.0 | 1.0 | 1100 | $1,400 | $1.27 | 43d | 1 | 0.85mi |
| 2237 E 67th St Kansas City, MO | 4.0 | 1.0 | 1300 | $1,500 | $1.15 | 16d | 1 | 0.94mi |
| 6812 College Ave Kansas City, MO | 4.0 | 2.0 | 1152 | $1,795 | $1.56 | 23d | 1 | 1.10mi |
| 6821 Bales Ave Kansas City, MO | 3.0 | 1.5 | 1430 | $1,595 | $1.12 | 20d | 1 | 1.20mi |
| 6720 Holmes Rd Kansas City, MO | 3.0 | 3.0 | 1552 | $2,695 | $1.74 | 43d | 1 | 1.27mi |
| 320 E 79th Ter Kansas City, MO | 3.0 | 1.0 | 1100 | $1,700 | $1.55 | 43d | 1 | 1.28mi |
| 6431 S Benton Ave Kansas City, MO | 3.0 | 1.0 | 1160 | $1,225 | $1.06 | 23d | 1 | 1.35mi |
| 224 E Winthrope Rd Kansas City, MO | 3.0 | 2.0 | 2000 | $2,350 | $1.18 | 1d | 1 | 1.47mi |
Listing history 6 events
-
2026-06-18days on market $180,000 Active 6 DOM
-
2026-06-17days on market $180,000 Active 5 DOM
-
2026-06-16days on market $180,000 Active 4 DOM
-
2026-06-15days on market $180,000 Active 3 DOM
-
2026-06-13remarks 699-char remark
-
2026-06-13$180,000 Active 1 DOM
ⓘ Source: listings_history table (triggers on properties + properties_extension) + one-shot
backfill from property_details.listing_events for pre-trigger history.
Tax reassessment forecast MO · Resets to sale price
- Current annual tax
- $717 · $60/mo
- Projected year-2 tax
- $1,746 · $146/mo
- Expected delta
- +$1,029/yr (+$86/mo · 143.7%)
ⓘ Screening estimate from a state-policy table — verify with the county assessor before closing.
Climate risk First Street
- Flood 3/10 Moderate FEMA zone X (unshaded) · 20% chance over 30 yrs
- Wildfire 1/10 Low
- Heat 4/10 Moderate 7 d/yr ≥106°F today · 17 d/yr by 30 yrs out
- Wind 2/10 Low
- Air quality 3/10 Moderate 2 unhealthy d/yr today · 4 by 30 yrs out
Nearby sold comps map
Loading sold comps map…
Walkable amenities ~0.75 mi
Loading nearby amenities…
Taxation est. · year 1
- Rental income
- $29,292
- − Mortgage interest
- −$10,083
- − Property taxes
- −$717
- − Insurance
- −$900
- − Repairs & maintenance
- −$2,343
- − Management
- −$2,343
- − Depreciation
- −$5,236
- Taxable income
- $7,670
- Est. tax owed @ 24.0%
- −$1,841
- After-tax cash flow
- $8,356/yr
For passive investors: Depreciation is non-cash, so a rental often shows a tax loss while cash-flowing — sheltering income. Rental losses are passive: they offset passive income freely, and up to $25,000/yr can offset ordinary (W-2) income if you actively participate and your MAGI is under $100k (phasing out to $0 by $150k); unused losses carry forward. On sale, claimed depreciation is recaptured at up to 25%, and gains may owe capital-gains tax (a 1031 exchange can defer both). Figures are a year-1 estimate at your 24.0% rate — not tax advice; consult a CPA.
Schools (NCES district)
- District
- Kansas City 33
- NCES district ID
- 2916400
- Math proficiency
- 12% ▼ -8.00%
- Reading proficiency
- 24% ▬ 0.00%
- Median HH income
- $35,227
- Composite
- 14.8/100
- National rank
- #9387
- State rank
- #308 of 324 in MO
Livability — Kansas City
- Score
- 78/100
- State rank
- #28
- US rank
- #2671
Category grades
Schools grade is shown separately in the Schools card above.
Census & demographics
- Census place
- Kansas City, MO
- County
- Jackson County · 687,798 people
- City population
- 439,467
- Metro
- Kansas City, MO-KS
- Population (ZIP)
- 12,084
- Household income
- $45,622
- Rent vs Own
- Severe rent burden
- 679.0
Population outlook (Jackson County) Hauer SSP2
- Today (2025)
- 719,589 people
- By 2030
- 731,456 · +1.6%
- By 2040
- 746,689 · +3.8%
- By 2050
- 749,289 · +4.1%
- By 2075
- 736,227 · +2.3%
- By 2100
- 668,210 · -7.1%
Race, ethnicity, and origin ACS 2023
- Neighborhood character
- Predominantly Black (66%)
- Race & ethnicity
- Black 66% White 16% Hispanic / Latino 11% Two or more races 10%
- Hispanic origin (detail)
- Mexican 9%
- Common ancestry
- Italian 2% Scotch-Irish 1% Romanian 1%
- Foreign-born
- 6% · Canada, Jamaica
- Languages at home
- 92% English-only · Spanish 7%
Political lean MEDSL · Jackson
- 2024 margin
- D (+19.3) · D 58.9% · R 39.5% · Other 1.6%
- 2008→2024 swing
- -6.1pp toward R · 2008: 25.4pp · 2024: 19.3pp
- All cycles
- 2024: D+19.3 2020: D+22.0 2016: D+16.6 2012: D+19.0 2008: D+25.4
Not yet ingested
- Civics
- —
Market trends
- HPI YoY
- ▲ 79.13%
- Current HPI
- 414.4305
- Rent YoY
- ▲ 2.98%
- Metro
- Kansas City, MO-KS
- State GDP YoY
- ▲ 1.84%
- F500 in state
- 20
Industry mix (Fortune 500 HQ in MO)
| Industry | F500 HQs | Revenue |
|---|---|---|
| Healthcare | 1 | $163B |
|
||
| Insurance | 1 | $21B |
|
||
| Industrial Technology | 1 | $17B |
|
||
| Retail | 1 | $16B |
|
||
| Industrial Distribution | 1 | $10B |
|
||
| Utilities | 1 | $9B |
|
||
Price history
+300.0% since first listed32 events — show timeline
- 2026-06-12 Listed $180,000 Heartland MLS as Distributed by MLS Grid
- 2026-06-03 Listed for Rent $900 RentEngineListings
- 2026-04-30 Listing Removed — Heartland MLS as Distributed by MLS Grid
- 2025-11-06 Listed $195,000 Heartland MLS as Distributed by MLS Grid
- 2024-11-18 Pending — Heartland MLS as Distributed by MLS Grid
- 2024-11-18 Listing Removed — Heartland MLS as Distributed by MLS Grid
- 2024-10-30 Listed $185,000 Heartland MLS as Distributed by MLS Grid
- 2023-03-28 Sold (Public Records) — Public Records
- 2023-03-23 Sold (MLS) — Heartland MLS as Distributed by MLS Grid
- 2023-02-27 Contingent — Heartland MLS as Distributed by MLS Grid
- 2023-02-06 Relisted — Heartland MLS as Distributed by MLS Grid
- 2023-02-01 Pending — Heartland MLS as Distributed by MLS Grid
- 2023-01-12 Listed $145,000 Heartland MLS as Distributed by MLS Grid
- 2022-04-22 Sold (Public Records) — Public Records
- 2022-04-21 Sold (MLS) — Heartland MLS as Distributed by MLS Grid
- 2022-04-08 Pending — Heartland MLS as Distributed by MLS Grid
- 2022-04-07 Relisted — Heartland MLS as Distributed by MLS Grid
- 2022-04-07 Pending — Heartland MLS as Distributed by MLS Grid
- 2022-04-06 Listed $125,000 Heartland MLS as Distributed by MLS Grid
- 2022-01-22 Pending — Heartland MLS as Distributed by MLS Grid
- 2022-01-21 Listing Removed — Heartland MLS as Distributed by MLS Grid
- 2022-01-16 Relisted — Heartland MLS as Distributed by MLS Grid
- 2022-01-10 Listing Removed — Heartland MLS as Distributed by MLS Grid
- 2022-01-03 Listed $140,000 Heartland MLS as Distributed by MLS Grid
- 2008-06-27 Sold (MLS) — Heartland MLS as Distributed by MLS Grid
- 2008-05-01 Listed $32,500 Heartland MLS as Distributed by MLS Grid
- 2007-10-31 Sold (Public Records) — Public Records
- 2007-10-26 Listed $59,900 Heartland MLS as Distributed by MLS Grid
- 2002-03-29 Sold (Public Records) — Public Records
- 2002-03-26 Sold (MLS) — Heartland MLS as Distributed by MLS Grid
- 2002-01-25 Listed $45,000 Heartland MLS as Distributed by MLS Grid
- 1990-02-22 Sold (Public Records) — Public Records
Property tax history
+4.2%/yrLatest (2025): $717 · -58.2% YoY. Source: county tax records.
Cash-flow waterfall
monthlySold comps — $/sqft
last 12 mo · ≤1 miLoading sold comps…