1277 Onondaga St NE · Fridley, MN
Flood risk 4/10 · Minor
- FEMA flood zone
- X (unshaded)
- Chance of flooding over 30 yrs
- 0.2%
- Est. flood insurance / yr
- $507 – $1,088
Fire risk 1/10 · Minimal
- Est. fire insurance / yr
- $888 – $1,650
Heat risk 2/10 · Minimal
- Hot days now (above 100°F)
- 7 days/yr
- Hot days in 30 yrs
- 14 days/yr
Wind risk 2/10 · Minimal
- Chance of severe wind over 30 yrs
- —
Air-quality risk 2/10 · Minimal
- Unhealthy air days now
- 1 days/yr
- Unhealthy air days in 30 yrs
- 1 days/yr
Risk factors via First Street. Map © Google.
Why this score? — see what drove the B grade
The composite is a weighted blend of 9 inputs, each scored 0–100. Each bar is that input's sub-score; the figure is the points it added to the 100-point composite (weight × sub-score).
- Cash flow +30.0/30.0
- DSCR +10.0/10.0
- 1% rule +9.1/10.0
- ARV discount +7.5/15.0
- Rent growth +4.0/5.0
- Schools +4.0/10.0
- Condition / age +4.0/5.0
- Livability +3.8/5.0
- Appreciation +0.0/10.0
$99,900
🖨 Deal sheet (PDF) 📄 Offer letter ✓ Due diligence
Key facts
- Built 2025
Property features AI
Exterior
- Parking: Asphalt parking
- Utilities: City water; City sewer; 200+ amp electrical service; Natural gas
- Home design: Residential manufactured home; One level; New construction
- Construction: Frame construction; Asphalt roof (age 8 years or less); Pillar/post/pier foundation; Built on a 14 x 56 foundation
- Exterior features: Metal and vinyl exterior
Interior
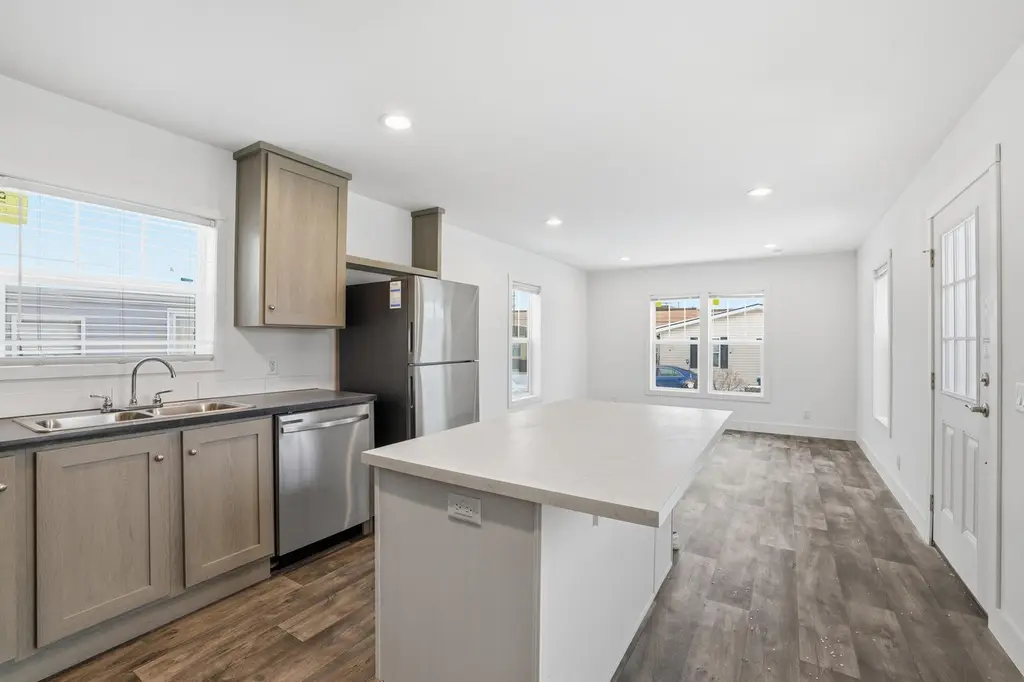
- Kitchen: Dishwasher; Microwave; Range; Refrigerator; Electric water heater
- Bedrooms: 2 bedrooms (both on the main level)
- Bathrooms: 1 full bathroom (main floor)
- Heating & cooling: Forced air heating; Central air conditioning
- Interior features: Eat-in kitchen; No basement; In-hall laundry
- Laundry & utility: Washer; Dryer
Neighborhood map
What this means for you Summary
Snapshot
- This is a 2-bed/1.0-bath manufactured listed at $100k. Condition is rated good.
Deal economics
- At list price, monthly cash flow is $527 ($6k/yr) — positive.
- The deal already cash-flows at list — no discount required.
- Meets the 1% rule at list price ($1k rent vs $100k).
- Cap rate 12.6% vs local median 3.2% in Fridley — top-decile yield for the area; either an underpriced asset or a hidden risk that comps aren't pricing in. Stress-test before assuming the spread holds.
Location & tenants
- Location reads 75/100 on livability (#185 in MN, #3,977 nationally) — a middle-class / working-renter tenant base. Strengths: commute A+, housing A+, employment B+; Watch: crime C-, amenities F, health & safety F.
- Spring Lake Park Public Schools (suburban): math 41% / reading 49% proficiency, ranked #162 of 301 in MN (top 54%) — families likely to look elsewhere, expect single-tenant / working-renter base with shorter leases.
- Zoned schools: Park Terrace Elementary (math 37% / reading 27%, grade F, #670 of 857 statewide, top 79%, 552 students, 76% FRL); Westwood Intermediate & Middle Sch (math 34% / reading 54%, grade D, #126 of 258 statewide, top 49%, 1,691 students, 49% FRL); Spring Lake Park Senior High (math 47% / reading 32%, grade F, #246 of 471 statewide, top 59%, 1,947 students, 46% FRL) — zoned schools average 57% FRL vs 30% district-wide (27 pts higher); higher-poverty schools than district average — tighter screening recommended.
- Market conditions: Rents rising fast (+5.8%/yr); 98 active listings in the ZIP; 14 comparable units currently listed for rent nearby; rentals leasing fast (median 12d on market — plan ~1-2 weeks tenant-placement turnaround); solid renter incomes; 1,083 units permitted in Anoka County in 2024 (134 in 5+ unit buildings).
Forward outlook
- Local home prices are declining (-3.0%/yr); year-one equity from $691 of loan paydown is wiped out by about $3k of value loss. Plan a longer hold.
- Anoka County population projected at +11% by 2050 — modest demand growth; plan on rents tracking national, not racing it.
- At projected returns (-3.0% appreciation + 5.8% rent growth), your $28k cash investment doubles in ~5 years — after that, you're playing with house money.
Negotiation context
- Only 1 days on market — expect competitive offers; lowballing is unlikely to land.
Questions for the listing agent
- Is there a deadline driving the sale (1031 exchange, divorce, estate, relocation)? That informs how much negotiation room exists.
- What's the average days-on-market for RENTAL listings here right now (not sales)? A rising rental-DOM trend means longer vacancies and softer asking-rent achievability than the comps imply.
- What's the recent tenant-quality profile in this submarket — average credit score on applications, eviction rate, late-payment / NSF rate, and stable-employment percentage? A property-management company in the area should have these aggregated.
- How much new for-sale + rental construction is in the pipeline within 1–3 miles? Heavy new supply typically softens prices + rents 12–24 months out; constrained supply supports both.
Investment metrics
- 1% rule
- 1.41% ✓
- Cap rate
- 12.63%
- Cash-on-cash
- 22.62%
- DSCR
- 2.01
- GRM
- 5.9
CMA / ARV
No comps found within radius.
Projected returns pro-forma
-3.0% appreciation · 5.82% rent growth · sell at horizon
- IRR
- 18.3%
- Equity multiple
- 1.77×
- Total profit
- $21,453
- Equity at exit
- $14,895
- IRR
- 28.5%
- Equity multiple
- 3.85×
- Total profit
- $79,597
- Equity at exit
- $8,638
Cash invested: $27,972 (down + closing). Projections, not guarantees.
Landlord ↔ Tenant lean methodology
- Overall (STATE)
- 46 Balanced
- State Minnesota
- 46 Balanced · D+2
- County
- — inherits STATE
- City
- — inherits STATE
ZIP-level market 55432
- Rents YoY
- 5.8%
- Active inventory
- 98
- Price-to-rent
- 5.9×
Monthly cashflow live
- Estimated rent
- $1,408 high interval (Pro) →
- Mortgage (P&I)
- −$524
- Tax from tax record
- −$19 /mo · $233/yr
- Insurance
- −$42
- HOA
- −$0
- Vacancy / Maint / Mgmt
- −$296
- Net cashflow
- $527
Break-even live
Sensitivity live
| Price | -10% $584 | -5% $555 | +0% $527 | +5% $499 | +10% $471 |
|---|---|---|---|---|---|
| Rent | -10% $416 | -5% $472 | +0% $527 | +5% $583 | +10% $638 |
| Rate | -1.0pp $578 | -0.5pp $553 | base $527 | +0.5pp $501 | +1.0pp $475 |
UW: 25.0% down · 7.5% · 30yr · 1.5% tax · 5.0% vac · 8.0% maint · 8.0% mgmt
Financing live
Cash to close
- Down payment
- $24,975
- Closing costs
- $2,997
- Reserves months
- —
- Total cash needed
- —
Loan-product check · same deal, 3 products live
Conventional
25% down · 7.5% · 30yr
- Down + closing
- —
- Monthly P&I
- —
- Monthly cashflow
- —
- DSCR
- —
- Eligible?
- —
Personal DTI + credit; lowest rate.
DSCR
20% down · 8.5% · 30yr
- Down + closing
- —
- Monthly P&I
- —
- Monthly cashflow
- —
- DSCR
- —
- Eligible?
- —
No personal income docs; deal must DSCR.
Hard money
10% down · 12.0% · 12mo
- Down + closing
- —
- Monthly P&I
- —
- Monthly cashflow
- —
- DSCR
- —
- Eligible?
- —
Short-term bridge; refi at stabilization.
Rent comps 14 comps
| Address | Beds | Baths | Sqft | Rent | $/sqft | DOM | Units | Dist |
|---|---|---|---|---|---|---|---|---|
| 1619 73rd Ave NE Unit 206 Minneapolis, MN | 2.0 | 1.0 | 1030 | $1,295 | $1.26 | 0d | 1 | 0.45mi |
| 1129 79th Ave NE Unit 1129-06 Minneapolis, MN | 3.0 | 1.0 | 1050 | $1,455 | $1.39 | 11d | 1 | 0.68mi |
| 1129 79th Ave NE Unit 1129-03 Minneapolis, MN | 3.0 | 1.0 | 1050 | $1,375 | $1.31 | 0d | 1 | 0.68mi |
| 1129 79th Ave NE Unit 1129-05 Minneapolis, MN | 3.0 | 1.0 | 1050 | $1,399 | $1.33 | 23d | 1 | 0.68mi |
| 1121 79th Ave NE Minneapolis, MN | 3.0 | 1.0 | 1050 | $1,425 | $1.36 | 12d | 6 | 0.69mi |
| 650 Osborne Rd NE Fridley, MN | 1.0–2.0 | 1.0 | 824 | $1,425 | $1.73 | 0d | 3 | 0.75mi |
| 8070 Central Ave NE Minneapolis, MN | 1.0–2.0 | 1.0 | 738 | $1,385 | $1.88 | 11d | 1 | 0.83mi |
| 1200 81st Ave NE Minneapolis, MN | 1.0–2.0 | 1.0 | 738 | $1,385 | $1.88 | 0d | 1 | 0.88mi |
| 8030 Central Ave NE Spring Lake Park, MN | 1.0–2.0 | 1.0 | 738 | $1,385 | $1.88 | 0d | 7 | 0.91mi |
| 8263 Fillmore St NE Unit 4-8256 Spring Lake Park, MN | 1.0 | 1.0 | 730 | $1,225 | $1.68 | 45d | 1 | 1.10mi |
| 8263 Fillmore St NE Unit 5-8244 Spring Lake Park, MN | 1.0 | 1.0 | 730 | $1,275 | $1.75 | 0d | 1 | 1.11mi |
| 2901 Mounds View Blvd Saint Paul, MN | 2.0 | 2.0 | 982 | $1,653 | $1.68 | 14d | 1 | 1.14mi |
| 2659 County Road H2 Mounds View, MN | 1.0–2.0 | 1.0 | 825 | $1,489 | $1.80 | 6d | 5 | 1.32mi |
| 2651 Mounds View Blvd Unit 2665308 Mounds View, MN | 2.0 | 1.0 | 861 | $1,350 | $1.57 | 45d | 1 | 1.33mi |
Listing history 2 events
-
2026-05-26status Pending
-
2026-05-26$99,900 Active
ⓘ Source: listings_history table (triggers on properties + properties_extension) + one-shot
backfill from property_details.listing_events for pre-trigger history.
Tax reassessment forecast MN · Partial reset (capped growth)
- Current annual tax
- $233 · $19/mo
- Projected year-2 tax
- $676 · $56/mo
- Expected delta
- +$443/yr (+$37/mo · 190.2%)
ⓘ Screening estimate from a state-policy table — verify with the county assessor before closing.
Climate risk First Street
- Flood 4/10 Moderate FEMA zone X (unshaded) · 20% chance over 30 yrs
- Wildfire 1/10 Low
- Heat 2/10 Low 7 d/yr ≥100°F today · 14 d/yr by 30 yrs out
- Wind 2/10 Low
- Air quality 2/10 Low 1 unhealthy d/yr today · 1 by 30 yrs out
Nearby sold comps map
Loading sold comps map…
Walkable amenities ~0.75 mi
Loading nearby amenities…
Taxation est. · year 1
- Rental income
- $16,893
- − Mortgage interest
- −$5,596
- − Property taxes
- −$233
- − Insurance
- −$500
- − Repairs & maintenance
- −$1,351
- − Management
- −$1,351
- − Depreciation
- −$2,906
- Taxable income
- $4,956
- Est. tax owed @ 24.0%
- −$1,189
- After-tax cash flow
- $5,137/yr
For passive investors: Depreciation is non-cash, so a rental often shows a tax loss while cash-flowing — sheltering income. Rental losses are passive: they offset passive income freely, and up to $25,000/yr can offset ordinary (W-2) income if you actively participate and your MAGI is under $100k (phasing out to $0 by $150k); unused losses carry forward. On sale, claimed depreciation is recaptured at up to 25%, and gains may owe capital-gains tax (a 1031 exchange can defer both). Figures are a year-1 estimate at your 24.0% rate — not tax advice; consult a CPA.
Condition & rehab AI · 1 photo
This manufactured home is in good condition with a cosmetic rehab level, ready for minor updates to enhance its resale and rental value.
Value-add opportunities
- Both Painting the exterior and interior — Fresh paint enhances curb appeal and interior aesthetics
- Both Landscaping improvements — Enhances curb appeal and adds value
- Resale Upgrading the kitchen appliances — Modern appliances improve the home's appeal to potential buyers
- Rental Adding a small patio or deck — Improves outdoor living space for tenants
Renovation cost estimate screening
Value-add ROI direction
- Both Painting the exterior and interior — Fresh paint enhances curb appeal and interior aesthetics ↑
- Both Landscaping improvements — Enhances curb appeal and adds value ↑
- Resale Upgrading the kitchen appliances — Modern appliances improve the home's appeal to potential buyers ↑
- Rental Adding a small patio or deck — Improves outdoor living space for tenants ↑
ⓘ Cost ranges are severity-bucket heuristics (US national rule-of-thumb). Get contractor quotes + a written scope before underwriting a rehab budget.
Schools (NCES district)
- District
- Spring Lake Park Public Schools
- NCES district ID
- 2733330
- Math proficiency
- 41% ▼ -6.00%
- Reading proficiency
- 49% ▼ -8.00%
- Median HH income
- $65,602
- Composite
- 40.11/100
- National rank
- #3802
- State rank
- #162 of 301 in MN
Livability — Fridley
- Score
- 75/100
- State rank
- #185
- US rank
- #3977
Category grades
Schools grade is shown separately in the Schools card above.
Census & demographics
- Census place
- Fridley, MN
- County
- Anoka County · 277,116 people
- City population
- 33,672
- Metro
- Minneapolis-St. Paul-Bloomington, MN-WI
- Population (ZIP)
- 33,672
- Household income
- $79,520
- Rent vs Own
- Severe rent burden
- 954.0
Population outlook (Anoka County) Hauer SSP2
- Today (2025)
- 375,223 people
- By 2030
- 387,850 · +3.4%
- By 2040
- 407,239 · +8.5%
- By 2050
- 417,541 · +11.3%
- By 2075
- 448,447 · +19.5%
- By 2100
- 464,954 · +23.9%
Race, ethnicity, and origin ACS 2023
- Neighborhood character
- Diverse neighborhood (Simpson 0.61)
- Race & ethnicity
- White 58% Black 18% Hispanic / Latino 13% Two or more races 9% Asian 5%
- Hispanic origin (detail)
- Mexican 6%
- Common ancestry
- Portuguese 9% Italian 4% Romanian 4%
- Foreign-born
- 18% · Canada, Vietnam, Jamaica
- Languages at home
- 71% English-only · Spanish 12% Other Asian/Pacific 3% Arabic 3%
Political lean MEDSL · Anoka
- 2024 margin
- Toss-up / Even · D 46.6% · R 51.0% · Other 2.4%
- 2008→2024 swing
- -2.0pp toward R · 2008: -2.4pp · 2024: -4.4pp
- All cycles
- 2024: R+4.4 2020: R+1.9 2016: R+9.7 2012: R+2.6 2008: R+2.4
Not yet ingested
- Civics
- —
Market trends
- HPI YoY
- ▼ -241.23%
- Current HPI
- 257.6713
- Rent YoY
- ▲ 5.82%
- Metro
- Minneapolis-St. Paul-Bloomington, MN-WI
- State GDP YoY
- ▲ 2.41%
- F500 in state
- 34
Industry mix (Fortune 500 HQ in MN)
| Industry | F500 HQs | Revenue |
|---|---|---|
| Healthcare | 2 | $407B |
|
||
| Retail | 2 | $150B |
|
||
| Consumer Goods | 2 | $32B |
|
||
| Industrial Machinery | 2 | $6B |
|
||
| Agriculture | 1 | $40B |
|
||
| Healthcare / Medical Devices | 1 | $32B |
|
||
Price history
2 events — show timeline
- 2026-05-26 Pending — NORTHSTARMLS as Distributed by MLS Grid
- 2026-05-26 Listed $99,900 NORTHSTARMLS as Distributed by MLS Grid
Cash-flow waterfall
monthlySold comps — $/sqft
last 12 mo · ≤1 miLoading sold comps…