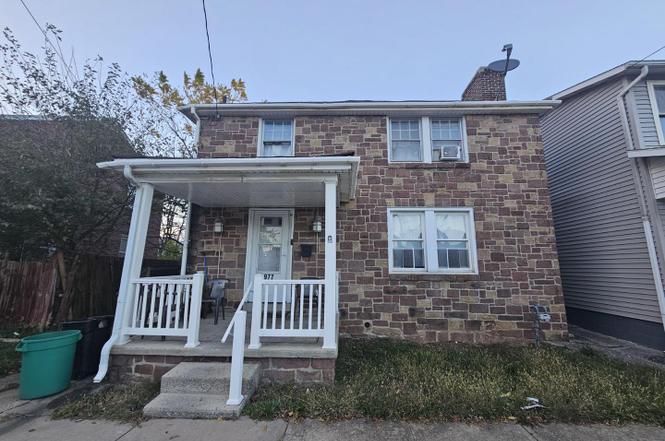
977 Edison St · York, PA
Flood risk 6/10 · Moderate
- FEMA flood zone
- X (unshaded)
- Chance of flooding over 30 yrs
- 0.7%
- Est. flood insurance / yr
- $473 – $860
Fire risk 1/10 · Minimal
- Est. fire insurance / yr
- $511 – $949
Heat risk 5/10 · Moderate
- Hot days now (above 102°F)
- 7 days/yr
- Hot days in 30 yrs
- 15 days/yr
Wind risk 4/10 · Minor
- Chance of severe wind over 30 yrs
- 11.0%
Air-quality risk 3/10 · Minor
- Unhealthy air days now
- 3 days/yr
- Unhealthy air days in 30 yrs
- 5 days/yr
Risk factors via First Street. Map © Google.
Why this score? — see what drove the D+ grade
The composite is a weighted blend of 9 inputs, each scored 0–100. Each bar is that input's sub-score; the figure is the points it added to the 100-point composite (weight × sub-score).
- ARV discount +15.0/15.0
- Cash flow +14.7/30.0
- 1% rule +4.6/10.0
- DSCR +4.5/10.0
- Livability +3.8/5.0
- Rent growth +3.6/5.0
- Condition / age +2.5/5.0
- Schools +0.8/10.0
- Appreciation +0.0/10.0
$153,000
🖨 Deal sheet (PDF) 📄 Offer letter ✓ Due diligence
Listing remarks MLS
CALL L. A. FOR ADDENDUMS. PLEASE NOTE THAT BUYER TO PAY BOTH TRANSFER TAXES. NICE STONE 2 STORY LOCATED ON A QUIET STREET W/ A DETACHED 2 CAR GARAGE. LOADS OF POSSIBILITIES CAN BE FOUND W/ THIS HOME. NICE SIZE RMS THROUGHOUT. PARTIAL RR IN BASEMENT, FP AND FENCED REAR YARD. PRICED FOR A QUICK SALE. SOLD IN "AS IS" CONDITION. |
Key facts
- 3,759 sq ft lot
- Built 1941
- Listed 80 days
Neighborhood map
What this means for you Summary
Snapshot
- This is a 3-bed/2.0-bath single-family listed at $153k.
Deal economics
- At list price, monthly cash flow is $39 ($469/yr) — positive.
- The deal already cash-flows at list — no discount required.
- To meet the 1% rule (rent ≥ 1% of price), the offer needs to be $146k (4.4% below list).
- Recommended offer: $144k (6.0% below list) — sets the bar for market timing.
Location & tenants
- Location reads 75/100 on livability (#427 in PA, #3,987 nationally) — a middle-class / working-renter tenant base. Strengths: cost of living A+, health & safety A+, housing A; Watch: amenities D+, crime F, employment F.
- York City SD (urban): math 4% / reading 16% proficiency, ranked #534 of 539 in PA (top 99%) — low school quality limits family demand, transient renter base, plan for 1-2y turnover; 72% free/reduced lunch — lower-income household profile, screen leases tightly.
- Zoned schools: Hannah Penn (math 0% / reading 9%, grade F, #1,516 of 1,518 statewide, top 100%, 679 students, 100% FRL); Edgar Fahs Smith Steam Academy (math 7% / reading 35%, grade F, #432 of 512 statewide, top 85%, 240 students, 100% FRL); William Penn Shs (math 22% / reading 8%, grade F, #407 of 437 statewide, top 94%, 1,534 students, 100% FRL) — zoned schools average 100% FRL vs 72% district-wide (28 pts higher); higher-poverty schools than district average — tighter screening recommended.
- Market conditions: Rents rising fast (+4.4%/yr); 223 active listings in the ZIP; 29 comparable units currently listed for rent nearby; rentals at typical pace (median 23d on market — plan ~3-4 weeks tenant-placement turnaround); solid renter incomes; 1,328 units permitted in York County in 2024 (338 in 5+ unit buildings).
Forward outlook
- Local home prices are declining (-3.0%/yr); year-one equity from $1k of loan paydown is wiped out by about $5k of value loss. Plan a longer hold.
Negotiation context
- It's been on market 80 days — a 6% lower offer ($144k) is reasonable based on typical stale-listing flexibility.
- 2 sale attempts since 27y ago; this cycle's ask has dropped $17k (10%) from the opening price — seller is motivated, your offer sets the floor, not the list.
- Current owner paid $35k; list at $153k implies a 337% gain — meaningful room to come down on a strong offer.
Risks & watch-outs
- Watch-outs: built in 1941 — expect roof / HVAC / electrical / plumbing capex.
- Climate carrying-cost: major flood risk; extreme-heat days projected 7→15/yr by 2055 (HVAC capex compounding) — expect insurance premiums to compound above CPI over the hold.
Questions for the listing agent
- It's been on market 80 days. Have you received any prior offers? Is the seller open to a 6% concession, seller financing, or rate buy-down credit?
- Built in 1941 — when were the roof, HVAC, electrical panel, plumbing, and water heater last replaced?
- Why hasn't it sold? Are there any deal-killer items the seller is aware of (foundation, flood, title, zoning, code violations)?
- Is there a deadline driving the sale (1031 exchange, divorce, estate, relocation)? That informs how much negotiation room exists.
- Crime grade is F in this area — have there been break-ins, vandalism, or insurance claims at this property in the last 3 years? What carrier currently insures it and at what premium?
- The area grade is low — what's the realistic commute time and amenity access for the typical tenant pool here? Any planned neighborhood developments (good or bad) we should know about?
- What's the average days-on-market for RENTAL listings here right now (not sales)? A rising rental-DOM trend means longer vacancies and softer asking-rent achievability than the comps imply.
- What's the recent tenant-quality profile in this submarket — average credit score on applications, eviction rate, late-payment / NSF rate, and stable-employment percentage? A property-management company in the area should have these aggregated.
- How much new for-sale + rental construction is in the pipeline within 1–3 miles? Heavy new supply typically softens prices + rents 12–24 months out; constrained supply supports both.
Investment metrics
- 1% rule
- 0.96% ✗
- Cap rate
- 6.60%
- Cash-on-cash
- 1.09%
- DSCR
- 1.05
- GRM
- 8.7
CMA / ARV
- ARV (on-the-fly)
- $214,214
- Comps found
- 12
Show comp detail 12 sales within ~0.75 mi
| Address | Dist | Beds/Ba | Sqft | Sold | Price | $/sf | Match |
|---|---|---|---|---|---|---|---|
| 1043 E Poplar St | 0.15mi | 3/1.5 | 1,500 (+0%) | 12mo | $220,000 | $147 | 81 |
| 871 E Market St | 0.21mi | 3/2.0 | 1,612 (+8%) | 9mo | $214,000 | $133 | 70 |
| 355 Simpson St | 0.20mi | 3/2.0 | 1,400 (-6%) | 12mo | $175,000 | $125 | 70 |
| 1119 E Poplar St | 0.21mi | 2/1.0 (-1) | 1,389 (-7%) | 1mo | $205,000 | $148 | 68 |
| 931 E Princess St | 0.10mi | 3/1.0 | 1,280 (-15%) | 4mo | $145,000 | $113 | 64 |
| 108 N Hartman St | 0.43mi | 4/1.5 (+1) | 1,568 (+5%) | 2mo | $225,000 | $143 | 63 |
| 880 E Boundary Ave | 0.61mi | 3/2.0 | 1,568 (+5%) | 1mo | $220,000 | $140 | 63 |
| 47 N Franklin St | 0.36mi | 3/1.0 | 1,420 (-5%) | 10mo | $150,000 | $106 | 62 |
| 1053 Hay St | 0.50mi | 3/1.0 | 1,541 (+3%) | 11mo | $186,100 | $121 | 59 |
| 1552 Wayne Ave | 0.66mi | 4/1.5 (+1) | 1,522 (+2%) | 6mo | $289,975 | $191 | 55 |
| 417 Hill St | 0.53mi | 3/1.0 | 1,296 (-14%) | 8mo | $210,000 | $162 | 42 |
| 1585 5th Ave | 0.59mi | 3/1.0 | 1,281 (-14%) | 12mo | $263,500 | $206 | 34 |
Match score weights: distance 35% · size 25% · config 20% · recency 20%. Top-matched comps best support the ARV.
Projected returns pro-forma
-3.0% appreciation · 4.43% rent growth · sell at horizon
- IRR
- -12.8%
- Equity multiple
- 0.53×
- Total profit
- $-20,111
- Equity at exit
- $22,813
- IRR
- -1.6%
- Equity multiple
- 0.88×
- Total profit
- $-5,055
- Equity at exit
- $13,229
Cash invested: $42,840 (down + closing). Projections, not guarantees.
Landlord ↔ Tenant lean methodology
- Overall (STATE)
- 62 Landlord-Friendly
- State Pennsylvania
- 62 Landlord-Friendly · EVEN
- County
- — inherits STATE
- City
- — inherits STATE
ZIP-level market 17403
- Home prices YoY
- -26.9%
- Rents YoY
- 4.4%
- Active inventory
- 223
- Price-to-rent
- 8.7×
Monthly cashflow live
- Estimated rent
- $1,462 high interval (Pro) →
- Mortgage (P&I)
- −$802
- Tax from tax record
- −$250 /mo · $3,002/yr
- Insurance
- −$64
- HOA
- −$0
- Vacancy / Maint / Mgmt
- −$307
- Net cashflow
- $39
Break-even live
Sensitivity live
| Price | -10% $126 | -5% $82 | +0% $39 | +5% $-4 | +10% $-48 |
|---|---|---|---|---|---|
| Rent | -10% $-76 | -5% $-19 | +0% $39 | +5% $97 | +10% $155 |
| Rate | -1.0pp $116 | -0.5pp $78 | base $39 | +0.5pp $-1 | +1.0pp $-41 |
UW: 25.0% down · 7.5% · 30yr · 1.5% tax · 5.0% vac · 8.0% maint · 8.0% mgmt
Financing live
Cash to close
- Down payment
- $38,250
- Closing costs
- $4,590
- Reserves months
- —
- Total cash needed
- —
Loan-product check · same deal, 3 products live
Conventional
25% down · 7.5% · 30yr
- Down + closing
- —
- Monthly P&I
- —
- Monthly cashflow
- —
- DSCR
- —
- Eligible?
- —
Personal DTI + credit; lowest rate.
DSCR
20% down · 8.5% · 30yr
- Down + closing
- —
- Monthly P&I
- —
- Monthly cashflow
- —
- DSCR
- —
- Eligible?
- —
No personal income docs; deal must DSCR.
Hard money
10% down · 12.0% · 12mo
- Down + closing
- —
- Monthly P&I
- —
- Monthly cashflow
- —
- DSCR
- —
- Eligible?
- —
Short-term bridge; refi at stabilization.
Rent comps 29 comps
| Address | Beds | Baths | Sqft | Rent | $/sqft | DOM | Units | Dist |
|---|---|---|---|---|---|---|---|---|
| 1027 E Market St Unit 2 York, PA | 2.0 | 1.0 | 1145 | $1,095 | $0.96 | 15d | 1 | 0.23mi |
| 40 N Tremont St #2 York, PA | 3.0 | 1.0 | 900 | $1,500 | $1.67 | 45d | 1 | 0.27mi |
| 30 N Franklin St York, PA | 3.0 | 1.0 | 1400 | $1,395 | $1.00 | 45d | 1 | 0.37mi |
| 720 Chestnut St Apt 2 York, PA | 4.0 | 1.0 | 1400 | $1,300 | $0.93 | 15d | 1 | 0.48mi |
| 1505 3rd Ave York, PA | 3.0 | 1.5 | 1408 | $1,800 | $1.28 | 15d | 1 | 0.50mi |
| 631 Wallace St Unit 631 York, PA | 4.0 | 1.0 | 1545 | $1,325 | $0.86 | 15d | 1 | 0.54mi |
| 549 Lancaster Ave York, PA | 3.0 | 1.0 | 1458 | $1,875 | $1.29 | 45d | 1 | 0.55mi |
| 1538 1st Ave Unit 2 York, PA | 3.0 | 2.0 | 1500 | $1,900 | $1.27 | 15d | 1 | 0.58mi |
| 446 Wallace St York, PA | 3.0 | 1.0 | 1092 | $1,295 | $1.19 | 22d | 1 | 0.67mi |
| 715 Vander Ave York, PA | 3.0 | 1.0 | 1180 | $1,295 | $1.10 | 15d | 1 | 0.68mi |
| 339 E Market St Unit 1 York, PA | 4.0 | 1.5 | 1600 | $1,650 | $1.03 | 22d | 1 | 0.74mi |
| 516 E Boundary Ave York, PA | 2.0 | 1.0 | 1128 | $1,200 | $1.06 | 15d | 1 | 0.77mi |
| 245 Franklin Way York, PA | 2.0 | 2.0 | 1240 | $1,150 | $0.93 | 15d | 1 | 0.89mi |
| 231 Franklin Way York, PA | 3.0 | 1.0 | 920 | $1,195 | $1.30 | 15d | 1 | 0.91mi |
| 208 Liberty Ct York, PA | 3.0 | 1.0 | 1096 | $1,195 | $1.09 | 45d | 1 | 0.93mi |
| 626 S Queen St York, PA | 3.0 | 1.0 | 1526 | $1,225 | $0.80 | 22d | 1 | 1.05mi |
| 443 S Duke St York, PA | 3.0 | 1.0 | 1028 | $1,225 | $1.19 | 45d | 1 | 1.09mi |
| 444 S Duke St York, PA | 3.0 | 1.0 | 1200 | $1,200 | $1.00 | 45d | 1 | 1.10mi |
| 514 S Duke St York, PA | 3.0 | 1.0 | 1289 | $1,625 | $1.26 | 22d | 1 | 1.12mi |
| 113 Arch St York, PA | 4.0 | 1.0 | 1188 | $1,200 | $1.01 | 15d | 1 | 1.15mi |
| 28 N George St Unit H York, PA | 2.0 | 2.0 | 1400 | $1,550 | $1.11 | 45d | 1 | 1.16mi |
| 251 N George St York, PA | 2.0 | 2.0 | 1100 | $1,595 | $1.45 | 15d | 1 | 1.19mi |
| 132 S Beaver St Apt 4 York, PA | 2.0 | 2.0 | 1000 | $1,250 | $1.25 | 45d | 1 | 1.27mi |
| 175 W Gay Ave York, PA | 1.0–2.0 | 1.0 | 1219 | $1,650 | $1.35 | 15d | 2 | 1.35mi |
| 334 N Beaver St York, PA | 3.0 | 1.0 | 1140 | $1,050 | $0.92 | 15d | 1 | 1.36mi |
| 133 Stevens Ave York, PA | 3.0 | 1.0 | 1200 | $1,300 | $1.08 | 45d | 1 | 1.39mi |
| 119 W Jackson St York, PA | 4.0 | 1.0 | 1800 | $1,395 | $0.78 | 45d | 1 | 1.44mi |
| 104 Camelot Arms York, PA | 1.0–2.0 | 1.0–2.0 | 1073 | $1,973 | $1.84 | 15d | 15 | 1.48mi |
| 42 Laurel St York, PA | 3.0 | 1.0 | 1136 | $1,375 | $1.21 | 22d | 1 | 1.50mi |
Listing history 10 events
-
2026-03-23status Pending
-
2026-02-20price $153,000
-
2026-01-19price $159,000
-
2026-01-08price $164,900
-
2026-01-02$170,000 Active
-
1999-11-30soldstatus $35,000 338-char remark
Show marketing remark (338 chars)
CALL L. A. FOR ADDENDUMS. PLEASE NOTE THAT BUYER TO PAY BOTH TRANSFER TAXES. NICE STONE 2 STORY LOCATED ON A QUIET STREET W/ A DETACHED 2 CAR GARAGE. LOADS OF POSSIBILITIES CAN BE FOUND W/ THIS HOME. NICE SIZE RMS THROUGHOUT. PARTIAL RR IN BASEMENT, FP AND FENCED REAR YARD. PRICED FOR A QUICK SALE. SOLD IN "AS IS" CONDITION. |
-
1999-10-19historical 338-char remark
Show marketing remark (338 chars)
CALL L. A. FOR ADDENDUMS. PLEASE NOTE THAT BUYER TO PAY BOTH TRANSFER TAXES. NICE STONE 2 STORY LOCATED ON A QUIET STREET W/ A DETACHED 2 CAR GARAGE. LOADS OF POSSIBILITIES CAN BE FOUND W/ THIS HOME. NICE SIZE RMS THROUGHOUT. PARTIAL RR IN BASEMENT, FP AND FENCED REAR YARD. PRICED FOR A QUICK SALE. SOLD IN "AS IS" CONDITION. |
-
1999-06-10$42,500 338-char remark
Show marketing remark (338 chars)
CALL L. A. FOR ADDENDUMS. PLEASE NOTE THAT BUYER TO PAY BOTH TRANSFER TAXES. NICE STONE 2 STORY LOCATED ON A QUIET STREET W/ A DETACHED 2 CAR GARAGE. LOADS OF POSSIBILITIES CAN BE FOUND W/ THIS HOME. NICE SIZE RMS THROUGHOUT. PARTIAL RR IN BASEMENT, FP AND FENCED REAR YARD. PRICED FOR A QUICK SALE. SOLD IN "AS IS" CONDITION. |
-
1996-04-30soldstatus $51,875
-
1983-01-01soldstatus $21,000
ⓘ Source: listings_history table (triggers on properties + properties_extension) + one-shot
backfill from property_details.listing_events for pre-trigger history.
Tax reassessment forecast PA · Partial reset (capped growth)
- Current annual tax
- $3,002 · $250/mo
- Projected year-2 tax
- $3,002 · $250/mo
- Expected delta
- $0/yr ($0/mo · 0.0%)
ⓘ Screening estimate from a state-policy table — verify with the county assessor before closing.
Climate risk First Street
- Flood 6/10 Major FEMA zone X (unshaded) · 70% chance over 30 yrs
- Wildfire 1/10 Low
- Heat 5/10 Major 7 d/yr ≥102°F today · 15 d/yr by 30 yrs out
- Wind 4/10 Moderate 11% chance of damaging wind over 30 yrs
- Air quality 3/10 Moderate 3 unhealthy d/yr today · 5 by 30 yrs out
Nearby sold comps map
Loading sold comps map…
Walkable amenities ~0.75 mi
Loading nearby amenities…
Taxation est. · year 1
- Rental income
- $17,549
- − Mortgage interest
- −$8,570
- − Property taxes
- −$3,002
- − Insurance
- −$765
- − Repairs & maintenance
- −$1,404
- − Management
- −$1,404
- − Depreciation
- −$4,451
- Taxable loss
- −$2,047
- Est. tax savings @ 24.0%
- +$491
- After-tax cash flow
- $960/yr
For passive investors: Depreciation is non-cash, so a rental often shows a tax loss while cash-flowing — sheltering income. Rental losses are passive: they offset passive income freely, and up to $25,000/yr can offset ordinary (W-2) income if you actively participate and your MAGI is under $100k (phasing out to $0 by $150k); unused losses carry forward. On sale, claimed depreciation is recaptured at up to 25%, and gains may owe capital-gains tax (a 1031 exchange can defer both). Figures are a year-1 estimate at your 24.0% rate — not tax advice; consult a CPA.
Schools (NCES district)
- District
- York City SD
- NCES district ID
- 4226820
- Math proficiency
- 4% ▼ -7.00%
- Reading proficiency
- 16% ▼ -9.00%
- Median HH income
- $29,470
- Composite
- 7.61/100
- National rank
- #9943
- State rank
- #534 of 539 in PA
Livability — York
- Score
- 75/100
- State rank
- #427
- US rank
- #3987
Category grades
Schools grade is shown separately in the Schools card above.
Census & demographics
- Census place
- York, PA
- County
- York County · 278,806 people
- City population
- 184,764
- Metro
- York-Hanover, PA
- Population (ZIP)
- 40,287
- Household income
- $75,384
- Rent vs Own
- Severe rent burden
- 1305.0
Population outlook (York County) Hauer SSP2
- Today (2025)
- 454,205 people
- By 2030
- 457,407 · +0.7%
- By 2040
- 457,529 · +0.7%
- By 2050
- 448,261 · -1.3%
- By 2075
- 427,388 · -5.9%
- By 2100
- 384,218 · -15.4%
Race, ethnicity, and origin ACS 2023
- Neighborhood character
- Diverse neighborhood (Simpson 0.58)
- Race & ethnicity
- White 60% Hispanic / Latino 20% Black 12% Two or more races 9% Asian 3%
- Hispanic origin (detail)
- Mexican 3% Puerto Rican 10% Dominican 3%
- Common ancestry
- Romanian 3% Lithuanian 1% Slovak 1%
- Foreign-born
- 10% · Canada, Vietnam, Jamaica
- Languages at home
- 81% English-only · Spanish 14% Other Indo-European 1% Arabic 1%
Political lean MEDSL · York
- 2024 margin
- Strong R (+25.3) · D 36.9% · R 62.1%
- 2008→2024 swing
- -11.7pp toward R · 2008: -13.6pp · 2024: -25.3pp
- All cycles
- 2024: R+25.3 2020: R+24.6 2016: R+29.3 2012: R+21.2 2008: R+13.6
Not yet ingested
- Civics
- —
Market trends
- HPI YoY
- ▼ -104.51%
- Current HPI
- 284.0731
- Rent YoY
- ▲ 4.43%
- Metro
- York-Hanover, PA
- State GDP YoY
- ▲ 1.68%
- F500 in state
- 34
Industry mix (Fortune 500 HQ in PA)
| Industry | F500 HQs | Revenue |
|---|---|---|
| Healthcare | 2 | $309B |
|
||
| Insurance | 2 | $27B |
|
||
| Telecommunications / Media | 1 | $124B |
|
||
| Industrial Distribution | 1 | $22B |
|
||
| Financial Services | 1 | $20B |
|
||
| Chemicals / Materials | 1 | $18B |
|
||
Price history
+628.6% since first listed10 events — show timeline
- 2026-03-23 Pending — BRIGHT MLS
- 2026-02-20 Price Changed $153,000 BRIGHT MLS
- 2026-01-19 Price Changed $159,000 BRIGHT MLS
- 2026-01-08 Price Changed $164,900 BRIGHT MLS
- 2026-01-02 Listed $170,000 BRIGHT MLS
- 1999-11-30 Sold (MLS) $35,000 BRIGHT MLS
- 1999-10-19 Listing Removed — BRIGHT MLS
- 1999-06-10 Listed $42,500 BRIGHT MLS
- 1996-04-30 Sold (Public Records) $51,875 Public Records
- 1983-01-01 Sold (Public Records) $21,000 Public Records
Property tax history
+0.7%/yrLatest (2025): $3,002 · +0.9% YoY. Source: county tax records.
Cash-flow waterfall
monthlySold comps — $/sqft
last 12 mo · ≤1 miLoading sold comps…