180 Grace Chapel Rd Unit 210 · Blue Eye, MO
Flood risk 1/10 · Minimal
- FEMA flood zone
- X (unshaded)
- Chance of flooding over 30 yrs
- 0.0%
- Est. flood insurance / yr
- $507 – $1,088
Fire risk 3/10 · Minor
- Est. fire insurance / yr
- $1,054 – $1,958
Heat risk 4/10 · Minor
- Hot days now (above 104°F)
- 7 days/yr
- Hot days in 30 yrs
- 20 days/yr
Wind risk 2/10 · Minimal
- Chance of severe wind over 30 yrs
- 1.0%
Air-quality risk 2/10 · Minimal
- Unhealthy air days now
- 0 days/yr
- Unhealthy air days in 30 yrs
- 1 days/yr
Risk factors via First Street. Map © Google.
Why this score? — see what drove the C- grade
The composite is a weighted blend of 9 inputs, each scored 0–100. Each bar is that input's sub-score; the figure is the points it added to the 100-point composite (weight × sub-score).
- Cash flow +20.7/30.0
- DSCR +6.6/10.0
- Appreciation +6.3/10.0
- 1% rule +5.7/10.0
- Schools +3.7/10.0
- Livability +3.1/5.0
- Rent growth +2.5/5.0
- Condition / age +2.5/5.0
- ARV discount +0.3/15.0
$144,900
🖨 Deal sheet 📄 Offer letter ✓ Due diligence
Listing remarks MLS
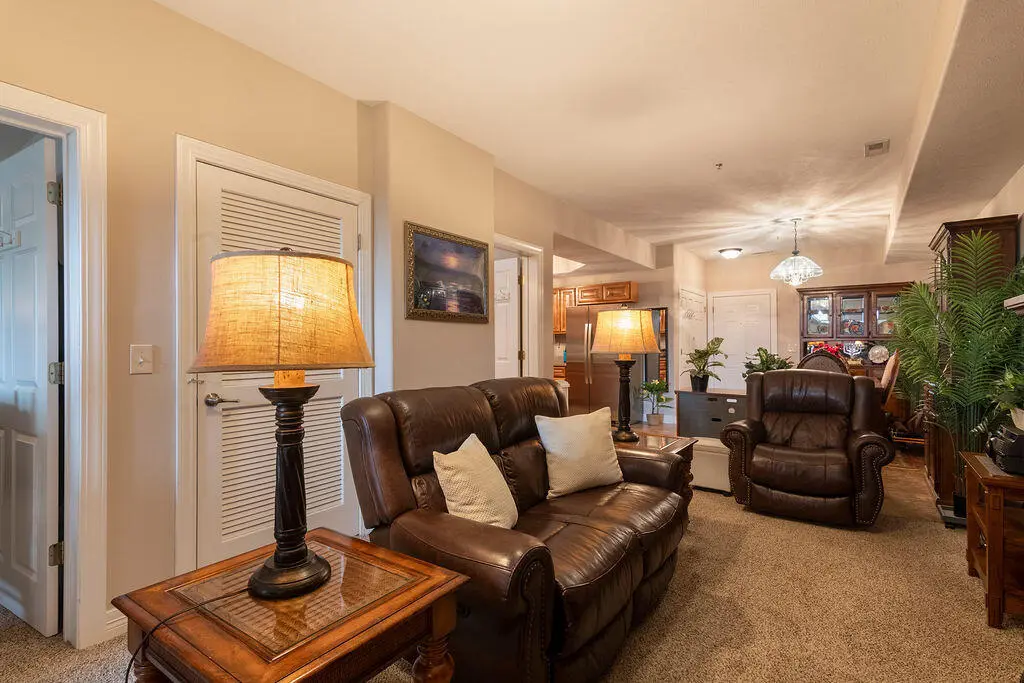
An exceptionally clean oversized one bedroom, one bath condominium with over 1000 sq/ft? Its all here!! This hard to find spacious floor plan gives so much flexibility for the fortunate buyer. Large kitchen with granite countertops and lots of cabinets for all your storage needs. Extremely well maintained open floor plan allows for flexibility and functionality. The main space is currently used as a dining room, living room, and office. Area behind office could be utilized as another bedroom - or. .. ?? A unique covered and enclosed deck with windows that open for cool breezes . .a lovely place to sit outdoors yet protected from the elements. Low monthly dues and low maintenance, along with security cameras throughout the building plus elevator makes this a true value and a very desirable property. Nestled in what is now known as Brushy Creek Ridge, this development offers a nice quiet setting, while still just a short drive to all the attractions and shops in Branson or take Hwy 13 north to Kimberling City and Branson West. Did I mention there is a fabulous Mexican restaurant located on the main floor?? Priced right - This is one you have to come see!
Key facts
- Security cameras
- Spacious floor plan
- Large kitchen
Tags
Neighborhood map
What this means for you Summary
Snapshot
- This is a 1-bed/1.0-bath condo listed at $145k.
Deal economics
- At list price, monthly cash flow is $196 ($2k/yr) — positive.
- The deal already cash-flows at list — no discount required.
- Meets the 1% rule at list price ($2k rent vs $145k).
- Recommended offer: $136k (6.0% below list) — sets the bar for market timing.
- Cap rate 7.9% vs local median 4.0% in Blue Eye — top-decile yield for the area; either an underpriced asset or a hidden risk that comps aren't pricing in. Stress-test before assuming the spread holds.
Location & tenants
- Location reads 61/100 on livability (#449 in MO) — a middle-class / working-renter tenant base. Strengths: cost of living A+; Watch: health & safety C-, schools D, crime F.
- Blue Eye R-V (rural): math 41% / reading 47% proficiency, ranked #107 of 324 in MO (top 33%) — families likely to look elsewhere, expect single-tenant / working-renter base with shorter leases.
- Market conditions: 91 active listings in the ZIP; 191 units permitted in Stone County in 2024 (0 in 5+ unit buildings).
Forward outlook
- In year one you build about $5k of equity ($1k loan paydown + $4k appreciation (2.6% local appreciation)).
- Stone County population projected at -30% by 2050 — secular population decline; favor cash flow + early exit over multi-decade hold.
- At projected returns (2.6% appreciation + 3.0% rent growth), your $41k cash investment doubles in ~5 years — after that, you're playing with house money.
- By year 7, paydown + projected appreciation supports a ~$31k cash-out refi (75% LTV) — recoverable capital for the next deal without selling this one.
Negotiation context
- It's been on market 65 days — a 6% lower offer ($136k) is reasonable based on typical stale-listing flexibility.
- 2 sale attempts since 6y ago with the ask held roughly flat each time — persistent listings suggest the price (not the market) is what's stuck; bring a comps-based counter.
Questions for the listing agent
- It's been on market 65 days. Have you received any prior offers? Is the seller open to a 6% concession, seller financing, or rate buy-down credit?
- What does the HOA fee cover, when was the last increase, and are there any pending special assessments or reserve-fund shortfalls?
- Any open or pending special assessments — roof, HVAC, plumbing, elevator, façade? What's the per-unit balance and payoff schedule, and is the seller paying it off at close or rolling it to the buyer?
- Why hasn't it sold? Are there any deal-killer items the seller is aware of (foundation, flood, title, zoning, code violations)?
- Is there a deadline driving the sale (1031 exchange, divorce, estate, relocation)? That informs how much negotiation room exists.
- Schools are D-rated, which usually means shorter tenancies and higher turnover. Who's the typical renter profile here, and what's been the actual vacancy rate?
- Crime grade is F in this area — have there been break-ins, vandalism, or insurance claims at this property in the last 3 years? What carrier currently insures it and at what premium?
- What's the average days-on-market for RENTAL listings here right now (not sales)? A rising rental-DOM trend means longer vacancies and softer asking-rent achievability than the comps imply.
- What's the recent tenant-quality profile in this submarket — average credit score on applications, eviction rate, late-payment / NSF rate, and stable-employment percentage? A property-management company in the area should have these aggregated.
- How much new apartment / multifamily construction is in the pipeline within 1–3 miles? Heavy new supply (>2% of stock underway) typically softens rents 12–24 months out; light construction supports rent growth.
Investment metrics
- 1% rule
- 1.07% ✓
- Cap rate
- 7.92%
- Cash-on-cash
- 5.81%
- DSCR
- 1.26
- GRM
- 7.8
CMA / ARV
- ARV (median comp)
- $124,859
- List price
- $144,900
- Delta
- 16.05%
- Verdict
- OVERPRICED
- Comps
- 10 within 1.0 mi
Projected returns pro-forma
2.63% appreciation · 3.0% rent growth · sell at horizon
- IRR
- 12.0%
- Equity multiple
- 1.67×
- Total profit
- $27,228
- Equity at exit
- $62,195
- IRR
- 14.3%
- Equity multiple
- 3.05×
- Total profit
- $82,983
- Equity at exit
- $93,610
Cash invested: $40,572 (down + closing). Projections, not guarantees.
Landlord ↔ Tenant lean methodology
- Overall (STATE)
- 81 Strongly Landlord-Friendly
- State Missouri
- 81 Strongly Landlord-Friendly · R+10
- County
- — inherits STATE
- City
- — inherits STATE
ZIP-level market 65611
- Home prices YoY
- 1.3%
- Active inventory
- 91
- Price-to-rent
- 7.8×
Monthly cashflow live
- Estimated rent
- $1,554 medium interval (Pro) →
- Mortgage (P&I)
- −$760
- Tax from tax record
- −$61 /mo · $735/yr
- Insurance
- −$60
- HOA
- −$150
- Vacancy / Maint / Mgmt
- −$326
- Net cashflow
- $196
Break-even live
UW: 25.0% down · 7.5% · 30yr · 1.5% tax · 5.0% vac · 8.0% maint · 8.0% mgmt
Financing live
Cash to close
- Down payment
- $36,225
- Closing costs
- $4,347
- Reserves months
- —
- Total cash needed
- —
Loan-product check · same deal, 3 products live
Conventional
25% down · 7.5% · 30yr
- Down + closing
- —
- Monthly P&I
- —
- Monthly cashflow
- —
- DSCR
- —
- Eligible?
- —
Personal DTI + credit; lowest rate.
DSCR
20% down · 8.5% · 30yr
- Down + closing
- —
- Monthly P&I
- —
- Monthly cashflow
- —
- DSCR
- —
- Eligible?
- —
No personal income docs; deal must DSCR.
Hard money
10% down · 12.0% · 12mo
- Down + closing
- —
- Monthly P&I
- —
- Monthly cashflow
- —
- DSCR
- —
- Eligible?
- —
Short-term bridge; refi at stabilization.
HOA detail condo
- Monthly dues
- $150 · $1,800/yr
- Likely covers
- security
- Assessments
- None detected in remarks — confirm with the listing agent.
Listing history 19 events
-
2026-06-19days on market $144,900 Active 65 DOM
-
2026-06-18days on market $144,900 Active 64 DOM
-
2026-06-17days on market $144,900 Active 63 DOM
-
2026-06-16days on market $144,900 Active 62 DOM
-
2026-06-15days on market $144,900 Active 61 DOM
-
2026-06-14days on market $144,900 Active 59 DOM
-
2026-06-12days on market $144,900 Active 58 DOM
-
2026-06-09days on market $144,900 Active 55 DOM
-
2026-06-08days on market $144,900 Active 54 DOM
-
2026-06-07days on market $144,900 Active 53 DOM
-
2026-06-05days on market $144,900 Active 50 DOM
-
2026-06-03days on market $144,900 Active 49 DOM
-
2026-06-02days on market $144,900 Active 48 DOM
-
2026-06-01days on market $144,900 Active 47 DOM
-
2026-05-31days on market $144,900 Active 46 DOM
-
2026-05-30days on market $144,900 Active 45 DOM
-
2026-04-15$144,900 Active 1177-char remark
Show marketing remark (1177 chars)
An exceptionally clean oversized one bedroom, one bath condominium with over 1000 sq/ft? Its all here!! This hard to find spacious floor plan gives so much flexibility for the fortunate buyer. Large kitchen with granite countertops and lots of cabinets for all your storage needs. Extremely well maintained open floor plan allows for flexibility and functionality. The main space is currently used as a dining room, living room, and office. Area behind office could be utilized as another bedroom - or. .. ?? A unique covered and enclosed deck with windows that open for cool breezes . .a lovely place to sit outdoors yet protected from the elements. Low monthly dues and low maintenance, along with security cameras throughout the building plus elevator makes this a true value and a very desirable property. Nestled in what is now known as Brushy Creek Ridge, this development offers a nice quiet setting, while still just a short drive to all the attractions and shops in Branson or take Hwy 13 north to Kimberling City and Branson West. Did I mention there is a fabulous Mexican restaurant located on the main floor?? Priced right - This is one you have to come see!
-
2023-05-08soldstatus
-
2020-10-19$150,000
ⓘ Source: listings_history table (triggers on properties + properties_extension) + one-shot
backfill from property_details.listing_events for pre-trigger history.
Tax reassessment forecast MO · Resets to sale price
- Current annual tax
- $735 · $61/mo
- Projected year-2 tax
- $1,406 · $117/mo
- Expected delta
- +$671/yr (+$56/mo · 91.3%)
ⓘ Screening estimate from a state-policy table — verify with the county assessor before closing.
Climate risk First Street
- Flood 1/10 Low FEMA zone X (unshaded) · 0% chance over 30 yrs
- Wildfire 3/10 Moderate
- Heat 4/10 Moderate 7 d/yr ≥104°F today · 20 d/yr by 30 yrs out
- Wind 2/10 Low 100% chance of damaging wind over 30 yrs
- Air quality 2/10 Low 0 unhealthy d/yr today · 1 by 30 yrs out
Nearby sold comps map
Loading sold comps map…
Walkable amenities ~0.75 mi
Loading nearby amenities…
Taxation est. · year 1
- Rental income
- $18,652
- − Mortgage interest
- −$8,117
- − Property taxes
- −$735
- − Insurance
- −$724
- − Repairs & maintenance
- −$1,492
- − Management
- −$1,492
- − HOA
- −$1,800
- − Depreciation
- −$4,215
- Taxable income
- $76
- Est. tax owed @ 24.0%
- −$18
- After-tax cash flow
- $2,339/yr
For passive investors: Depreciation is non-cash, so a rental often shows a tax loss while cash-flowing — sheltering income. Rental losses are passive: they offset passive income freely, and up to $25,000/yr can offset ordinary (W-2) income if you actively participate and your MAGI is under $100k (phasing out to $0 by $150k); unused losses carry forward. On sale, claimed depreciation is recaptured at up to 25%, and gains may owe capital-gains tax (a 1031 exchange can defer both). Figures are a year-1 estimate at your 24.0% rate — not tax advice; consult a CPA.
Schools (NCES district)
- District
- Blue Eye R-V
- NCES district ID
- 2905280
- Math proficiency
- 41% ▲ 3.00%
- Reading proficiency
- 47% ▼ -5.00%
- Median HH income
- $42,591
- Composite
- 37.08/100
- National rank
- #4500
- State rank
- #107 of 324 in MO
Livability — Blue Eye
- Score
- 61/100
- State rank
- #449
- US rank
- #18289
Category grades
Schools grade is shown separately in the Schools card above.
Census & demographics
- Census place
- Blue Eye, MO
- Population (ZIP)
- 1,784
Population outlook (Stone County) Hauer SSP2
- Today (2025)
- 28,147 people
- By 2030
- 26,405 · -6.2%
- By 2040
- 22,762 · -19.1%
- By 2050
- 19,706 · -30.0%
- By 2075
- 14,742 · -47.6%
- By 2100
- 10,832 · -61.5%
Race, ethnicity, and origin ACS 2023
- Neighborhood character
- Predominantly White (96%)
- Race & ethnicity
- White 96% Two or more races 1%
- Common ancestry
- Lithuanian 6% Romanian 4% Slovak 2%
- Foreign-born
- 1% · Canada
Political lean MEDSL · Stone
- 2024 margin
- Solid R (+61.4) · D 18.9% · R 80.3%
- 2008→2024 swing
- -24.1pp toward R · 2008: -37.3pp · 2024: -61.4pp
- All cycles
- 2024: R+61.4 2020: R+61.1 2016: R+62.1 2012: R+49.2 2008: R+37.3
Not yet ingested
- Civics
- —
Market trends
- HPI YoY
- ▲ 2.63%
- Current HPI
- 204.4936
- Rent YoY
- —
- Metro
- —
- State GDP YoY
- ▲ 1.84%
- F500 in state
- 20
Industry mix (Fortune 500 HQ in MO)
| Industry | F500 HQs | Revenue |
|---|---|---|
| Healthcare | 1 | $163B |
|
||
| Insurance | 1 | $21B |
|
||
| Industrial Technology | 1 | $17B |
|
||
| Retail | 1 | $16B |
|
||
| Industrial Distribution | 1 | $10B |
|
||
| Utilities | 1 | $9B |
|
||
Price history
-3.4% since first listed3 events — show timeline
- 2026-04-15 Listed $144,900 SOMO
- 2023-05-08 Sold (Public Records) — Public Records
- 2020-10-19 Listed $150,000 SOMO
Property tax history
-0.0%/yrLatest (2025): $735 · +1.2% YoY. Source: county tax records.
Cash-flow waterfall
monthlySold comps — $/sqft
last 12 mo · ≤1 miLoading sold comps…