6803 Marble Rdg · San Antonio, TX
Flood risk No data
- FEMA flood zone
- —
- Chance of flooding over 30 yrs
- —
- Est. flood insurance / yr
- —
Fire risk No data
- Est. fire insurance / yr
- —
Heat risk No data
- Hot days now (above threshold)
- —
- Hot days in 30 yrs
- —
Wind risk No data
- Chance of severe wind over 30 yrs
- —
Air-quality risk No data
- Unhealthy air days now
- —
- Unhealthy air days in 30 yrs
- —
Risk factors via First Street. Map © Google.
Why this score? — see what drove the C- grade
The composite is a weighted blend of 9 inputs, each scored 0–100. Each bar is that input's sub-score; the figure is the points it added to the 100-point composite (weight × sub-score).
- Cash flow +16.2/30.0
- ARV discount +6.5/15.0
- 1% rule +5.2/10.0
- DSCR +5.0/10.0
- Appreciation +4.9/10.0
- Condition / age +4.8/5.0
- Livability +4.0/5.0
- Rent growth +2.5/5.0
- Schools +1.9/10.0
$161,999
🖨 Deal sheet 📄 Offer letter ✓ Due diligence
Listing remarks MLS
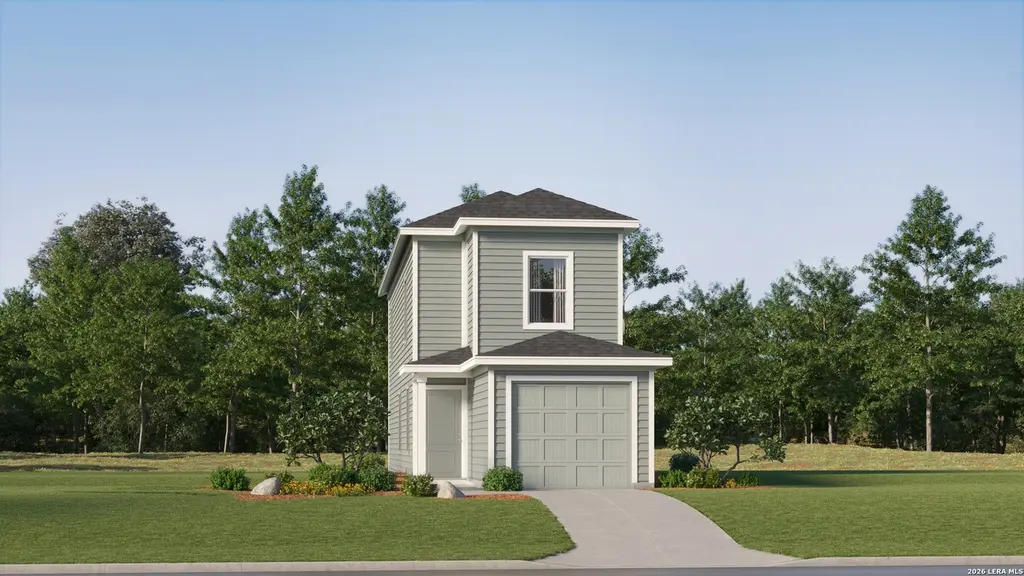
The Pima - The first floor of this two-story home is host to a spacious open floorplan that seamlessly connects an inviting family room, elegant dining room and chef-inspired kitchen. Upstairs, there are three bedrooms, including the luxe owner's suite, which features a restful bedroom, en-suite bathroom and generous walk-in closet. Estimated Completion July 2026. The completion date, prices and features may vary and are subject to change. Please verify with Lennar directly. Photos are for illustrative purposes only.
Key facts
- En suite bathroom
- Open floorplan
- Walk in closet
Tags
Neighborhood map
What this means for you Summary
Snapshot
- This is a 3-bed/2.5-bath single-family listed at $162k. Condition is rated excellent.
Deal economics
- At list price, monthly cash flow is $85 ($1k/yr) — positive.
- The deal already cash-flows at list — no discount required.
- Meets the 1% rule at list price ($2k rent vs $162k).
- Recommended offer: $152k (6.0% below list) — sets the bar for market timing.
- Cap rate 6.9% vs local median 3.8% in San Antonio — top-decile yield for the area; either an underpriced asset or a hidden risk that comps aren't pricing in. Stress-test before assuming the spread holds.
Location & tenants
- Location reads 80/100 on livability (#31 in TX, #1,616 nationally) — a professional / high-income tenant draw. Strengths: amenities A+, commute A+, cost of living A+; Watch: schools C-, crime F.
- East Central ISD (rural): math 16% / reading 25% proficiency, ranked #758 of 826 in TX (top 92%) — low school quality limits family demand, transient renter base, plan for 1-2y turnover; 61% free/reduced lunch — lower-income household profile, screen leases tightly.
- Market conditions: 442 active listings in the ZIP; 7 comparable units currently listed for rent nearby; rentals leasing fast (median 2d on market — plan ~1-2 weeks tenant-placement turnaround); 8,308 units permitted in Bexar County in 2024 (2,506 in 5+ unit buildings).
Forward outlook
- In year one you build about $852 of equity ($1k loan paydown + $-268 appreciation (-0.2% local appreciation)).
- Bexar County population projected at +50% by 2050 — long-run rental-demand tailwind backs the buy-and-hold thesis.
Negotiation context
- It's been on market 62 days — a 6% lower offer ($152k) is reasonable based on typical stale-listing flexibility.
Questions for the listing agent
- It's been on market 62 days. Have you received any prior offers? Is the seller open to a 6% concession, seller financing, or rate buy-down credit?
- What does the HOA fee cover, when was the last increase, and are there any pending special assessments or reserve-fund shortfalls?
- Why hasn't it sold? Are there any deal-killer items the seller is aware of (foundation, flood, title, zoning, code violations)?
- Is there a deadline driving the sale (1031 exchange, divorce, estate, relocation)? That informs how much negotiation room exists.
- Crime grade is F in this area — have there been break-ins, vandalism, or insurance claims at this property in the last 3 years? What carrier currently insures it and at what premium?
- What's the average days-on-market for RENTAL listings here right now (not sales)? A rising rental-DOM trend means longer vacancies and softer asking-rent achievability than the comps imply.
- What's the recent tenant-quality profile in this submarket — average credit score on applications, eviction rate, late-payment / NSF rate, and stable-employment percentage? A property-management company in the area should have these aggregated.
- How much new for-sale + rental construction is in the pipeline within 1–3 miles? Heavy new supply typically softens prices + rents 12–24 months out; constrained supply supports both.
Investment metrics
- 1% rule
- 1.02% ✓
- Cap rate
- 6.92%
- Cash-on-cash
- 2.24%
- DSCR
- 1.10
- GRM
- 8.1
CMA / ARV
- ARV (median comp)
- $158,499
- List price
- $161,999
- Delta
- 2.21%
- Verdict
- FAIR
- Comps
- 20 within 1.0 mi
Show comp detail 12 sales within ~0.75 mi
| Address | Dist | Beds/Ba | Sqft | Sold | Price | $/sf | Match |
|---|---|---|---|---|---|---|---|
| 6729 Marble Rdg | 0.03mi | 3/2.5 | 1,360 (0%) | 0mo | $140,999 | $104 | 98 |
| 6808 Marble Rdg | 0.04mi | 3/2.5 | 1,360 (0%) | 1mo | $143,999 | $106 | 97 |
| 6844 Marble Rdg | 0.06mi | 3/2.5 | 1,360 (0%) | 0mo | $139,999 | $103 | 97 |
| 6820 Marble Rdg | 0.04mi | 3/2.5 | 1,360 (0%) | 2mo | $146,999 | $108 | 96 |
| 6832 Marble Rdg | 0.05mi | 3/2.5 | 1,360 (0%) | 2mo | $169,999 | $125 | 96 |
| 6630 Fiore Gdn | 0.22mi | 3/2.0 | 1,354 (-0%) | 1mo | $188,999 | $140 | 86 |
| 6725 Marble Rdg | 0.03mi | 3/2.5 | 1,189 (-13%) | 0mo | $146,999 | $124 | 77 |
| 15102 Azzurro Stone | 0.22mi | 3/2.0 | 1,266 (-7%) | 1mo | $177,999 | $141 | 76 |
| 6837 Chert Chase | 0.07mi | 3/2.0 | 1,192 (-12%) | 0mo | $130,999 | $110 | 74 |
| 6813 Chert Chase | 0.05mi | 3/2.0 | 1,192 (-12%) | 1mo | $136,999 | $115 | 74 |
| 15103 Azzurro Stone | 0.10mi | 4/2.0 (+1) | 1,483 (+9%) | 1mo | $177,999 | $120 | 72 |
| 14805 Mudstone Pl | 0.11mi | 4/2.0 (+1) | 1,483 (+9%) | 1mo | $177,999 | $120 | 72 |
Match score weights: distance 35% · size 25% · config 20% · recency 20%. Top-matched comps best support the ARV.
Projected returns pro-forma
-0.17% appreciation · 3.0% rent growth · sell at horizon
- IRR
- -0.2%
- Equity multiple
- 0.99×
- Total profit
- $-507
- Equity at exit
- $45,706
- IRR
- 5.5%
- Equity multiple
- 1.59×
- Total profit
- $26,720
- Equity at exit
- $53,887
Cash invested: $45,360 (down + closing). Projections, not guarantees.
Landlord ↔ Tenant lean methodology
- Overall (STATE)
- 87 Strongly Landlord-Friendly
- State Texas
- 87 Strongly Landlord-Friendly · R+5
- County
- — inherits STATE
- City
- — inherits STATE
ZIP-level market 78112
- Home prices YoY
- -0.1%
- Active inventory
- 442
- Price-to-rent
- 8.1×
Monthly cashflow live
- Estimated rent
- $1,659 high interval (Pro) →
- Mortgage (P&I)
- −$850
- Tax est. 1.5%
- −$202 /mo · $2,430/yr
- Insurance
- −$67
- HOA
- −$106
- Vacancy / Maint / Mgmt
- −$348
- Net cashflow
- $85
Break-even live
UW: 25.0% down · 7.5% · 30yr · 1.5% tax · 5.0% vac · 8.0% maint · 8.0% mgmt
Financing live
Cash to close
- Down payment
- $40,500
- Closing costs
- $4,860
- Reserves months
- —
- Total cash needed
- —
Loan-product check · same deal, 3 products live
Conventional
25% down · 7.5% · 30yr
- Down + closing
- —
- Monthly P&I
- —
- Monthly cashflow
- —
- DSCR
- —
- Eligible?
- —
Personal DTI + credit; lowest rate.
DSCR
20% down · 8.5% · 30yr
- Down + closing
- —
- Monthly P&I
- —
- Monthly cashflow
- —
- DSCR
- —
- Eligible?
- —
No personal income docs; deal must DSCR.
Hard money
10% down · 12.0% · 12mo
- Down + closing
- —
- Monthly P&I
- —
- Monthly cashflow
- —
- DSCR
- —
- Eligible?
- —
Short-term bridge; refi at stabilization.
Rent comps 7 comps
| Address | Beds | Baths | Sqft | Rent | $/sqft | DOM | Units | Dist |
|---|---|---|---|---|---|---|---|---|
| 6933 Calcite Trl San Antonio, TX | 4.0 | 2.0 | 1606 | $1,695 | $1.06 | 12d | 1 | 0.24mi |
| 6948 Calcite Trl San Antonio, TX | 3.0 | 2.0 | 1440 | $1,600 | $1.11 | 1d | 1 | 0.29mi |
| 6933 Biotite Rdg San Antonio, TX | 3.0 | 2.0 | 1125 | $1,650 | $1.47 | 10d | 1 | 0.29mi |
| 14606 Hackamore Way Elmendorf, TX | 4.0 | 2.0 | 1699 | $1,700 | $1.00 | 15d | 1 | 0.95mi |
| 14606 Hackamore Way Elmendorf, TX | 4.0 | 2.0 | 1696 | $1,700 | $1.00 | 1d | 1 | 0.95mi |
| 14651 Latigo Loop Elmendorf, TX | 4.0 | 2.0 | 1696 | $1,750 | $1.03 | 1d | 1 | 1.06mi |
| 7663 Stud Dr Elmendorf, TX | 3.0 | 2.0 | 1233 | $1,600 | $1.30 | 1d | 1 | 1.09mi |
HOA detail
- Monthly dues
- $106 · $1,272/yr
Listing history 17 events
-
2026-06-18days on market $161,999 Active 62 DOM
-
2026-06-17days on market $161,999 Active 61 DOM
-
2026-06-16days on market $161,999 Active 60 DOM
-
2026-06-15days on market $161,999 Active 59 DOM
-
2026-06-13days on market $161,999 Active 57 DOM
-
2026-06-09days on market $161,999 Active 53 DOM
-
2026-06-08days on market $161,999 Active 52 DOM
-
2026-06-07days on market $161,999 Active 51 DOM
-
2026-06-04days on market $161,999 Active 48 DOM
-
2026-06-03days on market $161,999 Active 47 DOM
-
2026-06-02days on market $161,999 Active 46 DOM
-
2026-06-01days on market $161,999 Active 45 DOM
-
2026-05-31statusdays on market $161,999 Active 44 DOM
-
2026-05-15price $162,999 522-char remark
Show marketing remark (522 chars)
The Pima - The first floor of this two-story home is host to a spacious open floorplan that seamlessly connects an inviting family room, elegant dining room and chef-inspired kitchen. Upstairs, there are three bedrooms, including the luxe owner's suite, which features a restful bedroom, en-suite bathroom and generous walk-in closet. Estimated Completion July 2026. The completion date, prices and features may vary and are subject to change. Please verify with Lennar directly. Photos are for illustrative purposes only.
-
2026-05-07price $164,999 522-char remark
Show marketing remark (522 chars)
The Pima - The first floor of this two-story home is host to a spacious open floorplan that seamlessly connects an inviting family room, elegant dining room and chef-inspired kitchen. Upstairs, there are three bedrooms, including the luxe owner's suite, which features a restful bedroom, en-suite bathroom and generous walk-in closet. Estimated Completion July 2026. The completion date, prices and features may vary and are subject to change. Please verify with Lennar directly. Photos are for illustrative purposes only.
-
2026-04-30price $165,999 522-char remark
Show marketing remark (522 chars)
The Pima - The first floor of this two-story home is host to a spacious open floorplan that seamlessly connects an inviting family room, elegant dining room and chef-inspired kitchen. Upstairs, there are three bedrooms, including the luxe owner's suite, which features a restful bedroom, en-suite bathroom and generous walk-in closet. Estimated Completion July 2026. The completion date, prices and features may vary and are subject to change. Please verify with Lennar directly. Photos are for illustrative purposes only.
-
2026-04-17$167,999 New 522-char remark
Show marketing remark (522 chars)
The Pima - The first floor of this two-story home is host to a spacious open floorplan that seamlessly connects an inviting family room, elegant dining room and chef-inspired kitchen. Upstairs, there are three bedrooms, including the luxe owner's suite, which features a restful bedroom, en-suite bathroom and generous walk-in closet. Estimated Completion July 2026. The completion date, prices and features may vary and are subject to change. Please verify with Lennar directly. Photos are for illustrative purposes only.
ⓘ Source: listings_history table (triggers on properties + properties_extension) + one-shot
backfill from property_details.listing_events for pre-trigger history.
Nearby sold comps map
Loading sold comps map…
Walkable amenities ~0.75 mi
Loading nearby amenities…
Taxation est. · year 1
- Rental income
- $19,903
- − Mortgage interest
- −$9,074
- − Property taxes
- −$2,430
- − Insurance
- −$810
- − Repairs & maintenance
- −$1,592
- − Management
- −$1,592
- − HOA
- −$1,272
- − Depreciation
- −$4,713
- Taxable loss
- −$1,581
- Est. tax savings @ 24.0%
- +$379
- After-tax cash flow
- $1,396/yr
For passive investors: Depreciation is non-cash, so a rental often shows a tax loss while cash-flowing — sheltering income. Rental losses are passive: they offset passive income freely, and up to $25,000/yr can offset ordinary (W-2) income if you actively participate and your MAGI is under $100k (phasing out to $0 by $150k); unused losses carry forward. On sale, claimed depreciation is recaptured at up to 25%, and gains may owe capital-gains tax (a 1031 exchange can defer both). Figures are a year-1 estimate at your 24.0% rate — not tax advice; consult a CPA.
Condition & rehab AI · 12 photos
This two-story home is move-in ready with a modern design and excellent condition. It offers a spacious open floorplan, two bathrooms, and a well-maintained exterior. Potential buyers will appreciate the fresh paint and landscaping improvements, while renters will value the updated kitchen and bathrooms.
Value-add opportunities
- Both Painting the exterior and interior walls — Fresh paint can enhance curb appeal and interior aesthetics.
- Both Landscaping improvements — Enhanced landscaping can increase curb appeal and property value.
- Resale Kitchen appliances — Upgrading appliances can attract more buyers.
- Resale Bathroom fixtures — Modern fixtures can appeal to potential buyers.
- Resale Flooring in bathrooms — Updated flooring can improve the overall look and feel of the bathrooms.
Renovation cost estimate screening
Value-add ROI direction
- Both Painting the exterior and interior walls — Fresh paint can enhance curb appeal and interior aesthetics. ↑
- Both Landscaping improvements — Enhanced landscaping can increase curb appeal and property value. ↑
- Resale Kitchen appliances — Upgrading appliances can attract more buyers. ↑
- Resale Bathroom fixtures — Modern fixtures can appeal to potential buyers. ↑
- Resale Flooring in bathrooms — Updated flooring can improve the overall look and feel of the bathrooms. ↑
ⓘ Cost ranges are severity-bucket heuristics (US national rule-of-thumb). Get contractor quotes + a written scope before underwriting a rehab budget.
Schools (NCES district)
- District
- East Central ISD
- NCES district ID
- 4817850
- Math proficiency
- 16% ▼ -12.00%
- Reading proficiency
- 25% ▼ -6.00%
- Median HH income
- $53,941
- Composite
- 18.67/100
- National rank
- #8887
- State rank
- #758 of 826 in TX
Livability — San Antonio
- Score
- 80/100
- State rank
- #31
- US rank
- #1616
Category grades
Schools grade is shown separately in the Schools card above.
Census & demographics
- City population
- 1,806,925
- Population (ZIP)
- 9,959
Population outlook (Bexar County) Hauer SSP2
- Today (2025)
- 2,336,851 people
- By 2030
- 2,560,728 · +9.6%
- By 2040
- 3,020,569 · +29.3%
- By 2050
- 3,493,522 · +49.5%
- By 2075
- 4,668,459 · +99.8%
- By 2100
- 5,533,242 · +136.8%
Race, ethnicity, and origin ACS 2023
- Neighborhood character
- Predominantly Hispanic (72%)
- Race & ethnicity
- Hispanic / Latino 72% Two or more races 39% White 24% Asian 1%
- Hispanic origin (detail)
- Mexican 64%
- Common ancestry
- Lithuanian 1%
- Foreign-born
- 14% · Canada
- Languages at home
- 57% English-only · Spanish 42% Tagalog/Filipino 1%
Political lean MEDSL · Bexar
- 2024 margin
- Lean D (+9.8) · D 54.3% · R 44.6% · Other 1.1%
- 2008→2024 swing
- +4.2pp toward D · 2008: 5.6pp · 2024: 9.8pp
- All cycles
- 2024: D+9.8 2020: D+18.2 2016: D+13.5 2012: D+4.6 2008: D+5.6
Not yet ingested
- Civics
- —
Market trends
- HPI YoY
- ▼ -0.17%
- Current HPI
- 276.3302
- Rent YoY
- —
- Metro
- —
- State GDP YoY
- ▲ 3.95%
- F500 in state
- 110
Industry mix (Fortune 500 HQ in TX)
| Industry | F500 HQs | Revenue |
|---|---|---|
| Energy | 16 | $1,198B |
|
||
| Technology | 5 | $198B |
|
||
| Engineering / Construction | 4 | $72B |
|
||
| Energy Services | 3 | $60B |
|
||
| Utilities | 3 | $41B |
|
||
| Healthcare | 2 | $330B |
|
||
Price history
-3.0% since first listed4 events — show timeline
- 2026-05-15 Price Changed $162,999 LERA
- 2026-05-07 Price Changed $164,999 LERA
- 2026-04-30 Price Changed $165,999 LERA
- 2026-04-17 Listed $167,999 LERA
Cash-flow waterfall
monthlySold comps — $/sqft
last 12 mo · ≤1 miLoading sold comps…