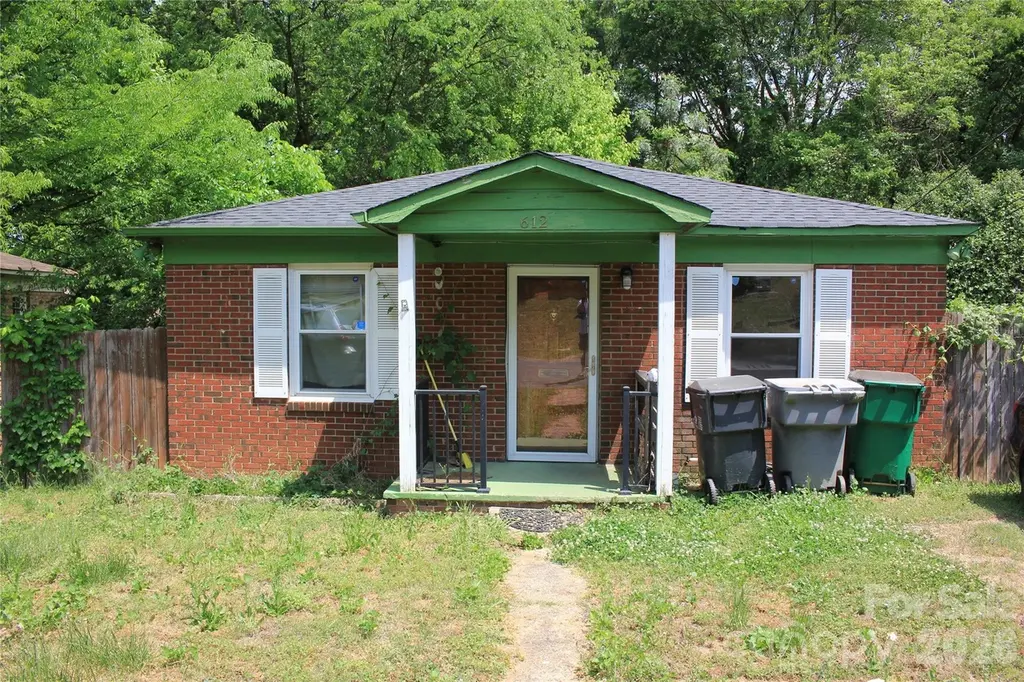
612 Miller St · Charlotte, NC
Flood risk 9/10 · Severe
- FEMA flood zone
- X (unshaded)
- Chance of flooding over 30 yrs
- 0.99%
- Est. flood insurance / yr
- $507 – $1,088
Fire risk 1/10 · Minimal
- Est. fire insurance / yr
- $906 – $1,684
Heat risk 6/10 · Moderate
- Hot days now (above 104°F)
- 7 days/yr
- Hot days in 30 yrs
- 17 days/yr
Wind risk 6/10 · Moderate
- Chance of severe wind over 30 yrs
- 27.0%
Air-quality risk 3/10 · Minor
- Unhealthy air days now
- 3 days/yr
- Unhealthy air days in 30 yrs
- 4 days/yr
Risk factors via First Street. Map © Google.
Why this score? — see what drove the C grade
The composite is a weighted blend of 9 inputs, each scored 0–100. Each bar is that input's sub-score; the figure is the points it added to the 100-point composite (weight × sub-score).
- Cash flow +26.2/30.0
- DSCR +8.8/10.0
- 1% rule +5.9/10.0
- ARV discount +5.7/15.0
- Livability +3.9/5.0
- Schools +3.8/10.0
- Rent growth +3.0/5.0
- Condition / age +2.5/5.0
- Appreciation +0.0/10.0
$240,000
🖨 Deal sheet 📄 Offer letter ✓ Due diligence
Listing remarks
Investor/Builder opportunity in highly desirable 28203. This 2BR/1BA brick home is currently tenant-occupied with a strong rental history, providing immediate income while you plan for the future. Situated on a . 13-acre lot with N1-D zoning, the property is ideally suited for residential redevelopment in an area experiencing ongoing infill and new construction. Surrounded by revitalization and conveniently located near South End, Uptown, and major transportation corridors, this is a prime hold-or-build scenario. Property is being sold subject to lease—do not disturb tenant.
Key facts
- 0.13 acre lot
- N1-d zoning
- 5,619 sq ft lot
Tags
Property features AI
Finance
- HOA & community: No HOA dues
Exterior
- Parking: Driveway
- Utilities: City water; Public sewer; Cable connected; Electricity connected
- Home design: Single-family residence; Site-built property; One story; Completed development; Zoned N1-D
- Construction: Partially brick construction; Crawl space foundation
- Exterior features: Gravel and paved road access; Publicly maintained road; Partially brick exterior
Interior
- Kitchen: Electric range
- Bedrooms: Two bedrooms on the main level
- Bathrooms: One full bathroom on the main level
- Heating & cooling: Central heating; Central air conditioning
- Interior features: Five total rooms; Electric range
- Laundry & utility: Laundry closet
Neighborhood map
What this means for you Summary
Snapshot
- This is a 2-bed/1.0-bath single-family listed at $240k.
Deal economics
- At list price, monthly cash flow is $542 ($7k/yr) — positive.
- The deal already cash-flows at list — no discount required.
- Meets the 1% rule at list price ($3k rent vs $240k).
- Recommended offer: $233k (3.0% below list) — sets the bar for market timing.
- Cap rate 9.3% vs local median 3.1% in Charlotte — top-decile yield for the area; either an underpriced asset or a hidden risk that comps aren't pricing in. Stress-test before assuming the spread holds.
Location & tenants
- Location reads 78/100 on livability (#26 in NC, #2,502 nationally) — a middle-class / working-renter tenant base. Strengths: amenities A+, commute A+, housing A+; Watch: crime F.
- Charlotte-Mecklenburg Schools (urban): math 42% / reading 46% proficiency, ranked #85 of 178 in NC (top 48%) — families likely to look elsewhere, expect single-tenant / working-renter base with shorter leases.
- Zoned schools: Park Road Montessori (math 60% / reading 72%, grade B+, #135 of 1,410 statewide, top 10%, 513 students, 13% FRL); Myers Park High School (math 81% / reading 75%, grade A-, #85 of 535 statewide, top 16%, 3,593 students, 26% FRL) — zoned schools average 19% FRL vs 49% district-wide (30 pts lower); this property's tenant base skews higher-income than the district average.
- Zoned-school proficiency averages 72% at this address vs 44% district-wide (+28 pts) — the actual schools serving this property are materially stronger than the Charlotte-Mecklenburg Schools average implies; a family-tenant draw the district grade alone would hide.
- Market conditions: Rents rising (+1.8%/yr); 132 active listings in the ZIP; 40 comparable units currently listed for rent nearby; rentals leasing fast (median 3d on market — plan ~1-2 weeks tenant-placement turnaround); solid renter incomes; 11,969 units permitted in Mecklenburg County in 2024 (5,377 in 5+ unit buildings).
Forward outlook
- Local home prices are declining (-3.0%/yr); year-one equity from $2k of loan paydown is wiped out by about $7k of value loss. Plan a longer hold.
- Mecklenburg County population projected at +53% by 2050 — long-run rental-demand tailwind backs the buy-and-hold thesis.
Negotiation context
- It's been on market 55 days — a 3% lower offer ($233k) is reasonable based on typical stale-listing flexibility.
- Current owner paid $16k; list at $240k implies a 1400% gain — meaningful room to come down on a strong offer.
Risks & watch-outs
- Watch-outs: flood insurance adds $66/mo.
- Climate carrying-cost: severe flood risk; major wind risk, 27% chance of damaging wind over 30y; extreme-heat days projected 7→17/yr by 2055 (HVAC capex compounding) — expect insurance premiums to compound above CPI over the hold.
Questions for the listing agent
- It's been on market 55 days. Have you received any prior offers? Is the seller open to a 3% concession, seller financing, or rate buy-down credit?
- Built in 1962 — when were the roof, HVAC, electrical panel, plumbing, and water heater last replaced?
- What's the actual annual flood-insurance premium (NFIP or private), and is the property in a SFHA with mandatory coverage?
- Is there a deadline driving the sale (1031 exchange, divorce, estate, relocation)? That informs how much negotiation room exists.
- Schools are D-rated, which usually means shorter tenancies and higher turnover. Who's the typical renter profile here, and what's been the actual vacancy rate?
- Crime grade is F in this area — have there been break-ins, vandalism, or insurance claims at this property in the last 3 years? What carrier currently insures it and at what premium?
- What's the average days-on-market for RENTAL listings here right now (not sales)? A rising rental-DOM trend means longer vacancies and softer asking-rent achievability than the comps imply.
- What's the recent tenant-quality profile in this submarket — average credit score on applications, eviction rate, late-payment / NSF rate, and stable-employment percentage? A property-management company in the area should have these aggregated.
- How much new for-sale + rental construction is in the pipeline within 1–3 miles? Heavy new supply typically softens prices + rents 12–24 months out; constrained supply supports both.
Investment metrics
- 1% rule
- 1.09% ✓
- Cap rate
- 9.34%
- Cash-on-cash
- 10.87%
- DSCR
- 1.48
- GRM
- 7.7
CMA / ARV
- ARV (on-the-fly)
- $230,958
- Comps found
- 1
Show comp detail 1 sale within ~0.75 mi
| Address | Dist | Beds/Ba | Sqft | Sold | Price | $/sf | Match |
|---|---|---|---|---|---|---|---|
| 616 Chicago Ave | 0.05mi | 2/1.0 | 705 (+0%) | 21mo | $231,600 | $329 | 79 |
Match score weights: distance 35% · size 25% · config 20% · recency 20%. Top-matched comps best support the ARV.
Projected returns pro-forma
-3.0% appreciation · 1.8% rent growth · sell at horizon
- IRR
- -3.0%
- Equity multiple
- 0.89×
- Total profit
- $-7,522
- Equity at exit
- $35,785
- IRR
- 5.4%
- Equity multiple
- 1.38×
- Total profit
- $25,250
- Equity at exit
- $20,751
Cash invested: $67,200 (down + closing). Projections, not guarantees.
Landlord ↔ Tenant lean methodology
- Overall (STATE)
- 85 Strongly Landlord-Friendly
- State North Carolina
- 85 Strongly Landlord-Friendly · R+3
- County
- — inherits STATE
- City
- — inherits STATE
ZIP-level market 28203
- Rents YoY
- 1.8%
- Active inventory
- 132
- Price-to-rent
- 7.7×
Monthly cashflow live
- Estimated rent
- $2,610 high interval (Pro) →
- Mortgage (P&I)
- −$1,259
- Tax from tax record
- −$95 /mo · $1,134/yr
- Insurance
- −$100
- Flood insurance flood zone
- −$66 /mo · $798/yr
- HOA
- −$0
- Vacancy / Maint / Mgmt
- −$548
- Net cashflow
- $542
Break-even live
UW: 25.0% down · 7.5% · 30yr · 1.5% tax · 5.0% vac · 8.0% maint · 8.0% mgmt
Financing live
Cash to close
- Down payment
- $60,000
- Closing costs
- $7,200
- Reserves months
- —
- Total cash needed
- —
Loan-product check · same deal, 3 products live
Conventional
25% down · 7.5% · 30yr
- Down + closing
- —
- Monthly P&I
- —
- Monthly cashflow
- —
- DSCR
- —
- Eligible?
- —
Personal DTI + credit; lowest rate.
DSCR
20% down · 8.5% · 30yr
- Down + closing
- —
- Monthly P&I
- —
- Monthly cashflow
- —
- DSCR
- —
- Eligible?
- —
No personal income docs; deal must DSCR.
Hard money
10% down · 12.0% · 12mo
- Down + closing
- —
- Monthly P&I
- —
- Monthly cashflow
- —
- DSCR
- —
- Eligible?
- —
Short-term bridge; refi at stabilization.
Rent comps 40 comps
| Address | Beds | Baths | Sqft | Rent | $/sqft | DOM | Units | Dist |
|---|---|---|---|---|---|---|---|---|
| 2120 Dunavant St Charlotte, NC | 3.0 | 1.0–2.0 | 1044 | $3,553 | $3.40 | 3d | 33 | 0.41mi |
| 704 W Tremont Ave Charlotte, NC | 3.0 | 1.0–2.0 | 936 | $2,679 | $2.86 | 1d | 9 | 0.42mi |
| 2200 Dunavant St Charlotte, NC | 1.0–2.0 | 1.0–2.0 | 894 | $3,403 | $3.80 | 1d | 27 | 0.46mi |
| 536 W Tremont Ave Charlotte, NC | 2.0 | 1.0–2.0 | 953 | $3,196 | $3.35 | 2d | 18 | 0.47mi |
| 2250 Hawkins St Charlotte, NC | 3.0 | 1.0–3.0 | 1480 | $3,048 | $2.06 | 2d | 1 | 0.48mi |
| 205 Foster Ave Charlotte, NC | 4.0 | 1.0–2.0 | 641 | $2,982 | $4.65 | 2d | 36 | 0.49mi |
| 421 W Tremont Ave Charlotte, NC | 3.0 | 1.0–2.0 | 893 | $3,173 | $3.55 | 2d | 29 | 0.49mi |
| 2630 South Blvd Charlotte, NC | 3.0 | 1.0–2.0 | 1072 | $3,117 | $2.91 | 1d | 25 | 0.51mi |
| 2720 South Blvd Charlotte, NC | 2.0 | 1.0–2.0 | 827 | $2,628 | $3.18 | 1d | 38 | 0.52mi |
| 2520 South Blvd Charlotte, NC | 2.0 | 1.0–2.0 | 822 | $2,757 | $3.35 | 3d | 24 | 0.52mi |
| 1504 Mainline Blvd Charlotte, NC | 1.0 | 1.0–2.0 | 862 | $2,120 | $2.46 | 2d | 16 | 0.53mi |
| 2408 South Blvd Charlotte, NC | 2.0 | 1.0–2.0 | 836 | $3,265 | $3.90 | 2d | 14 | 0.54mi |
| 3310 S Tryon St Charlotte, NC | 1.0–3.0 | 1.0–2.0 | 1045 | $2,170 | $2.08 | 2d | 16 | 0.58mi |
| 2225 Hawkins St Charlotte, NC | 2.0 | 1.0–2.0 | 988 | $2,883 | $2.92 | 1d | 14 | 0.59mi |
| 452 New Bern Station Ct #452 Charlotte, NC | 1.0 | 1.0 | 693 | $1,550 | $2.24 | 24d | 1 | 0.59mi |
| 2300 South Blvd Charlotte, NC | 2.0 | 1.0–2.0 | 943 | $2,969 | $3.15 | 1d | 15 | 0.63mi |
| 2705 Haverford Pl Charlotte, NC | 2.0 | 1.0–2.0 | 967 | $3,134 | $3.24 | 1d | 14 | 0.65mi |
| 335 Doggett St Charlotte, NC | 3.0 | 1.0–2.0 | 864 | $2,208 | $2.56 | 2d | 1 | 0.66mi |
| 2161 Hawkins St Charlotte, NC | 3.0 | 1.0–3.0 | 1284 | $6,751 | $5.26 | 1d | 21 | 0.66mi |
| 3405 S Tryon St Charlotte, NC | 1.0–3.0 | 1.0–2.0 | 1056 | $2,208 | $2.09 | 2d | 66 | 0.67mi |
| 2100 South Blvd Charlotte, NC | 2.0 | 1.0–2.0 | 876 | $3,583 | $4.09 | 3d | 24 | 0.76mi |
| 3305 South Blvd Charlotte, NC | 2.0 | 1.0–2.5 | 945 | $3,665 | $3.88 | 3d | 19 | 0.77mi |
| 2125 Southend Dr Charlotte, NC | 1.0 | 1.0 | 672 | $1,762 | $2.62 | 14d | 5 | 0.80mi |
| 2025 Cleveland Ave Charlotte, NC | 1.0–3.0 | 1.0–3.0 | 1242 | $4,922 | $3.96 | 2d | 27 | 0.85mi |
| 3615 Tryclan Dr Charlotte, NC | 2.0 | 1.0–2.0 | 993 | $3,528 | $3.55 | 1d | 31 | 0.85mi |
| 1822 Merriman Ave Unit C Charlotte, NC | 2.0 | 1.0 | 700 | $1,350 | $1.93 | 24d | 1 | 0.87mi |
| 2210 Sumner Green Ave Unit H Charlotte, NC | 1.0 | 1.0 | 557 | $1,650 | $2.96 | 16d | 1 | 0.88mi |
| 3441 South Blvd Charlotte, NC | 2.0 | 1.0–2.0 | 868 | $2,470 | $2.84 | 1d | 9 | 0.88mi |
| 1701 West Blvd Unit E7 Charlotte, NC | 1.0 | 1.0 | 584 | $1,010 | $1.73 | 24d | 1 | 0.90mi |
| 222 West Blvd Charlotte, NC | 2.0 | 1.0–2.0 | 628 | $2,515 | $4.00 | 2d | 11 | 0.91mi |
| 2005 Empire St Charlotte, NC | 2.0 | 1.0–2.0 | 875 | $2,439 | $2.79 | 5d | 104 | 0.91mi |
| 120 Hollis Rd Charlotte, NC | 3.0 | 1.0–3.0 | 1155 | $2,946 | $2.55 | 2d | 28 | 0.97mi |
| 1613 S Mint St Unit C Charlotte, NC | 1.0 | 1.0 | 550 | $2,750 | $5.00 | 24d | 1 | 0.97mi |
| 1701 Remount Rd Charlotte, NC | 1.0 | 1.0 | 525 | $950 | $1.81 | 24d | 1 | 0.98mi |
| 1750 Camden Rd Charlotte, NC | 2.0 | 1.0–2.0 | 782 | $2,629 | $3.36 | 2d | 20 | 0.99mi |
| 4015 Craft St Charlotte, NC | 1.0 | 1.0 | 662 | $2,128 | $3.21 | 20d | 1 | 1.00mi |
| 124 E Kingston Ave Charlotte, NC | 2.0 | 1.0–2.0 | 931 | $5,136 | $5.51 | 2d | 25 | 1.05mi |
| 125 W Park Ave Charlotte, NC | 1.0 | 1.0–1.5 | 817 | $2,480 | $3.03 | 3d | 4 | 1.06mi |
| 2145 Kirkwood Ave #1 Charlotte, NC | 1.0 | 1.0 | 592 | $1,575 | $2.66 | 5d | 1 | 1.23mi |
| 1449 S Church St Charlotte, NC | 2.0 | 1.0–2.0 | 857 | $2,596 | $3.03 | 2d | 16 | 1.24mi |
Listing history 15 events
-
2026-06-18days on market $240,000 Active 55 DOM
-
2026-06-17days on market $240,000 Active 54 DOM
-
2026-06-16days on market $240,000 Active 53 DOM
-
2026-06-15days on market $240,000 Active 52 DOM
-
2026-06-13days on market $240,000 Active 50 DOM
-
2026-06-09days on market $240,000 Active 46 DOM
-
2026-06-08days on market $240,000 Active 45 DOM
-
2026-06-07days on market $240,000 Active 44 DOM
-
2026-06-04days on market $240,000 Active 41 DOM
-
2026-06-03days on market $240,000 Active 40 DOM
-
2026-06-02days on market $240,000 Active 39 DOM
-
2026-06-02days on market $240,000 Active 38 DOM
-
2026-05-31days on market $240,000 Active 37 DOM
-
2026-04-24$240,000 Active
-
1978-09-01soldstatus $16,000
ⓘ Source: listings_history table (triggers on properties + properties_extension) + one-shot
backfill from property_details.listing_events for pre-trigger history.
Tax reassessment forecast NC · Resets to sale price
- Current annual tax
- $1,134 · $95/mo
- Projected year-2 tax
- $1,968 · $164/mo
- Expected delta
- +$834/yr (+$69/mo · 73.5%)
ⓘ Screening estimate from a state-policy table — verify with the county assessor before closing.
Climate risk First Street
- Flood 9/10 Extreme FEMA zone X (unshaded) · 99% chance over 30 yrs
- Wildfire 1/10 Low
- Heat 6/10 Major 7 d/yr ≥104°F today · 17 d/yr by 30 yrs out
- Wind 6/10 Major 27% chance of damaging wind over 30 yrs
- Air quality 3/10 Moderate 3 unhealthy d/yr today · 4 by 30 yrs out
Nearby sold comps map
Loading sold comps map…
Walkable amenities ~0.75 mi
Loading nearby amenities…
Taxation est. · year 1
- Rental income
- $31,317
- − Mortgage interest
- −$13,444
- − Property taxes
- −$1,134
- − Insurance
- −$1,997
- − Repairs & maintenance
- −$2,505
- − Management
- −$2,505
- − Depreciation
- −$6,982
- Taxable income
- $2,749
- Est. tax owed @ 24.0%
- −$660
- After-tax cash flow
- $5,846/yr
For passive investors: Depreciation is non-cash, so a rental often shows a tax loss while cash-flowing — sheltering income. Rental losses are passive: they offset passive income freely, and up to $25,000/yr can offset ordinary (W-2) income if you actively participate and your MAGI is under $100k (phasing out to $0 by $150k); unused losses carry forward. On sale, claimed depreciation is recaptured at up to 25%, and gains may owe capital-gains tax (a 1031 exchange can defer both). Figures are a year-1 estimate at your 24.0% rate — not tax advice; consult a CPA.
Schools (NCES district)
- District
- Charlotte-Mecklenburg Schools
- NCES district ID
- 3702970
- Math proficiency
- 42% ▼ -6.00%
- Reading proficiency
- 46% ▲ 1.00%
- Median HH income
- $57,175
- Composite
- 38.49/100
- National rank
- #4183
- State rank
- #85 of 178 in NC
Livability — Charlotte
- Score
- 78/100
- State rank
- #26
- US rank
- #2502
Category grades
Schools grade is shown separately in the Schools card above.
Census & demographics
- Census place
- Charlotte, NC
- County
- Mecklenburg County · 1,167,319 people
- City population
- 920,422
- Metro
- Charlotte-Concord-Gastonia, NC-SC
- Population (ZIP)
- 18,823
- Household income
- $104,696
- Rent vs Own
- Severe rent burden
- 1101.0
Population outlook (Mecklenburg County) Hauer SSP2
- Today (2025)
- 1,305,740 people
- By 2030
- 1,442,752 · +10.5%
- By 2040
- 1,722,441 · +31.9%
- By 2050
- 1,999,450 · +53.1%
- By 2075
- 2,642,495 · +102.4%
- By 2100
- 3,106,755 · +137.9%
Race, ethnicity, and origin ACS 2023
- Neighborhood character
- Predominantly White (78%)
- Race & ethnicity
- White 78% Black 10% Two or more races 5% Hispanic / Latino 5% Asian 4%
- Common ancestry
- Romanian 3% Slovak 3% Serbian 2%
- Foreign-born
- 7% · Canada, Vietnam, China
- Languages at home
- 93% English-only · Spanish 3% Other Indo-European 1% German/W. Germanic 1%
Political lean MEDSL · Mecklenburg
- 2024 margin
- Solid D (+32.9) · D 65.6% · R 32.7% · Other 1.6%
- 2008→2024 swing
- +8.5pp toward D · 2008: 24.4pp · 2024: 32.9pp
- All cycles
- 2024: D+32.9 2020: D+35.1 2016: D+29.9 2012: D+22.5 2008: D+24.4
Not yet ingested
- Civics
- —
Market trends
- HPI YoY
- ▼ -1410.28%
- Current HPI
- 327.5818
- Rent YoY
- ▲ 1.80%
- Metro
- Charlotte-Concord-Gastonia, NC-SC
- State GDP YoY
- ▲ 3.28%
- F500 in state
- 26
Industry mix (Fortune 500 HQ in NC)
| Industry | F500 HQs | Revenue |
|---|---|---|
| Financial Services | 2 | $213B |
|
||
| Retail | 2 | $95B |
|
||
| Industrial Conglomerate | 1 | $38B |
|
||
| Metals / Steel | 1 | $35B |
|
||
| Utilities | 1 | $30B |
|
||
| Industrial Machinery | 1 | $19B |
|
||
Price history
+1400.0% since first listed2 events — show timeline
- 2026-04-24 Listed $240,000 CANOPYMLS as Distributed by MLS Grid
- 1978-09-01 Sold (Public Records) $16,000 Public Records
Property tax history
+4.0%/yrLatest (2025): $1,134 · +48.0% YoY. Source: county tax records.
Cash-flow waterfall
monthlySold comps — $/sqft
last 12 mo · ≤1 miLoading sold comps…