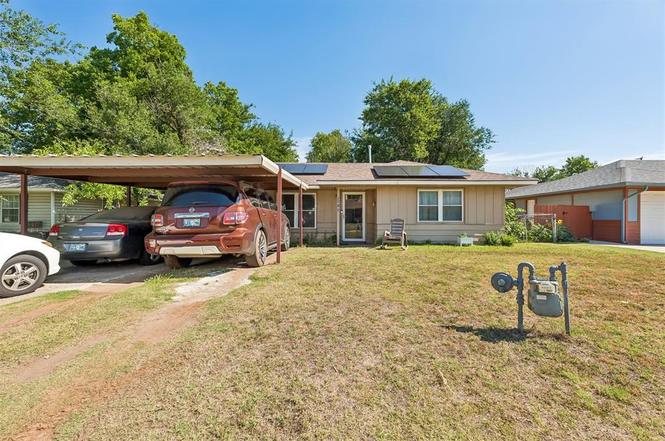
5413 NW 45th St · Warr Acres, OK
Flood risk 1/10 · Minimal
- FEMA flood zone
- X (unshaded)
- Chance of flooding over 30 yrs
- 0.0%
- Est. flood insurance / yr
- $507 – $1,088
Fire risk 1/10 · Minimal
- Est. fire insurance / yr
- $2,463 – $4,575
Heat risk 5/10 · Moderate
- Hot days now (above 107°F)
- 7 days/yr
- Hot days in 30 yrs
- 19 days/yr
Wind risk 2/10 · Minimal
- Chance of severe wind over 30 yrs
- 3.0%
Air-quality risk 2/10 · Minimal
- Unhealthy air days now
- 1 days/yr
- Unhealthy air days in 30 yrs
- 2 days/yr
Risk factors via First Street. Map © Google.
Why this score? — see what drove the C grade
The composite is a weighted blend of 9 inputs, each scored 0–100. Each bar is that input's sub-score; the figure is the points it added to the 100-point composite (weight × sub-score).
- Cash flow +22.2/30.0
- ARV discount +15.0/15.0
- DSCR +7.1/10.0
- 1% rule +5.4/10.0
- Livability +3.5/5.0
- Rent growth +2.7/5.0
- Condition / age +2.5/5.0
- Schools +1.3/10.0
- Appreciation +0.0/10.0
$150,000
🖨 Deal sheet (PDF) 📄 Offer letter ✓ Due diligence
Listing remarks MLS
Totally remodeled/Move-in 4bed/2bath home in Warr Acres. Kitchen has travertine dry-stacked backsplash, built-in stainless steel Fridgaire Gallery appliances (convection oven), 3cm granite countertops, and new cabinets. Fresh paint and carpet! Master bedroom has a huge walk in close, walk-in shower with overhead spout, and granite in the bathrooms as well. 4th bedroom could be a flex study. 2 HUGE living areas! Outside is beautifully landscaped.
Key facts
- 8,699 sq ft lot
- Built 1950
- Listed 2 days
Property features AI
Finance
- Other: No storm shelter; Property located in Mager Sub Add
- Financial info: Loan qualification allowed; Not assumable
- HOA & community: No mandatory association dues
Exterior
- Home design: Single family residence; One level; Residential property
- Construction: Frame construction; Composition roof; Slab foundation; Existing property
- Exterior features: Interior lot
Interior
- Bedrooms: 4 bedrooms
- Bathrooms: 2 full bathrooms
- Interior features: One living area; No fireplace; Storage available
Neighborhood map
What this means for you Summary
Snapshot
- This is a 4-bed/2.0-bath single-family listed at $150k.
Deal economics
- At list price, monthly cash flow is $245 ($3k/yr) — positive.
- The deal already cash-flows at list — no discount required.
- Meets the 1% rule at list price ($2k rent vs $150k).
- Cap rate 8.3% vs local median 5.0% in Warr Acres — top-decile yield for the area; either an underpriced asset or a hidden risk that comps aren't pricing in. Stress-test before assuming the spread holds.
Location & tenants
- Location reads 70/100 on livability (#35 in OK) — a middle-class / working-renter tenant base. Strengths: cost of living A+, housing A+, health & safety A-; Watch: employment C-, crime F, amenities F.
- Putnam City (urban): math 12% / reading 16% proficiency, ranked #227 of 270 in OK (top 84%) — low school quality limits family demand, transient renter base, plan for 1-2y turnover; 65% free/reduced lunch — lower-income household profile, screen leases tightly.
- Zoned schools: Arbor Grove Es (math 6% / reading 12%, grade F, #735 of 845 statewide, top 87%, 519 students, 0% FRL); Putnam City Hs (math 12% / reading 23%, grade F, #307 of 447 statewide, top 69%, 2,014 students, 0% FRL) — zoned schools average 0% FRL vs 65% district-wide (65 pts lower); this property's tenant base skews higher-income than the district average.
- Market conditions: Rents flat; 48 active listings in the ZIP; 18 comparable units currently listed for rent nearby; rentals leasing fast (median 4d on market — plan ~1-2 weeks tenant-placement turnaround); 5,365 units permitted in Oklahoma County in 2024 (569 in 5+ unit buildings).
- This rent runs 37% of the median local income ($51k/yr) — at the standard rent-burdened threshold; future hikes will face affordability resistance.
Forward outlook
- Local home prices are declining (-3.0%/yr); year-one equity from $1k of loan paydown is wiped out by about $4k of value loss. Plan a longer hold.
- Oklahoma County population projected at +41% by 2050 — long-run rental-demand tailwind backs the buy-and-hold thesis.
Negotiation context
- Only 2 days on market — expect competitive offers; lowballing is unlikely to land.
- 2 sale attempts since 13y ago with the ask held roughly flat each time — persistent listings suggest the price (not the market) is what's stuck; bring a comps-based counter.
- Current owner paid $100k; 49% above their basis — modest negotiation headroom, anchor on the comps not their cost.
Risks & watch-outs
- Watch-outs: built in 1950 — expect roof / HVAC / electrical / plumbing capex.
- Climate carrying-cost: extreme-heat days projected 7→19/yr by 2055 (HVAC capex compounding) — expect insurance premiums to compound above CPI over the hold.
Questions for the listing agent
- Built in 1950 — when were the roof, HVAC, electrical panel, plumbing, and water heater last replaced?
- Is there a deadline driving the sale (1031 exchange, divorce, estate, relocation)? That informs how much negotiation room exists.
- Schools are F-rated, which usually means shorter tenancies and higher turnover. Who's the typical renter profile here, and what's been the actual vacancy rate?
- Crime grade is F in this area — have there been break-ins, vandalism, or insurance claims at this property in the last 3 years? What carrier currently insures it and at what premium?
- What's the average days-on-market for RENTAL listings here right now (not sales)? A rising rental-DOM trend means longer vacancies and softer asking-rent achievability than the comps imply.
- What's the recent tenant-quality profile in this submarket — average credit score on applications, eviction rate, late-payment / NSF rate, and stable-employment percentage? A property-management company in the area should have these aggregated.
- How much new for-sale + rental construction is in the pipeline within 1–3 miles? Heavy new supply typically softens prices + rents 12–24 months out; constrained supply supports both.
Investment metrics
- 1% rule
- 1.04% ✓
- Cap rate
- 8.25%
- Cash-on-cash
- 7.00%
- DSCR
- 1.31
- GRM
- 8.0
CMA / ARV
- ARV (on-the-fly)
- $201,478
- Comps found
- 12
Show comp detail 12 sales within ~0.75 mi
| Address | Dist | Beds/Ba | Sqft | Sold | Price | $/sf | Match |
|---|---|---|---|---|---|---|---|
| 5417 NW 45th Ter | 0.06mi | 3/1.0 (-1) | 1,480 (-4%) | 9mo | $175,000 | $118 | 74 |
| 5704 NW 45th St | 0.23mi | 4/2.0 | 1,379 (-10%) | 0mo | $195,000 | $141 | 72 |
| 4711 N Grove Ave | 0.27mi | 3/2.0 (-1) | 1,402 (-9%) | 2mo | $197,900 | $141 | 66 |
| 4125 N Reeder Ave | 0.33mi | 3/2.5 (-1) | 1,628 (+6%) | 6mo | $220,000 | $135 | 63 |
| 4232 N Libby Ave | 0.39mi | 4/2.0 | 1,712 (+11%) | 3mo | $200,000 | $117 | 61 |
| 5345 NW 44th St | 0.17mi | 3/1.5 (-1) | 1,348 (-12%) | 5mo | $150,000 | $111 | 60 |
| 5604 NW 37th St | 0.63mi | 3/2.0 (-1) | 1,432 (-7%) | 0mo | $229,000 | $160 | 54 |
| 4215 N Barr Ave | 0.34mi | 3/2.5 (-1) | 1,695 (+10%) | 12mo | $222,000 | $131 | 50 |
| 5800 NW 45th St | 0.34mi | 3/2.0 (-1) | 1,308 (-15%) | 5mo | $137,500 | $105 | 50 |
| 4520 NW 46th St | 0.47mi | 3/1.5 (-1) | 1,747 (+14%) | 1mo | $115,000 | $66 | 48 |
| 5812 NW 56th St | 0.72mi | 3/2.0 (-1) | 1,712 (+11%) | 9mo | $130,000 | $76 | 35 |
| 5620 NW 37th St | 0.64mi | 3/1.5 (-1) | 1,359 (-12%) | 12mo | $220,000 | $162 | 34 |
Match score weights: distance 35% · size 25% · config 20% · recency 20%. Top-matched comps best support the ARV.
Projected returns pro-forma
-3.0% appreciation · 0.73% rent growth · sell at horizon
- IRR
- -8.1%
- Equity multiple
- 0.71×
- Total profit
- $-12,212
- Equity at exit
- $22,365
- IRR
- -1.7%
- Equity multiple
- 0.90×
- Total profit
- $-4,281
- Equity at exit
- $12,969
Cash invested: $42,000 (down + closing). Projections, not guarantees.
Landlord ↔ Tenant lean methodology
- Overall (STATE)
- 83 Strongly Landlord-Friendly
- State Oklahoma
- 83 Strongly Landlord-Friendly · R+20
- County
- — inherits STATE
- City
- — inherits STATE
ZIP-level market 73122
- Home prices YoY
- -27.8%
- Rents YoY
- 0.7%
- Active inventory
- 48
- Price-to-rent
- 8.0×
Monthly cashflow live
- Estimated rent
- $1,566 high interval (Pro) →
- Mortgage (P&I)
- −$787
- Tax from tax record
- −$143 /mo · $1,720/yr
- Insurance
- −$62
- HOA
- −$0
- Vacancy / Maint / Mgmt
- −$329
- Net cashflow
- $245
Break-even live
Sensitivity live
| Price | -10% $330 | -5% $287 | +0% $245 | +5% $202 | +10% $160 |
|---|---|---|---|---|---|
| Rent | -10% $121 | -5% $183 | +0% $245 | +5% $307 | +10% $369 |
| Rate | -1.0pp $320 | -0.5pp $283 | base $245 | +0.5pp $206 | +1.0pp $166 |
UW: 25.0% down · 7.5% · 30yr · 1.5% tax · 5.0% vac · 8.0% maint · 8.0% mgmt
Financing live
Cash to close
- Down payment
- $37,500
- Closing costs
- $4,500
- Reserves months
- —
- Total cash needed
- —
Loan-product check · same deal, 3 products live
Conventional
25% down · 7.5% · 30yr
- Down + closing
- —
- Monthly P&I
- —
- Monthly cashflow
- —
- DSCR
- —
- Eligible?
- —
Personal DTI + credit; lowest rate.
DSCR
20% down · 8.5% · 30yr
- Down + closing
- —
- Monthly P&I
- —
- Monthly cashflow
- —
- DSCR
- —
- Eligible?
- —
No personal income docs; deal must DSCR.
Hard money
10% down · 12.0% · 12mo
- Down + closing
- —
- Monthly P&I
- —
- Monthly cashflow
- —
- DSCR
- —
- Eligible?
- —
Short-term bridge; refi at stabilization.
Rent comps 18 comps
| Address | Beds | Baths | Sqft | Rent | $/sqft | DOM | Units | Dist |
|---|---|---|---|---|---|---|---|---|
| 4401 N Ann Arbor Ave Warr Acres, OK | 3.0 | 1.0 | 1216 | $1,245 | $1.02 | 25d | 1 | 0.14mi |
| 4207 N Reeder Ave Oklahoma City, OK | 4.0 | 2.0 | 1954 | $2,015 | $1.03 | 3d | 1 | 0.33mi |
| 4608 N Libby Ave Warr Acres, OK | 4.0 | 2.0 | 1290 | $1,595 | $1.24 | 3d | 1 | 0.35mi |
| 4316 N Libby Ave Warr Acres, OK | 4.0 | 1.5 | 1377 | $1,650 | $1.20 | 25d | 1 | 0.38mi |
| 5304 Willow Cliff Rd Oklahoma City, OK | 3.0 | 3.0 | 1505 | $1,330 | $0.88 | 15d | 1 | 0.47mi |
| 4213 N Westridge St Oklahoma City, OK | 3.0 | 2.0 | 1474 | $1,295 | $0.88 | 4d | 1 | 0.50mi |
| 5107 N Hammond Ave Unit 5109D Warr Acres, OK | 3.0 | 2.0 | 1300 | $1,399 | $1.08 | 25d | 1 | 0.81mi |
| 4406 NW 54th St Oklahoma City, OK | 3.0 | 2.0 | 1710 | $1,495 | $0.87 | 25d | 1 | 0.85mi |
| 4206 N Donald Ave Bethany, OK | 3.0 | 1.5 | 1867 | $1,450 | $0.78 | 3d | 1 | 0.90mi |
| 3803 N Redmond Ave Bethany, OK | 3.0 | 2.0 | 1260 | $2,100 | $1.67 | 3d | 1 | 1.03mi |
| 4396 NW 36th St Oklahoma City, OK | 1.0–3.0 | 1.0–2.0 | 848 | $1,349 | $1.59 | 3d | 9 | 1.10mi |
| 5633 Norman Rd Warr Acres, OK | 3.0 | 2.0 | 1225 | $1,375 | $1.12 | 3d | 1 | 1.13mi |
| 6020 N Meridian Pl Oklahoma City, OK | 3.0 | 2.0 | 1580 | $1,550 | $0.98 | 13d | 1 | 1.14mi |
| 5212 Oakwood Villas Ct Bethany, OK | 3.0 | 2.0 | 1200 | $1,350 | $1.12 | 3d | 1 | 1.22mi |
| 4425 NW 31st St Oklahoma City, OK | 3.0 | 1.5 | 1222 | $1,500 | $1.23 | 25d | 1 | 1.24mi |
| 5929 NW 62nd St Oklahoma City, OK | 3.0 | 1.0 | 1103 | $1,550 | $1.41 | 3d | 1 | 1.29mi |
| 6505 Cherokee Dr Warr Acres, OK | 3.0 | 1.5 | 1455 | $1,390 | $0.96 | 3d | 1 | 1.42mi |
| 5111 N Dawson Dr Bethany, OK | 4.0 | 2.0 | 1451 | $1,600 | $1.10 | 25d | 1 | 1.45mi |
Listing history 3 events
-
2026-06-21statusdays on market $150,000 Pending 2 DOM
-
2026-06-17remarks 611-char remark
-
2026-06-17$150,000 Active 1 DOM
ⓘ Source: listings_history table (triggers on properties + properties_extension) + one-shot
backfill from property_details.listing_events for pre-trigger history.
Tax reassessment forecast OK · Resets to sale price
- Current annual tax
- $1,720 · $143/mo
- Projected year-2 tax
- $1,720 · $143/mo
- Expected delta
- $0/yr ($0/mo · 0.0%)
ⓘ Screening estimate from a state-policy table — verify with the county assessor before closing.
Climate risk First Street
- Flood 1/10 Low FEMA zone X (unshaded) · 0% chance over 30 yrs
- Wildfire 1/10 Low
- Heat 5/10 Major 7 d/yr ≥107°F today · 19 d/yr by 30 yrs out
- Wind 2/10 Low 3% chance of damaging wind over 30 yrs
- Air quality 2/10 Low 1 unhealthy d/yr today · 2 by 30 yrs out
Nearby sold comps map
Loading sold comps map…
Walkable amenities ~0.75 mi
Loading nearby amenities…
Taxation est. · year 1
- Rental income
- $18,795
- − Mortgage interest
- −$8,402
- − Property taxes
- −$1,720
- − Insurance
- −$750
- − Repairs & maintenance
- −$1,504
- − Management
- −$1,504
- − Depreciation
- −$4,364
- Taxable income
- $552
- Est. tax owed @ 24.0%
- −$132
- After-tax cash flow
- $2,806/yr
For passive investors: Depreciation is non-cash, so a rental often shows a tax loss while cash-flowing — sheltering income. Rental losses are passive: they offset passive income freely, and up to $25,000/yr can offset ordinary (W-2) income if you actively participate and your MAGI is under $100k (phasing out to $0 by $150k); unused losses carry forward. On sale, claimed depreciation is recaptured at up to 25%, and gains may owe capital-gains tax (a 1031 exchange can defer both). Figures are a year-1 estimate at your 24.0% rate — not tax advice; consult a CPA.
Schools (NCES district)
- District
- Putnam City
- NCES district ID
- 4025290
- Math proficiency
- 12% ▼ -18.00%
- Reading proficiency
- 16% ▼ -14.00%
- Median HH income
- $46,657
- Composite
- 12.61/100
- National rank
- #9614
- State rank
- #227 of 270 in OK
Livability — Warr Acres
- Score
- 70/100
- State rank
- #35
- US rank
- #7446
Category grades
Schools grade is shown separately in the Schools card above.
Census & demographics
- Census place
- Warr Acres, OK
- County
- Oklahoma County · 771,644 people
- City population
- 12,635
- Metro
- Oklahoma City, OK
- Population (ZIP)
- 12,635
- Household income
- $51,227
- Rent vs Own
- Severe rent burden
- 826.0
Population outlook (Oklahoma County) Hauer SSP2
- Today (2025)
- 911,875 people
- By 2030
- 982,413 · +7.7%
- By 2040
- 1,130,468 · +24.0%
- By 2050
- 1,288,422 · +41.3%
- By 2075
- 1,711,482 · +87.7%
- By 2100
- 2,088,448 · +129.0%
Race, ethnicity, and origin ACS 2023
- Neighborhood character
- Diverse neighborhood (Simpson 0.69)
- Race & ethnicity
- White 45% Hispanic / Latino 30% Two or more races 21% Black 14% Native American 2% Asian 2%
- Hispanic origin (detail)
- Mexican 21%
- Common ancestry
- Slovak 2% Iranian 1% Italian 1%
- Foreign-born
- 16% · Canada, Vietnam, Philippines
- Languages at home
- 75% English-only · Spanish 23% Other Indo-European 1% Vietnamese 1%
Political lean MEDSL · Oklahoma
- 2024 margin
- Toss-up / Even · D 48.0% · R 49.7% · Other 2.3%
- 2008→2024 swing
- +15.1pp toward D · 2008: -16.8pp · 2024: -1.7pp
- All cycles
- 2024: R+1.7 2020: R+1.1 2016: R+10.5 2012: R+16.7 2008: R+16.8
Not yet ingested
- Civics
- —
Market trends
- HPI YoY
- ▼ -96.26%
- Current HPI
- 249.485
- Rent YoY
- ▲ 0.73%
- Metro
- Oklahoma City, OK
- State GDP YoY
- ▲ 1.55%
- F500 in state
- 6
Industry mix (Fortune 500 HQ in OK)
| Industry | F500 HQs | Revenue |
|---|---|---|
| Energy | 3 | $48B |
|
||
Price history
+512.2% since first listed5 events — show timeline
- 2026-06-17 Listed $150,000 MLSOK
- 2013-10-18 Sold (Public Records) $100,500 Public Records
- 2013-10-16 Sold (MLS) $100,400 MLSOK
- 2013-08-06 Listed $99,900 MLSOK
- 1989-05-16 Sold (Public Records) $24,500 Public Records
Property tax history
+3.6%/yrLatest (2025): $1,720 · -2.0% YoY. Source: county tax records.
Cash-flow waterfall
monthlySold comps — $/sqft
last 12 mo · ≤1 miLoading sold comps…