205 N State Highway 101 · Chico, TX
Flood risk 1/10 · Minimal
- FEMA flood zone
- X (unshaded)
- Chance of flooding over 30 yrs
- 0.0%
- Est. flood insurance / yr
- $507 – $1,088
Fire risk 6/10 · Moderate
- Est. fire insurance / yr
- $1,222 – $2,270
Heat risk 7/10 · Major
- Hot days now (above 110°F)
- 7 days/yr
- Hot days in 30 yrs
- 21 days/yr
Wind risk 4/10 · Minor
- Chance of severe wind over 30 yrs
- 16.0%
Air-quality risk 2/10 · Minimal
- Unhealthy air days now
- 1 days/yr
- Unhealthy air days in 30 yrs
- 2 days/yr
Risk factors via First Street. Map © Google.
Why this score? — see what drove the D+ grade
The composite is a weighted blend of 9 inputs, each scored 0–100. Each bar is that input's sub-score; the figure is the points it added to the 100-point composite (weight × sub-score).
- Cash flow +16.2/30.0
- ARV discount +10.9/15.0
- DSCR +5.0/10.0
- 1% rule +4.1/10.0
- Schools +3.4/10.0
- Livability +3.4/5.0
- Rent growth +2.5/5.0
- Condition / age +2.5/5.0
- Appreciation +0.0/10.0
$165,000
🖨 Deal sheet (PDF) 📄 Offer letter ✓ Due diligence
Listing remarks
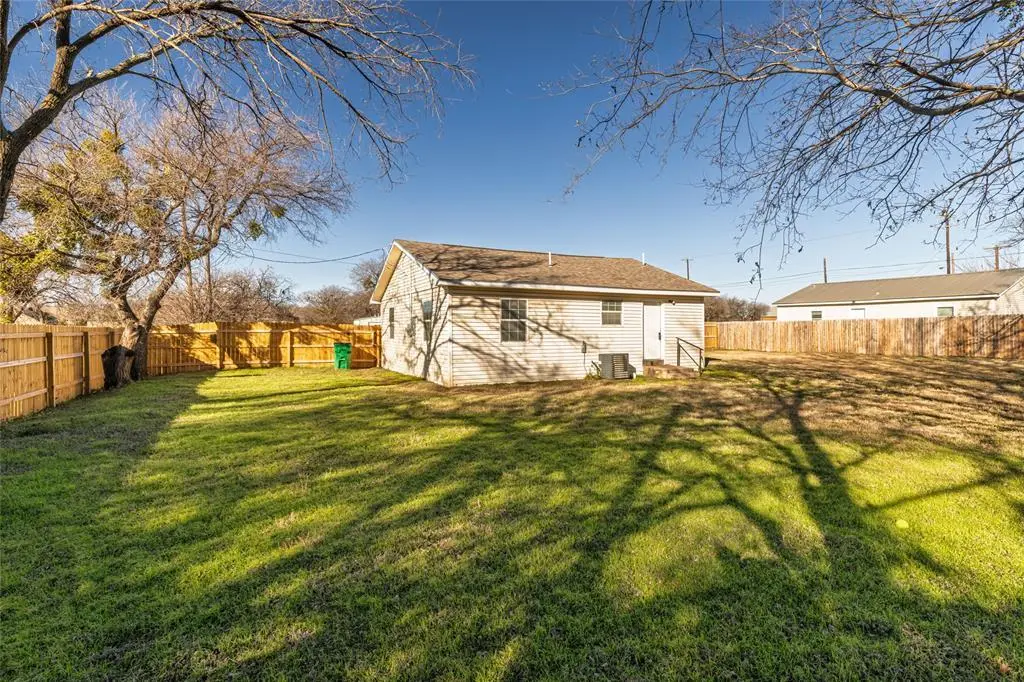
Sweet, charming, and full of potential! This beautifully updated 2-bedroom, 1-bath property offers the rare flexibility of possible residential or commercial use in a great Enterprise location. Remodeled in 2021, updates include flooring, windows, roof, kitchen countertops with a granite-look finish, and a new stove. The spacious backyard features a new fence and offers a lovely outdoor area for relaxing, entertaining, or business use. A wonderful opportunity to live, work, or invest in one versatile property. Owner will consider owner financing with $20,000 down. Buyer to verify use and zoning if considering commercial use.
Key facts
- Versatile property
- Remodeled in 2021
- New fence
Tags
Property features AI
Finance
- Financial info: Treat as clear loan type; No second mortgage indicated
- HOA & community: No homeowners association
Exterior
- Parking: Additional parking (no covered or carport spaces listed)
- Utilities: City water; City sewer; Cable available
- Home design: Single-family residence; One story; Residential property
- Construction: Built in 1930; Vinyl siding and wood construction
- Exterior features: Wood fencing; Less than 0.5-acre lot (approximately 0.21 acre)
Interior
- Kitchen: Electric oven
- Bedrooms: 2 bedrooms (both on the main level)
- Bathrooms: 1 full bathroom
- Heating & cooling: Electric heating; Electric cooling
- Interior features: Cable TV available; High-speed internet available; Three total rooms (living area plus dining area)
Neighborhood map
What this means for you Summary
Snapshot
- This is a 2-bed/1.0-bath single-family listed at $165k.
Deal economics
- At list price, monthly cash flow is $88 ($1k/yr) — positive.
- The deal already cash-flows at list — no discount required.
- To meet the 1% rule (rent ≥ 1% of price), the offer needs to be $149k (9.4% below list).
- Recommended offer: $149k (9.4% below list) — sets the bar for 1% rule.
- Cap rate 6.9% vs local median 2.7% in Chico — top-decile yield for the area; either an underpriced asset or a hidden risk that comps aren't pricing in. Stress-test before assuming the spread holds.
Location & tenants
- Location reads 68/100 on livability (#508 in TX) — a middle-class / working-renter tenant base. Strengths: cost of living A+, housing A+, crime A; Watch: health & safety C-, employment D+, amenities F.
- Chico ISD (rural): math 38% / reading 41% proficiency, ranked #424 of 826 in TX (top 51%) — families likely to look elsewhere, expect single-tenant / working-renter base with shorter leases.
- Zoned schools: Chico El (math 37% / reading 42%, grade F, #1,545 of 4,322 statewide, top 38%, 263 students, 57% FRL); Chico Middle (math 42% / reading 37%, grade F, #660 of 1,662 statewide, top 41%, 131 students, 59% FRL); Chico H S (math 34% / reading 54%, grade F, #652 of 1,632 statewide, top 43%, 155 students, 53% FRL) — zoned schools at 56% FRL track the district average.
- Market conditions: 136 active listings in the ZIP; 460 units permitted in Wise County in 2024 (243 in 5+ unit buildings).
Forward outlook
- Local home prices are declining (-3.0%/yr); year-one equity from $1k of loan paydown is wiped out by about $5k of value loss. Plan a longer hold.
- Wise County population projected at +27% by 2050 — long-run rental-demand tailwind backs the buy-and-hold thesis.
Negotiation context
- It's been on market 34 days — a 3% lower offer ($160k) is reasonable based on typical stale-listing flexibility.
- 3 sale attempts with the ask held roughly flat each time — persistent listings suggest the price (not the market) is what's stuck; bring a comps-based counter.
Risks & watch-outs
- Watch-outs: built in 1930 — expect roof / HVAC / electrical / plumbing capex.
- Climate carrying-cost: major wildfire risk; extreme-heat days projected 7→21/yr by 2055 (HVAC capex compounding) — expect insurance premiums to compound above CPI over the hold.
Questions for the listing agent
- It's been on market 34 days. Have you received any prior offers? Is the seller open to a 9% concession, seller financing, or rate buy-down credit?
- Built in 1930 — when were the roof, HVAC, electrical panel, plumbing, and water heater last replaced?
- Is there a deadline driving the sale (1031 exchange, divorce, estate, relocation)? That informs how much negotiation room exists.
- Schools are D-rated, which usually means shorter tenancies and higher turnover. Who's the typical renter profile here, and what's been the actual vacancy rate?
- The area grade is low — what's the realistic commute time and amenity access for the typical tenant pool here? Any planned neighborhood developments (good or bad) we should know about?
- What's the average days-on-market for RENTAL listings here right now (not sales)? A rising rental-DOM trend means longer vacancies and softer asking-rent achievability than the comps imply.
- What's the recent tenant-quality profile in this submarket — average credit score on applications, eviction rate, late-payment / NSF rate, and stable-employment percentage? A property-management company in the area should have these aggregated.
- How much new for-sale + rental construction is in the pipeline within 1–3 miles? Heavy new supply typically softens prices + rents 12–24 months out; constrained supply supports both.
Investment metrics
- 1% rule
- 0.91% ✗
- Cap rate
- 6.93%
- Cash-on-cash
- 2.28%
- DSCR
- 1.10
- GRM
- 9.2
CMA / ARV
- ARV (on-the-fly)
- $178,304
- Comps found
- 3
Show comp detail 3 sales within ~0.75 mi
| Address | Dist | Beds/Ba | Sqft | Sold | Price | $/sf | Match |
|---|---|---|---|---|---|---|---|
| 201 N Mount St | 0.14mi | 2/1.0 | 784 (-12%) | 12mo | $99,500 | $127 | 63 |
| 204 Walnut St | 0.30mi | 2/1.0 | 826 (-8%) | 18mo | $195,000 | $236 | 58 |
| 307 W Decatur St | 0.45mi | 2/1.0 | 780 (-13%) | 20mo | $155,000 | $199 | 40 |
Match score weights: distance 35% · size 25% · config 20% · recency 20%. Top-matched comps best support the ARV.
Projected returns pro-forma
-3.0% appreciation · 3.0% rent growth · sell at horizon
- IRR
- -12.7%
- Equity multiple
- 0.54×
- Total profit
- $-21,163
- Equity at exit
- $24,602
- IRR
- -3.7%
- Equity multiple
- 0.76×
- Total profit
- $-11,268
- Equity at exit
- $14,266
Cash invested: $46,200 (down + closing). Projections, not guarantees.
Landlord ↔ Tenant lean methodology
- Overall (STATE)
- 87 Strongly Landlord-Friendly
- State Texas
- 87 Strongly Landlord-Friendly · R+5
- County
- — inherits STATE
- City
- — inherits STATE
ZIP-level market 76431
- Home prices YoY
- -13.1%
- Active inventory
- 136
- Price-to-rent
- 9.2×
Monthly cashflow live
- Estimated rent
- $1,494 medium interval (Pro) →
- Mortgage (P&I)
- −$865
- Tax from tax record
- −$159 /mo · $1,906/yr
- Insurance
- −$69
- HOA
- −$0
- Vacancy / Maint / Mgmt
- −$314
- Net cashflow
- $88
Break-even live
Sensitivity live
| Price | -10% $181 | -5% $134 | +0% $88 | +5% $41 | +10% $-6 |
|---|---|---|---|---|---|
| Rent | -10% $-30 | -5% $29 | +0% $88 | +5% $147 | +10% $206 |
| Rate | -1.0pp $171 | -0.5pp $130 | base $88 | +0.5pp $45 | +1.0pp $1 |
UW: 25.0% down · 7.5% · 30yr · 1.5% tax · 5.0% vac · 8.0% maint · 8.0% mgmt
Financing live
Cash to close
- Down payment
- $41,250
- Closing costs
- $4,950
- Reserves months
- —
- Total cash needed
- —
Loan-product check · same deal, 3 products live
Conventional
25% down · 7.5% · 30yr
- Down + closing
- —
- Monthly P&I
- —
- Monthly cashflow
- —
- DSCR
- —
- Eligible?
- —
Personal DTI + credit; lowest rate.
DSCR
20% down · 8.5% · 30yr
- Down + closing
- —
- Monthly P&I
- —
- Monthly cashflow
- —
- DSCR
- —
- Eligible?
- —
No personal income docs; deal must DSCR.
Hard money
10% down · 12.0% · 12mo
- Down + closing
- —
- Monthly P&I
- —
- Monthly cashflow
- —
- DSCR
- —
- Eligible?
- —
Short-term bridge; refi at stabilization.
Listing history 22 events
-
2026-06-21days on market $165,000 Active 34 DOM
-
2026-06-18days on market $165,000 Active 31 DOM
-
2026-06-17days on market $165,000 Active 30 DOM
-
2026-06-16days on market $165,000 Active 29 DOM
-
2026-06-15days on market $165,000 Active 28 DOM
-
2026-06-13days on market $165,000 Active 26 DOM
-
2026-06-13days on market $165,000 Active 25 DOM
-
2026-06-09days on market $165,000 Active 22 DOM
-
2026-06-08days on market $165,000 Active 21 DOM
-
2026-06-07days on market $165,000 Active 20 DOM
-
2026-06-04days on market $165,000 Active 17 DOM
-
2026-06-03days on market $165,000 Active 16 DOM
-
2026-06-02days on market $165,000 Active 15 DOM
-
2026-06-01days on market $165,000 Active 14 DOM
-
2026-05-31days on market $165,000 Active 13 DOM
-
2026-05-18$165,000 Active
-
2025-03-21historical
-
2025-03-11status Active
-
2025-03-04historical Active Option Contract
-
2025-02-04price $175,000
-
2025-01-08$185,000 Active
-
2019-11-06soldstatus
ⓘ Source: listings_history table (triggers on properties + properties_extension) + one-shot
backfill from property_details.listing_events for pre-trigger history.
Tax reassessment forecast TX · Resets to sale price
- Current annual tax
- $1,906 · $159/mo
- Projected year-2 tax
- $3,020 · $252/mo
- Expected delta
- +$1,113/yr (+$93/mo · 58.4%)
ⓘ Screening estimate from a state-policy table — verify with the county assessor before closing.
Climate risk First Street
- Flood 1/10 Low FEMA zone X (unshaded) · 0% chance over 30 yrs
- Wildfire 6/10 Major
- Heat 7/10 Severe 7 d/yr ≥110°F today · 21 d/yr by 30 yrs out
- Wind 4/10 Moderate 16% chance of damaging wind over 30 yrs
- Air quality 2/10 Low 1 unhealthy d/yr today · 2 by 30 yrs out
Nearby sold comps map
Loading sold comps map…
Walkable amenities ~0.75 mi
Loading nearby amenities…
Taxation est. · year 1
- Rental income
- $17,932
- − Mortgage interest
- −$9,243
- − Property taxes
- −$1,906
- − Insurance
- −$825
- − Repairs & maintenance
- −$1,435
- − Management
- −$1,435
- − Depreciation
- −$4,800
- Taxable loss
- −$1,711
- Est. tax savings @ 24.0%
- +$411
- After-tax cash flow
- $1,462/yr
For passive investors: Depreciation is non-cash, so a rental often shows a tax loss while cash-flowing — sheltering income. Rental losses are passive: they offset passive income freely, and up to $25,000/yr can offset ordinary (W-2) income if you actively participate and your MAGI is under $100k (phasing out to $0 by $150k); unused losses carry forward. On sale, claimed depreciation is recaptured at up to 25%, and gains may owe capital-gains tax (a 1031 exchange can defer both). Figures are a year-1 estimate at your 24.0% rate — not tax advice; consult a CPA.
Schools (NCES district)
- District
- Chico ISD
- NCES district ID
- 4813800
- Math proficiency
- 38% ▼ -19.00%
- Reading proficiency
- 41% ▼ -9.00%
- Median HH income
- $48,546
- Composite
- 33.94/100
- National rank
- #5335
- State rank
- #424 of 826 in TX
Livability — Chico
- Score
- 68/100
- State rank
- #508
- US rank
- #10078
Category grades
Schools grade is shown separately in the Schools card above.
Census & demographics
- Census place
- Chico, TX
- Population (ZIP)
- 4,480
Population outlook (Wise County) Hauer SSP2
- Today (2025)
- 71,620 people
- By 2030
- 75,858 · +5.9%
- By 2040
- 83,908 · +17.2%
- By 2050
- 90,717 · +26.7%
- By 2075
- 107,583 · +50.2%
- By 2100
- 114,996 · +60.6%
Race, ethnicity, and origin ACS 2023
- Neighborhood character
- Predominantly White (82%)
- Race & ethnicity
- White 82% Hispanic / Latino 15% Asian 2% Two or more races 2%
- Hispanic origin (detail)
- Mexican 14%
- Common ancestry
- Slovak 4% Italian 1% Lithuanian 1%
- Foreign-born
- 9% · Canada
- Languages at home
- 87% English-only · Spanish 10% Other Indo-European 2%
Political lean MEDSL · Wise
- 2024 margin
- Solid R (+70.0) · D 14.7% · R 84.7%
- 2008→2024 swing
- -14.3pp toward R · 2008: -55.7pp · 2024: -70.0pp
- All cycles
- 2024: R+70.0 2020: R+68.2 2016: R+69.9 2012: R+67.5 2008: R+55.7
Not yet ingested
- Civics
- —
Market trends
- HPI YoY
- ▼ -33.62%
- Current HPI
- 222.5575
- Rent YoY
- —
- Metro
- —
- State GDP YoY
- ▲ 3.95%
- F500 in state
- 110
Industry mix (Fortune 500 HQ in TX)
| Industry | F500 HQs | Revenue |
|---|---|---|
| Energy | 16 | $1,198B |
|
||
| Technology | 5 | $198B |
|
||
| Engineering / Construction | 4 | $72B |
|
||
| Energy Services | 3 | $60B |
|
||
| Utilities | 3 | $41B |
|
||
| Healthcare | 2 | $330B |
|
||
Price history
-10.8% since first listed7 events — show timeline
- 2026-05-18 Listed $165,000 NTREIS
- 2025-03-21 Listing Removed — NTREIS
- 2025-03-11 Relisted — NTREIS
- 2025-03-04 Contingent — NTREIS
- 2025-02-04 Price Changed $175,000 NTREIS
- 2025-01-08 Listed $185,000 NTREIS
- 2019-11-06 Sold (Public Records) — Public Records
Property tax history
+9.5%/yrLatest (2025): $1,906 · -3.3% YoY. Source: county tax records.
Cash-flow waterfall
monthlySold comps — $/sqft
last 12 mo · ≤1 miLoading sold comps…