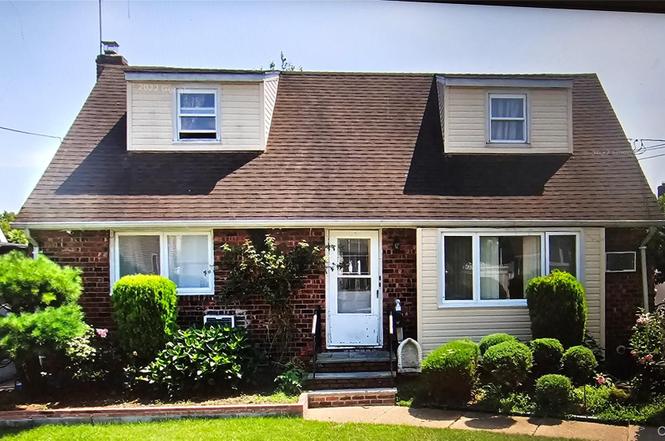
1311 Mcclure Ave · Elmont, NY
Flood risk 1/10 · Minimal
- FEMA flood zone
- X (unshaded)
- Chance of flooding over 30 yrs
- 0.0%
- Est. flood insurance / yr
- $473 – $860
Fire risk 1/10 · Minimal
- Est. fire insurance / yr
- $691 – $1,283
Heat risk 6/10 · Moderate
- Hot days now (above 97°F)
- 7 days/yr
- Hot days in 30 yrs
- 16 days/yr
Wind risk 6/10 · Moderate
- Chance of severe wind over 30 yrs
- 54.0%
Air-quality risk 3/10 · Minor
- Unhealthy air days now
- 4 days/yr
- Unhealthy air days in 30 yrs
- 4 days/yr
Risk factors via First Street. Map © Google.
Why this score? — see what drove the B- grade
The composite is a weighted blend of 9 inputs, each scored 0–100. Each bar is that input's sub-score; the figure is the points it added to the 100-point composite (weight × sub-score).
- Cash flow +22.0/30.0
- ARV discount +15.0/15.0
- Schools +7.2/10.0
- 1% rule +7.1/10.0
- DSCR +7.0/10.0
- Livability +4.0/5.0
- Rent growth +2.5/5.0
- Condition / age +2.5/5.0
- Appreciation +0.0/10.0
$425,000
🖨 Deal sheet (PDF) 📄 Offer letter ✓ Due diligence
Listing remarks
Cape Cod 4br and 2 baths. The home is sold AS-IS with tenants; they are not fully cooperating!! All information is deemed reliable but not guaranteed. Agents /Buyers are responsible for verifying all information pertaining to this property. Please don't advertise without permission. Do not disturb any occupants. short sale subject to bank approval.
Key facts
- 4,320 sq ft lot
- Built 1958
- Listed 21 days
Neighborhood map
What this means for you Summary
Snapshot
- This is a 4-bed/2.0-bath single-family listed at $425k.
Deal economics
- At list price, monthly cash flow is $678 ($8k/yr) — positive.
- The deal already cash-flows at list — no discount required.
- Meets the 1% rule at list price ($5k rent vs $425k).
- Recommended offer: $419k (1.5% below list) — sets the bar for market timing.
- Cap rate 8.2% vs local median 3.1% in Elmont — top-decile yield for the area; either an underpriced asset or a hidden risk that comps aren't pricing in. Stress-test before assuming the spread holds.
Location & tenants
- Location reads 79/100 on livability (#134 in NY, #2,127 nationally) — a middle-class / working-renter tenant base. Strengths: commute A+, employment A+, housing A+; Watch: cost of living F.
- Sewanhaka Central High School District (suburban): math 76% / reading 83% proficiency, ranked #43 of 590 in NY (top 7%) — strong family-tenant draw, lease renewals of 3-5y typical; only 19% free/reduced lunch — higher-income household profile.
- Market conditions: 141 active listings in the ZIP; 5 comparable units currently listed for rent nearby; rentals leasing fast (median 0d on market — plan ~1-2 weeks tenant-placement turnaround); 824 units permitted in Nassau County in 2024 (153 in 5+ unit buildings).
Forward outlook
- Local home prices are declining (-3.0%/yr); year-one equity from $3k of loan paydown is wiped out by about $13k of value loss. Plan a longer hold.
- Nassau County population projected at +7% by 2050 — modest demand growth; plan on rents tracking national, not racing it.
Negotiation context
- It's been on market 21 days — a 2% lower offer ($419k) is reasonable based on typical stale-listing flexibility.
- 2 sale attempts since 2y ago with the ask held roughly flat each time — persistent listings suggest the price (not the market) is what's stuck; bring a comps-based counter.
Risks & watch-outs
- Watch-outs: property tax is 2.7% of price; built in 1958 — expect roof / HVAC / electrical / plumbing capex.
- Climate carrying-cost: major wind risk, 54% chance of damaging wind over 30y; extreme-heat days projected 7→16/yr by 2055 (HVAC capex compounding) — expect insurance premiums to compound above CPI over the hold.
Questions for the listing agent
- Built in 1958 — when were the roof, HVAC, electrical panel, plumbing, and water heater last replaced?
- Property tax is high relative to price — has the assessment been appealed recently, and will the sale trigger a re-assessment?
- Is there a deadline driving the sale (1031 exchange, divorce, estate, relocation)? That informs how much negotiation room exists.
- Schools are B-rated — typically a magnet for longer-tenancy family renters. What's the average tenant stay here, and is there a school-zone premium baked into asking?
- What's the average days-on-market for RENTAL listings here right now (not sales)? A rising rental-DOM trend means longer vacancies and softer asking-rent achievability than the comps imply.
- What's the recent tenant-quality profile in this submarket — average credit score on applications, eviction rate, late-payment / NSF rate, and stable-employment percentage? A property-management company in the area should have these aggregated.
- How much new for-sale + rental construction is in the pipeline within 1–3 miles? Heavy new supply typically softens prices + rents 12–24 months out; constrained supply supports both.
Investment metrics
- 1% rule
- 1.21% ✓
- Cap rate
- 8.21%
- Cash-on-cash
- 6.84%
- DSCR
- 1.30
- GRM
- 6.9
CMA / ARV
- ARV (on-the-fly)
- $772,440
- Comps found
- 12
Show comp detail 12 sales within ~0.75 mi
| Address | Dist | Beds/Ba | Sqft | Sold | Price | $/sf | Match |
|---|---|---|---|---|---|---|---|
| 1353 Kiefer Ave | 0.10mi | 3/3.0 (-1) | 1,298 (+6%) | 0mo | $725,000 | $559 | 77 |
| 389 Kirkman Ave | 0.27mi | 3/2.0 (-1) | 1,210 (-2%) | 3mo | $670,000 | $554 | 77 |
| 32 Butler Blvd | 0.54mi | 4/2.0 | 1,198 (-3%) | 2mo | $775,000 | $647 | 69 |
| 1020 Polk Ave | 0.52mi | 4/2.0 | 1,163 (-5%) | 1mo | $780,000 | $671 | 66 |
| 1098 Russell St | 0.67mi | 4/2.0 | 1,254 (+2%) | 3mo | $839,000 | $669 | 63 |
| 1132 Norbay St | 0.41mi | 3/3.0 (-1) | 1,280 (+4%) | 3mo | $649,000 | $507 | 62 |
| 912 Oaks Dr | 0.74mi | 4/2.0 | 1,275 (+4%) | 2mo | $825,000 | $647 | 58 |
| 69 Butler Blvd | 0.46mi | 4/3.0 | 1,123 (-9%) | 2mo | $730,000 | $650 | 58 |
| 1041 Mosefan St | 0.70mi | 3/2.0 (-1) | 1,281 (+4%) | 2mo | $737,000 | $575 | 53 |
| 1134 Rosegold St | 0.55mi | 4/2.5 | 1,358 (+10%) | 4mo | $750,000 | $552 | 52 |
| 1366 E St | 0.38mi | 3/1.0 (-1) | 1,062 (-14%) | 3mo | $540,000 | $508 | 48 |
| 40 Belmont Blvd | 0.73mi | 3/1.5 (-1) | 1,075 (-13%) | 2mo | $675,000 | $628 | 36 |
Match score weights: distance 35% · size 25% · config 20% · recency 20%. Top-matched comps best support the ARV.
Projected returns pro-forma
-3.0% appreciation · 3.0% rent growth · sell at horizon
- IRR
- -5.7%
- Equity multiple
- 0.79×
- Total profit
- $-25,354
- Equity at exit
- $63,369
- IRR
- 4.0%
- Equity multiple
- 1.29×
- Total profit
- $34,909
- Equity at exit
- $36,746
Cash invested: $119,000 (down + closing). Projections, not guarantees.
Landlord ↔ Tenant lean methodology
- Overall (STATE)
- 15 Strongly Tenant-Friendly
- State New York
- 15 Strongly Tenant-Friendly · D+10
- County
- — inherits STATE
- City
- — inherits STATE
ZIP-level market 11003
- Active inventory
- 141
- Price-to-rent
- 6.9×
Monthly cashflow live
- Estimated rent
- $5,125 high interval (Pro) →
- Mortgage (P&I)
- −$2,229
- Tax from tax record
- −$965 /mo · $11,584/yr
- Insurance
- −$177
- HOA
- −$0
- Vacancy / Maint / Mgmt
- −$1,076
- Net cashflow
- $678
Break-even live
Sensitivity live
| Price | -10% $918 | -5% $798 | +0% $678 | +5% $558 | +10% $437 |
|---|---|---|---|---|---|
| Rent | -10% $273 | -5% $475 | +0% $678 | +5% $880 | +10% $1,083 |
| Rate | -1.0pp $892 | -0.5pp $786 | base $678 | +0.5pp $568 | +1.0pp $456 |
UW: 25.0% down · 7.5% · 30yr · 1.5% tax · 5.0% vac · 8.0% maint · 8.0% mgmt
Financing live
Cash to close
- Down payment
- $106,250
- Closing costs
- $12,750
- Reserves months
- —
- Total cash needed
- —
Loan-product check · same deal, 3 products live
Conventional
25% down · 7.5% · 30yr
- Down + closing
- —
- Monthly P&I
- —
- Monthly cashflow
- —
- DSCR
- —
- Eligible?
- —
Personal DTI + credit; lowest rate.
DSCR
20% down · 8.5% · 30yr
- Down + closing
- —
- Monthly P&I
- —
- Monthly cashflow
- —
- DSCR
- —
- Eligible?
- —
No personal income docs; deal must DSCR.
Hard money
10% down · 12.0% · 12mo
- Down + closing
- —
- Monthly P&I
- —
- Monthly cashflow
- —
- DSCR
- —
- Eligible?
- —
Short-term bridge; refi at stabilization.
Rent comps 5 comps
| Address | Beds | Baths | Sqft | Rent | $/sqft | DOM | Units | Dist |
|---|---|---|---|---|---|---|---|---|
| 1316 McClure Ave Elmont, NY | 4.0 | 2.5 | 1230 | $5,500 | $4.47 | 0d | 1 | 0.06mi |
| 630 Tulip Ave Unit 2 Floral Park, NY | 3.0 | 1.0 | 1000 | $3,300 | $3.30 | 22d | 1 | 1.24mi |
| 33 Kingston Ave Unit 1ST Floor South Floral Park, NY | 3.0 | 1.0 | 900 | $3,000 | $3.33 | 0d | 1 | 1.26mi |
| 605 Tulip Ave Stewart Manor, NY | 3.0 | 1.0 | 665 | $3,790 | $5.70 | 0d | 1 | 1.31mi |
| 146 Covert Ave Apt H6 Stewart Manor, NY | 3.0 | 3.0 | 950 | $3,790 | $3.99 | 0d | 1 | 1.35mi |
Listing history 9 events
-
2025-12-11status Pending
-
2025-11-19$425,000 Active
-
2024-06-28status Pending
-
2024-06-28historical
-
2024-06-26$425,000 Active
-
2006-08-10soldstatus $465,000
-
2006-08-10soldstatus $465,000
-
1989-01-05soldstatus $170,000
-
1979-09-01soldstatus $57,000
ⓘ Source: listings_history table (triggers on properties + properties_extension) + one-shot
backfill from property_details.listing_events for pre-trigger history.
Tax reassessment forecast NY · Partial reset (capped growth)
- Current annual tax
- $11,584 · $965/mo
- Projected year-2 tax
- $11,584 · $965/mo
- Expected delta
- $0/yr ($0/mo · 0.0%)
ⓘ Screening estimate from a state-policy table — verify with the county assessor before closing.
Climate risk First Street
- Flood 1/10 Low FEMA zone X (unshaded) · 0% chance over 30 yrs
- Wildfire 1/10 Low
- Heat 6/10 Major 7 d/yr ≥97°F today · 16 d/yr by 30 yrs out
- Wind 6/10 Major 54% chance of damaging wind over 30 yrs
- Air quality 3/10 Moderate 4 unhealthy d/yr today · 4 by 30 yrs out
Nearby sold comps map
Loading sold comps map…
Walkable amenities ~0.75 mi
Loading nearby amenities…
Taxation est. · year 1
- Rental income
- $61,504
- − Mortgage interest
- −$23,807
- − Property taxes
- −$11,584
- − Insurance
- −$2,125
- − Repairs & maintenance
- −$4,920
- − Management
- −$4,920
- − Depreciation
- −$12,364
- Taxable income
- $1,784
- Est. tax owed @ 24.0%
- −$428
- After-tax cash flow
- $7,706/yr
For passive investors: Depreciation is non-cash, so a rental often shows a tax loss while cash-flowing — sheltering income. Rental losses are passive: they offset passive income freely, and up to $25,000/yr can offset ordinary (W-2) income if you actively participate and your MAGI is under $100k (phasing out to $0 by $150k); unused losses carry forward. On sale, claimed depreciation is recaptured at up to 25%, and gains may owe capital-gains tax (a 1031 exchange can defer both). Figures are a year-1 estimate at your 24.0% rate — not tax advice; consult a CPA.
Schools (NCES district)
- District
- Sewanhaka Central High School District
- NCES district ID
- 3626520
- Math proficiency
- 76% ▬ 0.00%
- Reading proficiency
- 83% ▲ 9.00%
- Median HH income
- $95,771
- Composite
- 71.6/100
- National rank
- #220
- State rank
- #43 of 590 in NY
Livability — Elmont
- Score
- 79/100
- State rank
- #134
- US rank
- #2127
Category grades
Schools grade is shown separately in the Schools card above.
Census & demographics
- Census place
- Elmont, NY
- City population
- 44,716
- Population (ZIP)
- 44,716
Population outlook (Nassau County) Hauer SSP2
- Today (2025)
- 1,409,302 people
- By 2030
- 1,431,482 · +1.6%
- By 2040
- 1,471,607 · +4.4%
- By 2050
- 1,502,845 · +6.6%
- By 2075
- 1,575,403 · +11.8%
- By 2100
- 1,554,356 · +10.3%
Race, ethnicity, and origin ACS 2023
- Neighborhood character
- Highly diverse neighborhood (Simpson 0.74)
- Race & ethnicity
- Black 41% Hispanic / Latino 22% Asian 17% White 14% Two or more races 11%
- Hispanic origin (detail)
- Mexican 2% Puerto Rican 4% Dominican 2%
- Common ancestry
- Hispanic 12% Romanian 1%
- Foreign-born
- 43% · Canada, Jamaica, China
- Languages at home
- 53% English-only · Spanish 19% French/Haitian/Cajun 10% Other Indo-European 8%
Political lean MEDSL · Nassau
- 2024 margin
- Toss-up / Even · D 47.9% · R 52.1%
- 2008→2024 swing
- -12.6pp toward R · 2008: 8.4pp · 2024: -4.2pp
- All cycles
- 2024: R+4.2 2020: D+9.5 2016: D+5.3 2012: D+6.7 2008: D+8.4
Not yet ingested
- Civics
- —
Market trends
- HPI YoY
- ▼ -654.86%
- Current HPI
- 346.1523
- Rent YoY
- —
- Metro
- —
- State GDP YoY
- ▲ 2.60%
- F500 in state
- 92
Industry mix (Fortune 500 HQ in NY)
| Industry | F500 HQs | Revenue |
|---|---|---|
| Financial Services | 10 | $950B |
|
||
| Consumer Goods | 9 | $162B |
|
||
| Insurance | 4 | $225B |
|
||
| Telecommunications | 2 | $144B |
|
||
| Pharmaceuticals | 2 | $112B |
|
||
| Media / Entertainment | 2 | $69B |
|
||
Price history
+645.6% since first listed9 events — show timeline
- 2025-12-11 Pending — OneKey® MLS as Distributed by MLS Grid
- 2025-11-19 Listed $425,000 OneKey® MLS as Distributed by MLS Grid
- 2024-06-28 Pending — OneKey® MLS as Distributed by MLS Grid
- 2024-06-28 Listing Removed — OneKey® MLS as Distributed by MLS Grid
- 2024-06-26 Listed $425,000 OneKey® MLS as Distributed by MLS Grid
- 2006-08-10 Sold (Public Records) $465,000 Public Records
- 2006-08-10 Sold (Public Records) $465,000 Public Records
- 1989-01-05 Sold (Public Records) $170,000 Public Records
- 1979-09-01 Sold (Public Records) $57,000 Public Records
Property tax history
+3.4%/yrLatest (2024): $11,584 · +0.9% YoY. Source: county tax records.
Cash-flow waterfall
monthlySold comps — $/sqft
last 12 mo · ≤1 miLoading sold comps…