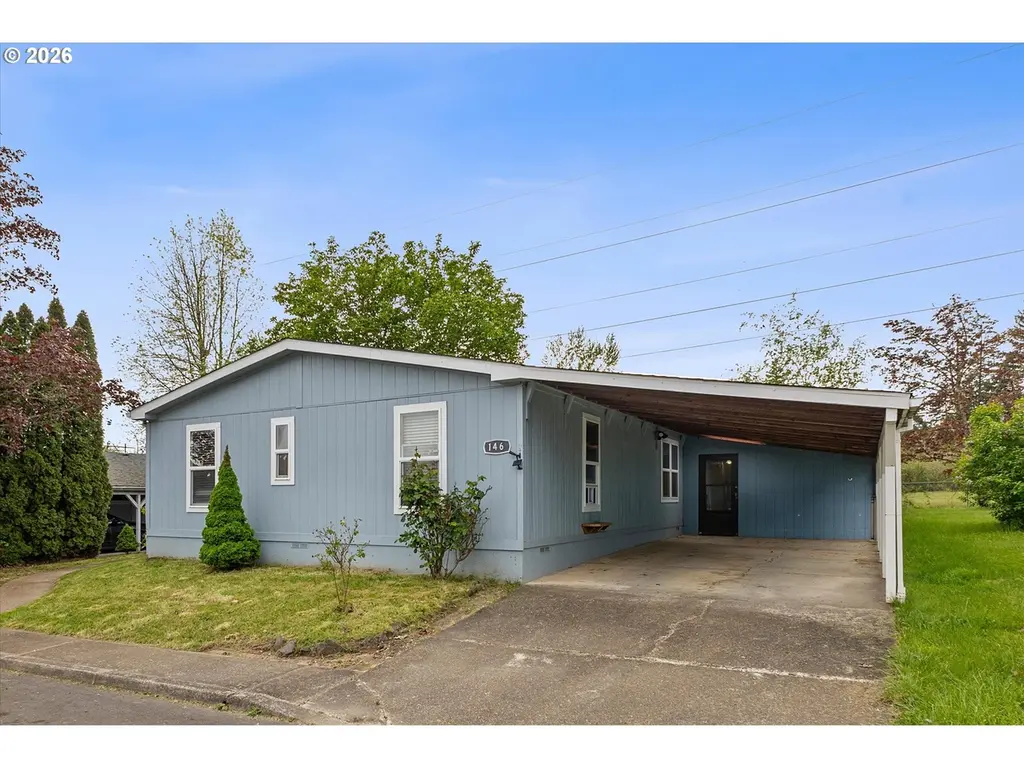
13620 SW Beef Bend Rd #146 · King City, OR
Flood risk 1/10 · Minimal
- FEMA flood zone
- X (unshaded)
- Chance of flooding over 30 yrs
- 0.0%
- Est. flood insurance / yr
- $507 – $1,088
Fire risk 3/10 · Minor
- Est. fire insurance / yr
- $498 – $926
Heat risk 3/10 · Minor
- Hot days now (above 92°F)
- 7 days/yr
- Hot days in 30 yrs
- 14 days/yr
Wind risk 1/10 · Minimal
- Chance of severe wind over 30 yrs
- —
Air-quality risk 9/10 · Severe
- Unhealthy air days now
- 12 days/yr
- Unhealthy air days in 30 yrs
- 13 days/yr
Risk factors via First Street. Map © Google.
Why this score? — see what drove the B+ grade
The composite is a weighted blend of 9 inputs, each scored 0–100. Each bar is that input's sub-score; the figure is the points it added to the 100-point composite (weight × sub-score).
- Cash flow +30.0/30.0
- ARV discount +14.9/15.0
- 1% rule +10.0/10.0
- DSCR +10.0/10.0
- Schools +4.9/10.0
- Livability +4.2/5.0
- Condition / age +2.5/5.0
- Rent growth +2.4/5.0
- Appreciation +0.0/10.0
$119,900
🖨 Deal sheet (PDF) 📄 Offer letter ✓ Due diligence
Listing remarks MLS
CUSTOM BUILT 3br/2ba w/HUGE LANDSCAPED LOT! GORGEOUS inside & out! Huge 2nd & 3rd br’s! Dbl sink in 14x6 ba between them! Beautifully lndscpd yard w/manicured lawns both front & back! Lg fully fncd back yd w/27x12 railed deck! ELEGANT well cared for home! Large dogs OK! ALL AGES Park! Tigard $32,850!
Key facts
- Garage
- Built 1990
- Listed 7 days
Property features AI
Finance
- Other: Park space/lot in mobile home community; Lot rent amount available
- Financial info: Lot rent charged monthly
- HOA & community: Community provides management, water, and sewer; Located in Mountain View Mobile Estates (park); Land lease in effect (land lease expiration: July 1, 2028)
Exterior
- Parking: Carport (extra deep); On-street parking; One parking space
- Utilities: Public water; Public sewer; Electric service (fuel: electricity)
- Home design: Manufactured home in park (Ranchero model by Redman); Single-story / one level; Resale property; No notable view
- Construction: Built in 1990; Shingle/composition roof; Pillar/post/pier foundation with skirting
- Exterior features: Covered deck; Fenced yard; Tool shed; Workshop; T-111 siding; Yard; Level lot; Private road access; Trees; Paved road
Interior
- Kitchen: Dishwasher; Free-standing range; Free-standing refrigerator; Range hood; Electric hot water
- Bedrooms: Primary bedroom on main level; Second bedroom on main level; Third bedroom on main level
- Flooring: Laminate flooring
- Bathrooms: Two full bathrooms (both on main level)
- Heating & cooling: Forced air heating; Central air conditioning
- Interior features: Main-floor bedroom with bath and one-level living (accessible); Vaulted ceilings; Skylight(s); Laminate flooring; Washer and dryer included; Laundry area; Double-pane windows with vinyl frames; Crawl space basement
- Laundry & utility: Washer and dryer included; Laundry area
Neighborhood map
What this means for you Summary
Snapshot
- This is a 3-bed/2.0-bath manufactured listed at $120k.
Deal economics
- At list price, monthly cash flow is $1k ($15k/yr) — positive.
- The deal already cash-flows at list — no discount required.
- Meets the 1% rule at list price ($3k rent vs $120k).
- Cap rate 18.6% vs local median 2.7% in King City — top-decile yield for the area; either an underpriced asset or a hidden risk that comps aren't pricing in. Stress-test before assuming the spread holds.
Location & tenants
- Location reads 85/100 on livability (#24 in OR, #539 nationally) — a professional / high-income tenant draw. Strengths: crime A+, commute A+, housing A+.
- Tigard-Tualatin SD 23J (suburban): math 47% / reading 65% proficiency, ranked #6 of 58 in OR (top 10%) — acceptable for families but not a draw, mixed tenant base, ~2y average lease.
- Zoned schools: Deer Creek Elementary School (565 students, 32% FRL); Twality Middle School (math 54% / reading 64%, grade B, #17 of 128 statewide, top 14%, 918 students, 31% FRL); Tualatin High School (math 75% / reading 75%, grade A-, #2 of 143 statewide, top 6%, 1,747 students, 25% FRL) — zoned schools at 29% FRL track the district average.
- Market conditions: Rents soft (-0.4%/yr); 424 active listings in the ZIP; 11 comparable units currently listed for rent nearby; rentals leasing fast (median 13d on market — plan ~1-2 weeks tenant-placement turnaround); solid renter incomes; 2,224 units permitted in Washington County in 2024 (242 in 5+ unit buildings).
- This rent runs 31% of the median local income ($98k/yr) — at the standard rent-burdened threshold; future hikes will face affordability resistance.
Forward outlook
- Local home prices are declining (-3.0%/yr); year-one equity from $829 of loan paydown is wiped out by about $4k of value loss. Plan a longer hold.
- Washington County population projected at +33% by 2050 — long-run rental-demand tailwind backs the buy-and-hold thesis.
- At projected returns (-3.0% appreciation + 0.0% rent growth), your $34k cash investment doubles in ~3 years — after that, you're playing with house money.
Negotiation context
- Only 7 days on market — expect competitive offers; lowballing is unlikely to land.
- 2 sale attempts since 19y ago with the ask held roughly flat each time — persistent listings suggest the price (not the market) is what's stuck; bring a comps-based counter.
- Current owner paid $30k; list at $120k implies a 300% gain — meaningful room to come down on a strong offer.
Questions for the listing agent
- Is there a deadline driving the sale (1031 exchange, divorce, estate, relocation)? That informs how much negotiation room exists.
- What's the average days-on-market for RENTAL listings here right now (not sales)? A rising rental-DOM trend means longer vacancies and softer asking-rent achievability than the comps imply.
- What's the recent tenant-quality profile in this submarket — average credit score on applications, eviction rate, late-payment / NSF rate, and stable-employment percentage? A property-management company in the area should have these aggregated.
- How much new for-sale + rental construction is in the pipeline within 1–3 miles? Heavy new supply typically softens prices + rents 12–24 months out; constrained supply supports both.
Investment metrics
- 1% rule
- 2.11% ✓
- Cap rate
- 18.62%
- Cash-on-cash
- 44.04%
- DSCR
- 2.96
- GRM
- 4.0
CMA / ARV
- ARV (on-the-fly)
- $143,424
- Comps found
- 12
Show comp detail 12 sales within ~0.75 mi
| Address | Dist | Beds/Ba | Sqft | Sold | Price | $/sf | Match |
|---|---|---|---|---|---|---|---|
| 13620 SW Beef Bend Rd #146 | 0.00mi | 3/2.0 | 1,728 (0%) | 0mo | $115,000 | $67 | 100 |
| 13620 SW Beef Bend Rd #66 | 0.15mi | 3/2.0 | 1,684 (-2%) | 2mo | $120,000 | $71 | 87 |
| 13620 SW Beef Bend Rd #130 | 0.16mi | 3/2.0 | 1,810 (+5%) | 12mo | $116,000 | $64 | 74 |
| 13620 SW Beef Bend Rd #149 | 0.03mi | 4/2.0 (+1) | 1,596 (-8%) | 9mo | $146,020 | $91 | 74 |
| 13620 SW Beef Bend Rd #1 | 0.26mi | 3/2.0 | 1,525 (-12%) | 1mo | $199,000 | $130 | 68 |
| 13620 SW Beef Bend Rd #85 | 0.16mi | 3/2.0 | 1,600 (-7%) | 20mo | $170,000 | $106 | 64 |
| 13620 SW Beef Bend Rd #20 | 0.11mi | 3/2.0 | 1,512 (-12%) | 17mo | $173,900 | $115 | 60 |
| 13620 SW Beef Bend Rd #27 | 0.10mi | 4/2.0 (+1) | 1,915 (+11%) | 19mo | $100,000 | $52 | 56 |
| 17123 SW Eldorado Dr | 0.70mi | 3/2.0 | 1,568 (-9%) | 2mo | $129,985 | $83 | 50 |
| 17254 SW Eldorado Dr | 0.63mi | 3/2.0 | 1,488 (-14%) | 11mo | $88,000 | $59 | 39 |
| 17071 SW Eldorado Dr | 0.58mi | 2/2.0 (-1) | 1,488 (-14%) | 14mo | $76,985 | $52 | 33 |
| 17106 SW Eldorado Dr | 0.73mi | 3/2.0 | 1,568 (-9%) | 22mo | $162,985 | $104 | 32 |
Match score weights: distance 35% · size 25% · config 20% · recency 20%. Top-matched comps best support the ARV.
Projected returns pro-forma
-3.0% appreciation · 0.0% rent growth · sell at horizon
- IRR
- 37.6%
- Equity multiple
- 2.54×
- Total profit
- $51,639
- Equity at exit
- $17,877
- IRR
- 42.7%
- Equity multiple
- 4.50×
- Total profit
- $117,392
- Equity at exit
- $10,367
Cash invested: $33,572 (down + closing). Projections, not guarantees.
Landlord ↔ Tenant lean methodology
- Overall (STATE)
- 28 Tenant-Leaning
- State Oregon
- 28 Tenant-Leaning · D+6
- County
- — inherits STATE
- City
- — inherits STATE
ZIP-level market 97224
- Rents YoY
- -0.4%
- Active inventory
- 424
- Price-to-rent
- 4.0×
Monthly cashflow live
- Estimated rent
- $2,527 high interval (Pro) →
- Mortgage (P&I)
- −$629
- Tax from tax record
- −$85 /mo · $1,024/yr
- Insurance
- −$50
- HOA
- −$0
- Vacancy / Maint / Mgmt
- −$531
- Net cashflow
- $1,232
Break-even live
Sensitivity live
| Price | -10% $1,300 | -5% $1,266 | +0% $1,232 | +5% $1,198 | +10% $1,164 |
|---|---|---|---|---|---|
| Rent | -10% $1,033 | -5% $1,132 | +0% $1,232 | +5% $1,332 | +10% $1,432 |
| Rate | -1.0pp $1,293 | -0.5pp $1,263 | base $1,232 | +0.5pp $1,201 | +1.0pp $1,169 |
UW: 25.0% down · 7.5% · 30yr · 1.5% tax · 5.0% vac · 8.0% maint · 8.0% mgmt
Financing live
Cash to close
- Down payment
- $29,975
- Closing costs
- $3,597
- Reserves months
- —
- Total cash needed
- —
Loan-product check · same deal, 3 products live
Conventional
25% down · 7.5% · 30yr
- Down + closing
- —
- Monthly P&I
- —
- Monthly cashflow
- —
- DSCR
- —
- Eligible?
- —
Personal DTI + credit; lowest rate.
DSCR
20% down · 8.5% · 30yr
- Down + closing
- —
- Monthly P&I
- —
- Monthly cashflow
- —
- DSCR
- —
- Eligible?
- —
No personal income docs; deal must DSCR.
Hard money
10% down · 12.0% · 12mo
- Down + closing
- —
- Monthly P&I
- —
- Monthly cashflow
- —
- DSCR
- —
- Eligible?
- —
Short-term bridge; refi at stabilization.
Rent comps 11 comps
| Address | Beds | Baths | Sqft | Rent | $/sqft | DOM | Units | Dist |
|---|---|---|---|---|---|---|---|---|
| 16903 SW 133rd Ter Portland, OR | 3.0 | 2.5 | 1665 | $2,845 | $1.71 | 12d | 1 | 0.22mi |
| 13060 SW Dickson St Portland, OR | 2.0 | 2.0 | 1108 | $1,850 | $1.67 | 45d | 1 | 0.27mi |
| 17335 SW Montague Way Portland, OR | 3.0 | 2.5 | 1687 | $3,175 | $1.88 | 0d | 1 | 0.39mi |
| 15050 SW 141st Ave Portland, OR | 3.0 | 2.0 | 2051 | $3,495 | $1.70 | 19d | 1 | 0.79mi |
| 12070 SW Fischer Rd Portland, OR | 1.0–3.0 | 1.0–2.0 | 925 | $2,099 | $2.27 | 3d | 9 | 0.80mi |
| 17865 SW Pacific Hwy Tualatin, OR | 1.0–3.0 | 1.0–2.0 | 970 | $2,242 | $2.31 | 3d | 13 | 0.83mi |
| 15205 SW 119th Ave Portland, OR | 2.0 | 2.0 | 1650 | $2,150 | $1.30 | 22d | 1 | 1.06mi |
| 11865 SW Tualatin Rd Tualatin, OR | 2.0–3.0 | 2.0–2.5 | 1154 | $2,737 | $2.37 | 0d | 18 | 1.07mi |
| 17979 SW 115th Ave Unit 6 Tualatin, OR | 2.0 | 1.5 | 1064 | $1,625 | $1.53 | 25d | 1 | 1.17mi |
| 17989 SW 115th Ave Tualatin, OR | 2.0 | 1.0–1.5 | 982 | $1,550 | $1.58 | 25d | 2 | 1.23mi |
| 15199 SW Royalty Pkwy Portland, OR | 1.0–3.0 | 1.0–2.0 | 884 | $2,205 | $2.49 | 3d | 12 | 1.48mi |
Listing history 6 events
-
2026-04-30status Pending
-
2026-04-23$119,900 Active
-
2008-04-09soldstatus $30,000 320-char remark
Show marketing remark (320 chars)
CUSTOM BUILT 3br/2ba w/HUGE LANDSCAPED LOT! GORGEOUS inside & out! Huge 2nd & 3rd br’s! Dbl sink in 14x6 ba between them! Beautifully lndscpd yard w/manicured lawns both front & back! Lg fully fncd back yd w/27x12 railed deck! ELEGANT well cared for home! Large dogs OK! ALL AGES Park! Tigard $32,850!
-
2008-03-03historical 320-char remark
Show marketing remark (320 chars)
CUSTOM BUILT 3br/2ba w/HUGE LANDSCAPED LOT! GORGEOUS inside & out! Huge 2nd & 3rd br’s! Dbl sink in 14x6 ba between them! Beautifully lndscpd yard w/manicured lawns both front & back! Lg fully fncd back yd w/27x12 railed deck! ELEGANT well cared for home! Large dogs OK! ALL AGES Park! Tigard $32,850!
-
2007-09-30$32,850 320-char remark
Show marketing remark (320 chars)
CUSTOM BUILT 3br/2ba w/HUGE LANDSCAPED LOT! GORGEOUS inside & out! Huge 2nd & 3rd br’s! Dbl sink in 14x6 ba between them! Beautifully lndscpd yard w/manicured lawns both front & back! Lg fully fncd back yd w/27x12 railed deck! ELEGANT well cared for home! Large dogs OK! ALL AGES Park! Tigard $32,850!
-
1992-02-06soldstatus $41,500
ⓘ Source: listings_history table (triggers on properties + properties_extension) + one-shot
backfill from property_details.listing_events for pre-trigger history.
Tax reassessment forecast OR · Resets to sale price
- Current annual tax
- $1,024 · $85/mo
- Projected year-2 tax
- $1,163 · $97/mo
- Expected delta
- +$139/yr (+$12/mo · 13.6%)
ⓘ Screening estimate from a state-policy table — verify with the county assessor before closing.
Climate risk First Street
- Flood 1/10 Low FEMA zone X (unshaded) · 0% chance over 30 yrs
- Wildfire 3/10 Moderate
- Heat 3/10 Moderate 7 d/yr ≥92°F today · 14 d/yr by 30 yrs out
- Wind 1/10 Low
- Air quality 9/10 Extreme 12 unhealthy d/yr today · 13 by 30 yrs out
Nearby sold comps map
Loading sold comps map…
Walkable amenities ~0.75 mi
Loading nearby amenities…
Taxation est. · year 1
- Rental income
- $30,321
- − Mortgage interest
- −$6,716
- − Property taxes
- −$1,024
- − Insurance
- −$600
- − Repairs & maintenance
- −$2,426
- − Management
- −$2,426
- − Depreciation
- −$3,488
- Taxable income
- $13,643
- Est. tax owed @ 24.0%
- −$3,274
- After-tax cash flow
- $11,511/yr
For passive investors: Depreciation is non-cash, so a rental often shows a tax loss while cash-flowing — sheltering income. Rental losses are passive: they offset passive income freely, and up to $25,000/yr can offset ordinary (W-2) income if you actively participate and your MAGI is under $100k (phasing out to $0 by $150k); unused losses carry forward. On sale, claimed depreciation is recaptured at up to 25%, and gains may owe capital-gains tax (a 1031 exchange can defer both). Figures are a year-1 estimate at your 24.0% rate — not tax advice; consult a CPA.
Schools (NCES district)
- District
- Tigard-Tualatin SD 23J
- NCES district ID
- 4112240
- Math proficiency
- 47% ▼ -3.00%
- Reading proficiency
- 65% ▲ 3.00%
- Median HH income
- $60,739
- Composite
- 48.72/100
- National rank
- #2100
- State rank
- #6 of 58 in OR
Livability — King City
- Score
- 85/100
- State rank
- #24
- US rank
- #539
Category grades
Schools grade is shown separately in the Schools card above.
Census & demographics
- Census place
- King City, OR
- County
- Washington County · 583,254 people
- Metro
- Portland-Vancouver-Hillsboro, OR-WA
- Population (ZIP)
- 36,569
- Household income
- $98,125
- Rent vs Own
- Severe rent burden
- 1468.0
Population outlook (Washington County) Hauer SSP2
- Today (2025)
- 674,042 people
- By 2030
- 721,804 · +7.1%
- By 2040
- 812,732 · +20.6%
- By 2050
- 895,143 · +32.8%
- By 2075
- 1,058,806 · +57.1%
- By 2100
- 1,131,692 · +67.9%
Race, ethnicity, and origin ACS 2023
- Neighborhood character
- Predominantly White (73%)
- Race & ethnicity
- White 73% Hispanic / Latino 10% Two or more races 8% Asian 8% Black 3%
- Hispanic origin (detail)
- Mexican 7%
- Common ancestry
- Italian 4% Lithuanian 4% Slovak 3%
- Foreign-born
- 13% · Canada, Vietnam, China
- Languages at home
- 83% English-only · Spanish 7% Other Indo-European 3% Vietnamese 2%
Political lean MEDSL · Washington
- 2024 margin
- Solid D (+34.0) · D 65.3% · R 31.3% · Other 3.4%
- 2008→2024 swing
- +11.8pp toward D · 2008: 22.1pp · 2024: 34.0pp
- All cycles
- 2024: D+34.0 2020: D+34.6 2016: D+26.7 2012: D+17.5 2008: D+22.1
Not yet ingested
- Civics
- —
Market trends
- HPI YoY
- ▼ -287.40%
- Current HPI
- 277.57
- Rent YoY
- ▼ -0.38%
- Metro
- Portland-Vancouver-Hillsboro, OR-WA
- State GDP YoY
- ▲ 2.05%
- F500 in state
- 2
Industry mix (Fortune 500 HQ in OR)
| Industry | F500 HQs | Revenue |
|---|---|---|
| Consumer Goods | 1 | $51B |
|
||
Price history
+188.9% since first listed6 events — show timeline
- 2026-04-30 Pending — RMLS
- 2026-04-23 Listed $119,900 RMLS
- 2008-04-09 Sold (MLS) $30,000 RMLS
- 2008-03-03 Delisted — RMLS
- 2007-09-30 Listed $32,850 RMLS
- 1992-02-06 Sold (Public Records) $41,500 Public Records
Property tax history
+6.1%/yrLatest (2025): $1,024 · +10.2% YoY. Source: county tax records.
Cash-flow waterfall
monthlySold comps — $/sqft
last 12 mo · ≤1 miLoading sold comps…