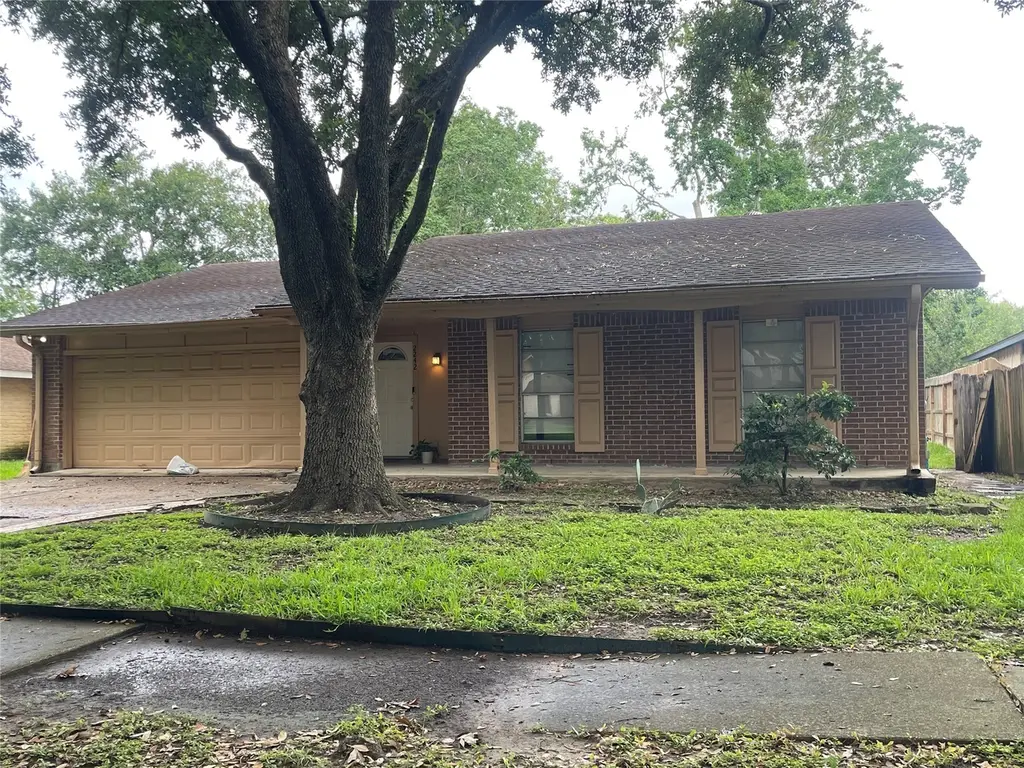
2242 Stillmeadow Dr · Missouri City, TX
Flood risk 6/10 · Moderate
- FEMA flood zone
- X (unshaded)
- Chance of flooding over 30 yrs
- 0.7%
- Est. flood insurance / yr
- $507 – $1,088
Fire risk 2/10 · Minimal
- Est. fire insurance / yr
- $1,222 – $2,270
Heat risk 9/10 · Severe
- Hot days now (above 110°F)
- 7 days/yr
- Hot days in 30 yrs
- 23 days/yr
Wind risk 9/10 · Severe
- Chance of severe wind over 30 yrs
- 99.0%
Air-quality risk 3/10 · Minor
- Unhealthy air days now
- 2 days/yr
- Unhealthy air days in 30 yrs
- 3 days/yr
Risk factors via First Street. Map © Google.
Why this score? — see what drove the D- grade
The composite is a weighted blend of 9 inputs, each scored 0–100. Each bar is that input's sub-score; the figure is the points it added to the 100-point composite (weight × sub-score).
- Cash flow +9.7/30.0
- ARV discount +5.3/15.0
- Appreciation +4.7/10.0
- Schools +4.5/10.0
- 1% rule +3.8/10.0
- Livability +3.4/5.0
- DSCR +2.7/10.0
- Rent growth +2.6/5.0
- Condition / age +2.5/5.0
$230,000
🖨 Deal sheet (PDF) 📄 Offer letter ✓ Due diligence
Listing remarks MLS
Will maintained 3 bedroom Home on tree lined street. New carpet in Bedrooms and new Laminate in hall and Living Room 1. Open floor plan. Washer and Dryer included. Two years remaining on Home warranty.
Key facts
- Cul-de-sac
- 7,178 sq ft lot
- Garage
Tags
Property features AI
Finance
- Other: Seller disclosure available
- HOA & community: Homeowners association with an annual fee of $1,000
Exterior
- Parking: Attached garage with 1 parking space
- Utilities: Public water; Public sewer
- Home design: Residential property; Single-story entry (first level living); Brick construction; Faces unspecified direction
- Construction: Built in 1975; Composition roof; Slab foundation
- Exterior features: Property on a cul-de-sac
Interior
- Bedrooms: Primary bedroom on the first level; Additional bedrooms on the first level
- Bathrooms: 2 full bathrooms
- Heating & cooling: Central heating (electric); Central air conditioning (electric)
- Interior features: One fireplace; Bonus room
Neighborhood map
What this means for you Summary
Snapshot
- This is a 3-bed/2.0-bath single-family listed at $230k.
Deal economics
- At list price, monthly cash flow is $-151 ($-2k/yr) — negative.
- To cash-flow at today's rent, offer at most $203k (11.6% below list).
- To meet the 1% rule (rent ≥ 1% of price), the offer needs to be $201k (12.5% below list).
- Recommended offer: $201k (12.5% below list) — sets the bar for 1% rule.
- Cap rate 5.5% vs local median 3.6% in Missouri City — top-decile yield for the area; either an underpriced asset or a hidden risk that comps aren't pricing in. Stress-test before assuming the spread holds.
Location & tenants
- Location reads 67/100 on livability (#526 in TX) — a middle-class / working-renter tenant base. Strengths: housing A+, crime A, employment A; Watch: amenities F, commute F, health & safety F.
- Fort Bend ISD (suburban): math 44% / reading 53% proficiency, ranked #140 of 826 in TX (top 17%) — families likely to look elsewhere, expect single-tenant / working-renter base with shorter leases.
- Zoned schools: Lantern Lane El (math 17% / reading 37%, grade F, #2,791 of 4,322 statewide, top 68%, 472 students, 77% FRL); Quail Valley Middle (math 55% / reading 57%, grade B-, #234 of 1,662 statewide, top 14%, 1,043 students, 45% FRL); Fort Bend Co Alter (26 students, 0% FRL).
- Market conditions: Rents flat; 188 active listings in the ZIP; 8 comparable units currently listed for rent nearby; rentals at typical pace (median 23d on market — plan ~3-4 weeks tenant-placement turnaround); 12,093 units permitted in Fort Bend County in 2024 (815 in 5+ unit buildings).
- This rent runs 32% of the median local income ($75k/yr) — at the standard rent-burdened threshold; future hikes will face affordability resistance.
Forward outlook
- In year one you build about $322 of equity ($2k loan paydown + $-1k appreciation (-0.6% local appreciation)).
- Fort Bend County population projected at +75% by 2050 — long-run rental-demand tailwind backs the buy-and-hold thesis.
Negotiation context
- It's been on market 16 days — a 2% lower offer ($227k) is reasonable based on typical stale-listing flexibility.
- 6 sale attempts since 15y ago; this cycle's ask has dropped $20k (8%) from the opening price — seller is motivated, your offer sets the floor, not the list.
Risks & watch-outs
- Climate carrying-cost: major flood risk; severe wind risk, 99% chance of damaging wind over 30y; extreme-heat days projected 7→23/yr by 2055 (HVAC capex compounding) — expect insurance premiums to compound above CPI over the hold.
Questions for the listing agent
- What do current leases actually rent for vs. the listed asking? Can we see a recent rent roll and the last 12 months of T-12 income?
- Built in 1975 — when were the roof, HVAC, electrical panel, plumbing, and water heater last replaced?
- What does the HOA fee cover, when was the last increase, and are there any pending special assessments or reserve-fund shortfalls?
- Is there a deadline driving the sale (1031 exchange, divorce, estate, relocation)? That informs how much negotiation room exists.
- Schools are B-rated — typically a magnet for longer-tenancy family renters. What's the average tenant stay here, and is there a school-zone premium baked into asking?
- The area grade is low — what's the realistic commute time and amenity access for the typical tenant pool here? Any planned neighborhood developments (good or bad) we should know about?
- What's the average days-on-market for RENTAL listings here right now (not sales)? A rising rental-DOM trend means longer vacancies and softer asking-rent achievability than the comps imply.
- What's the recent tenant-quality profile in this submarket — average credit score on applications, eviction rate, late-payment / NSF rate, and stable-employment percentage? A property-management company in the area should have these aggregated.
- How much new for-sale + rental construction is in the pipeline within 1–3 miles? Heavy new supply typically softens prices + rents 12–24 months out; constrained supply supports both.
Investment metrics
- 1% rule
- 0.88% ✗
- Cap rate
- 5.50%
- Cash-on-cash
- -2.82%
- DSCR
- 0.87
- GRM
- 9.5
CMA / ARV
- ARV (on-the-fly)
- $219,471
- Comps found
- 12
Show comp detail 12 sales within ~0.75 mi
| Address | Dist | Beds/Ba | Sqft | Sold | Price | $/sf | Match |
|---|---|---|---|---|---|---|---|
| 2254 Stillmeadow Dr | 0.03mi | 3/2.0 | 1,528 (+2%) | 3mo | $265,000 | $173 | 92 |
| 2307 Clearbrook Dr | 0.25mi | 3/2.0 | 1,474 (-1%) | 0mo | $247,990 | $168 | 86 |
| 1922 Shady Oaks Ct | 0.27mi | 3/2.0 | 1,509 (+1%) | 5mo | $225,000 | $149 | 82 |
| 2239 Fall Meadow Dr | 0.44mi | 3/2.0 | 1,528 (+2%) | 0mo | $224,900 | $147 | 76 |
| 2119 Mustang Springs Dr | 0.39mi | 3/2.0 | 1,528 (+2%) | 4mo | $245,000 | $160 | 75 |
| 2126 Quail Valley East Dr | 0.46mi | 3/2.0 | 1,536 (+3%) | 1mo | $249,900 | $163 | 73 |
| 2015 Quail Valley East Dr | 0.54mi | 3/2.0 | 1,528 (+2%) | 4mo | $225,000 | $147 | 68 |
| 2230 Fall Meadow Dr | 0.41mi | 3/2.0 | 1,395 (-7%) | 5mo | $185,000 | $133 | 66 |
| 2610 Creekway Cir | 0.58mi | 3/2.0 | 1,576 (+6%) | 4mo | $219,900 | $140 | 60 |
| 3290 Hunters Glen Dr | 0.61mi | 3/2.0 | 1,676 (+12%) | 1mo | $210,000 | $125 | 50 |
| 2211 Cottonwood Ct | 0.72mi | 3/2.0 | 1,674 (+12%) | 7mo | $233,400 | $139 | 40 |
| 2207 Cottonwood Ct | 0.73mi | 3/2.0 | 1,700 (+14%) | 4mo | $225,000 | $132 | 40 |
Match score weights: distance 35% · size 25% · config 20% · recency 20%. Top-matched comps best support the ARV.
Projected returns pro-forma
-0.55% appreciation · 0.34% rent growth · sell at horizon
- IRR
- -9.7%
- Equity multiple
- 0.57×
- Total profit
- $-27,373
- Equity at exit
- $60,517
- IRR
- -5.5%
- Equity multiple
- 0.50×
- Total profit
- $-32,472
- Equity at exit
- $67,913
Cash invested: $64,400 (down + closing). Projections, not guarantees.
Landlord ↔ Tenant lean methodology
- Overall (STATE)
- 87 Strongly Landlord-Friendly
- State Texas
- 87 Strongly Landlord-Friendly · R+5
- County
- — inherits STATE
- City
- — inherits STATE
ZIP-level market 77489
- Home prices YoY
- -0.2%
- Rents YoY
- 0.3%
- Active inventory
- 188
- Price-to-rent
- 9.5×
Monthly cashflow live
- Estimated rent
- $2,013 high interval (Pro) →
- Mortgage (P&I)
- −$1,206
- Tax from tax record
- −$357 /mo · $4,282/yr
- Insurance
- −$96
- HOA
- −$83
- Vacancy / Maint / Mgmt
- −$423
- Net cashflow
- $-151
Break-even live
Sensitivity live
| Price | -10% $-21 | -5% $-86 | +0% $-151 | +5% $-216 | +10% $-281 |
|---|---|---|---|---|---|
| Rent | -10% $-310 | -5% $-231 | +0% $-151 | +5% $-72 | +10% $8 |
| Rate | -1.0pp $-35 | -0.5pp $-93 | base $-151 | +0.5pp $-211 | +1.0pp $-271 |
UW: 25.0% down · 7.5% · 30yr · 1.5% tax · 5.0% vac · 8.0% maint · 8.0% mgmt
Financing live
Cash to close
- Down payment
- $57,500
- Closing costs
- $6,900
- Reserves months
- —
- Total cash needed
- —
Loan-product check · same deal, 3 products live
Conventional
25% down · 7.5% · 30yr
- Down + closing
- —
- Monthly P&I
- —
- Monthly cashflow
- —
- DSCR
- —
- Eligible?
- —
Personal DTI + credit; lowest rate.
DSCR
20% down · 8.5% · 30yr
- Down + closing
- —
- Monthly P&I
- —
- Monthly cashflow
- —
- DSCR
- —
- Eligible?
- —
No personal income docs; deal must DSCR.
Hard money
10% down · 12.0% · 12mo
- Down + closing
- —
- Monthly P&I
- —
- Monthly cashflow
- —
- DSCR
- —
- Eligible?
- —
Short-term bridge; refi at stabilization.
Rent comps 8 comps
| Address | Beds | Baths | Sqft | Rent | $/sqft | DOM | Units | Dist |
|---|---|---|---|---|---|---|---|---|
| 1919 Doliver Cir Missouri City, TX | 3.0 | 2.0 | 1515 | $2,000 | $1.32 | 45d | 1 | 0.27mi |
| 3102 Texas Pkwy Missouri City, TX | 2.0 | 1.0 | 900 | $1,301 | $1.45 | 3d | 3 | 0.65mi |
| 3302 Texas Pkwy Missouri City, TX | 1.0–2.0 | 1.0–2.0 | 800 | $1,302 | $1.63 | 3d | 7 | 0.81mi |
| 3618 Quail Meadow Dr Missouri City, TX | 3.0 | 2.0 | 1618 | $1,966 | $1.22 | 45d | 1 | 0.93mi |
| 2026 Summer Place Dr Missouri City, TX | 3.0 | 2.0 | 1837 | $1,861 | $1.01 | 22d | 1 | 0.95mi |
| 17318 Edgehaven Dr Missouri City, TX | 3.0 | 2.0 | 1448 | $1,695 | $1.17 | 22d | 1 | 1.20mi |
| 22 Chapparal Ct Missouri City, TX | 3.0 | 2.0 | 1504 | $2,000 | $1.33 | 45d | 1 | 1.41mi |
| 1215 New Tree Ln Missouri City, TX | 3.0 | 2.0 | 1323 | $1,725 | $1.30 | 14d | 1 | 1.42mi |
HOA detail
- Monthly dues
- $83 · $996/yr
Listing history 10 events
-
2026-06-21days on market $230,000 Active 16 DOM
-
2026-06-18days on market $230,000 Active 13 DOM
-
2026-06-17days on market $230,000 Active 12 DOM
-
2026-06-16days on market $230,000 Active 11 DOM
-
2026-06-15pricedays on market $230,000 Active 10 DOM
-
2026-06-13days on market $250,000 Active 8 DOM
-
2026-06-09days on market $250,000 Active 4 DOM
-
2026-06-08days on market $250,000 Active 3 DOM
-
2026-06-07remarks 502-char remark
-
2026-06-07$250,000 Active 2 DOM
ⓘ Source: listings_history table (triggers on properties + properties_extension) + one-shot
backfill from property_details.listing_events for pre-trigger history.
Tax reassessment forecast TX · Resets to sale price
- Current annual tax
- $4,282 · $357/mo
- Projected year-2 tax
- $4,282 · $357/mo
- Expected delta
- $0/yr ($0/mo · 0.0%)
ⓘ Screening estimate from a state-policy table — verify with the county assessor before closing.
Climate risk First Street
- Flood 6/10 Major FEMA zone X (unshaded) · 70% chance over 30 yrs
- Wildfire 2/10 Low
- Heat 9/10 Extreme 7 d/yr ≥110°F today · 23 d/yr by 30 yrs out
- Wind 9/10 Extreme 99% chance of damaging wind over 30 yrs
- Air quality 3/10 Moderate 2 unhealthy d/yr today · 3 by 30 yrs out
Nearby sold comps map
Loading sold comps map…
Walkable amenities ~0.75 mi
Loading nearby amenities…
Taxation est. · year 1
- Rental income
- $24,162
- − Mortgage interest
- −$12,884
- − Property taxes
- −$4,282
- − Insurance
- −$1,150
- − Repairs & maintenance
- −$1,933
- − Management
- −$1,933
- − HOA
- −$996
- − Depreciation
- −$6,691
- Taxable loss
- −$5,707
- Est. tax savings @ 24.0%
- +$1,370
- After-tax cash flow
- $-444/yr
For passive investors: Depreciation is non-cash, so a rental often shows a tax loss while cash-flowing — sheltering income. Rental losses are passive: they offset passive income freely, and up to $25,000/yr can offset ordinary (W-2) income if you actively participate and your MAGI is under $100k (phasing out to $0 by $150k); unused losses carry forward. On sale, claimed depreciation is recaptured at up to 25%, and gains may owe capital-gains tax (a 1031 exchange can defer both). Figures are a year-1 estimate at your 24.0% rate — not tax advice; consult a CPA.
Schools (NCES district)
- District
- Fort Bend ISD
- NCES district ID
- 4819650
- Math proficiency
- 44% ▼ -15.00%
- Reading proficiency
- 53% ▼ -4.00%
- Median HH income
- $82,360
- Composite
- 44.61/100
- National rank
- #2779
- State rank
- #140 of 826 in TX
Livability — Missouri City
- Score
- 67/100
- State rank
- #526
- US rank
- #10308
Category grades
Schools grade is shown separately in the Schools card above.
Census & demographics
- Census place
- Missouri City, TX
- County
- Fort Bend County · 836,777 people
- City population
- 123,513
- Metro
- Houston-The Woodlands-Sugar Land, TX
- Population (ZIP)
- 39,292
- Household income
- $74,689
- Rent vs Own
- Severe rent burden
- 1121.0
Population outlook (Fort Bend County) Hauer SSP2
- Today (2025)
- 1,004,526 people
- By 2030
- 1,153,104 · +14.8%
- By 2040
- 1,453,718 · +44.7%
- By 2050
- 1,753,781 · +74.6%
- By 2075
- 2,455,772 · +144.5%
- By 2100
- 2,930,528 · +191.7%
Race, ethnicity, and origin ACS 2023
- Neighborhood character
- Majority Black (60%)
- Race & ethnicity
- Black 60% Hispanic / Latino 29% Two or more races 13% White 4% Asian 3%
- Hispanic origin (detail)
- Mexican 17%
- Foreign-born
- 16% · Canada, Vietnam
- Languages at home
- 73% English-only · Spanish 22% Vietnamese 1% Other Asian/Pacific 1%
Political lean MEDSL · Fort Bend
- 2024 margin
- Toss-up / Even · D 49.5% · R 47.9% · Other 2.6%
- 2008→2024 swing
- +4.0pp toward D · 2008: -2.4pp · 2024: 1.6pp
- All cycles
- 2024: D+1.6 2020: D+10.6 2016: D+6.6 2012: R+6.8 2008: R+2.4
Not yet ingested
- Civics
- —
Market trends
- HPI YoY
- ▼ -0.55%
- Current HPI
- 288.1306
- Rent YoY
- ▲ 0.34%
- Metro
- Houston-The Woodlands-Sugar Land, TX
- State GDP YoY
- ▲ 3.95%
- F500 in state
- 110
Industry mix (Fortune 500 HQ in TX)
| Industry | F500 HQs | Revenue |
|---|---|---|
| Energy | 16 | $1,198B |
|
||
| Technology | 5 | $198B |
|
||
| Engineering / Construction | 4 | $72B |
|
||
| Energy Services | 3 | $60B |
|
||
| Utilities | 3 | $41B |
|
||
| Healthcare | 2 | $330B |
|
||
Price history
+236.9% since first listed22 events — show timeline
- 2026-06-05 Listed $250,000 HARMLS
- 2021-08-11 Sold (Public Records) — Public Records
- 2017-12-06 Sold (Public Records) — Public Records
- 2017-11-30 Sold (MLS) — HARMLS
- 2017-10-20 Pending — HARMLS
- 2017-10-10 Pending — HARMLS
- 2017-10-03 Listed $141,950 HARMLS
- 2017-09-06 Pending — HARMLS
- 2017-08-23 Listing Removed — HARMLS
- 2017-08-17 Relisted — HARMLS
- 2017-08-17 Pending — HARMLS
- 2017-08-06 Pending — HARMLS
- 2017-08-02 Listed $138,250 HARMLS
- 2016-02-05 Sold (Public Records) — Public Records
- 2016-01-15 Sold (MLS) — HARMLS
- 2016-01-02 Pending — HARMLS
- 2015-12-21 Pending — HARMLS
- 2015-12-17 Listed $125,000 HARMLS
- 2012-03-30 Sold (MLS) — HARMLS
- 2012-01-31 Listing Removed — HARMLS
- 2011-11-30 Listed $74,200 HARMLS
- 2000-04-17 Sold (Public Records) — Public Records
Property tax history
+4.8%/yrLatest (2025): $4,282 · -7.8% YoY. Source: county tax records.
Cash-flow waterfall
monthlySold comps — $/sqft
last 12 mo · ≤1 miLoading sold comps…