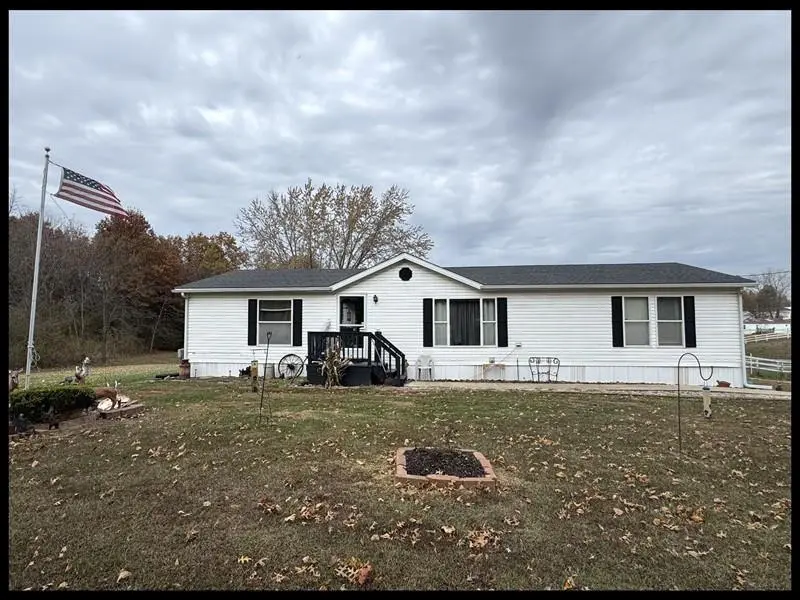
409 W Marion St · Atlanta, MO
Flood risk 1/10 · Minimal
- FEMA flood zone
- X (unshaded)
- Chance of flooding over 30 yrs
- 0.0%
- Est. flood insurance / yr
- $507 – $1,088
Fire risk 4/10 · Minor
- Est. fire insurance / yr
- $1,054 – $1,958
Heat risk 3/10 · Minor
- Hot days now (above 107°F)
- 7 days/yr
- Hot days in 30 yrs
- 16 days/yr
Wind risk 2/10 · Minimal
- Chance of severe wind over 30 yrs
- —
Air-quality risk 2/10 · Minimal
- Unhealthy air days now
- 1 days/yr
- Unhealthy air days in 30 yrs
- 2 days/yr
Risk factors via First Street. Map © Google.
Why this score? — see what drove the D grade
The composite is a weighted blend of 9 inputs, each scored 0–100. Each bar is that input's sub-score; the figure is the points it added to the 100-point composite (weight × sub-score).
- Cash flow +8.9/30.0
- ARV discount +7.5/15.0
- Schools +5.9/10.0
- Appreciation +5.7/10.0
- Livability +3.0/5.0
- DSCR +2.5/10.0
- Rent growth +2.5/5.0
- Condition / age +2.5/5.0
- 1% rule +1.7/10.0
$169,000
🖨 Deal sheet (PDF) 📄 Offer letter ✓ Due diligence
Listing remarks
Enjoy the peace & privacy of a quiet setting on the edge of town w/ this week-kept 3 bdrm, 2 bath manufactured home situated on a generous 2-acre corner lot. The home features an inviting open layout with comfort & functionality perfect for everyday living or entertaining. Outdoors, you'll find a 30x40 metal outbuilding, ideal for a workshop, storage, or hobby use, along w/ fencing designed to accommodate horses or small livestock. A scenic pond adds to the tranquil atmosphere, while multiple smaller outbuildings provide plenty of additional storage or project space. This property offers the perfect blend of convenience & peaceful living ideal for those looking for space,
Key facts
- Scenic pond
- Fencing for horses
- 2 acre corner lot
Tags
Property features AI
Exterior
- Parking: Detached 2-car garage
- Utilities: Public water; Public sewer; Cable available
- Home design: Single family residence; Residential property
- Construction: Vinyl siding; Asphalt roof
- Exterior features: Deck; Storm door(s); Wood fencing; Pond
Interior
- Kitchen: Dishwasher; Electric oven; Electric range; Refrigerator
- Flooring: Vinyl
- Bathrooms: 2 full bathrooms
- Heating & cooling: Electric heating; Central air; Ceiling fan(s)
- Interior features: Fireplace (1); Crawl space basement
- Laundry & utility: Washer; Dryer; Electric water heater
Neighborhood map
What this means for you Summary
Snapshot
- This is a 3-bed/2.0-bath manufactured listed at $169k.
Deal economics
- At list price, monthly cash flow is $-135 ($-2k/yr) — negative.
- To cash-flow at today's rent, offer at most $145k (14.1% below list).
- To meet the 1% rule (rent ≥ 1% of price), the offer needs to be $114k (32.8% below list).
- Recommended offer: $114k (32.8% below list) — sets the bar for 1% rule.
Location & tenants
- Location reads 59/100 on livability (#554 in MO) — a working-class tenant base; expect higher turnover. Strengths: cost of living A+, housing A+, schools B; Watch: crime F, amenities F, commute F.
- Atlanta C-3 (rural): math 70% / reading 70% proficiency, ranked #10 of 535 in MO (top 2%) — strong family-tenant draw, lease renewals of 3-5y typical.
- Market conditions: 3 active listings in the ZIP; 26 units permitted in Macon County in 2024 (19 in 5+ unit buildings).
Forward outlook
- In year one you build about $3k of equity ($1k loan paydown + $2k appreciation (1.4% local appreciation)).
- Macon County population projected at -17% by 2050 — secular population decline; favor cash flow + early exit over multi-decade hold.
- By year 9, paydown + projected appreciation supports a ~$31k cash-out refi (75% LTV) — recoverable capital for the next deal without selling this one.
Negotiation context
- It's been on market 60 days — a 3% lower offer ($164k) is reasonable based on typical stale-listing flexibility.
- 2 sale attempts with the ask held roughly flat each time — persistent listings suggest the price (not the market) is what's stuck; bring a comps-based counter.
Questions for the listing agent
- What do current leases actually rent for vs. the listed asking? Can we see a recent rent roll and the last 12 months of T-12 income?
- It's been on market 60 days. Have you received any prior offers? Is the seller open to a 33% concession, seller financing, or rate buy-down credit?
- Is there a deadline driving the sale (1031 exchange, divorce, estate, relocation)? That informs how much negotiation room exists.
- Schools are B-rated — typically a magnet for longer-tenancy family renters. What's the average tenant stay here, and is there a school-zone premium baked into asking?
- Crime grade is F in this area — have there been break-ins, vandalism, or insurance claims at this property in the last 3 years? What carrier currently insures it and at what premium?
- The area grade is low — what's the realistic commute time and amenity access for the typical tenant pool here? Any planned neighborhood developments (good or bad) we should know about?
- What's the average days-on-market for RENTAL listings here right now (not sales)? A rising rental-DOM trend means longer vacancies and softer asking-rent achievability than the comps imply.
- What's the recent tenant-quality profile in this submarket — average credit score on applications, eviction rate, late-payment / NSF rate, and stable-employment percentage? A property-management company in the area should have these aggregated.
- How much new for-sale + rental construction is in the pipeline within 1–3 miles? Heavy new supply typically softens prices + rents 12–24 months out; constrained supply supports both.
Investment metrics
- 1% rule
- 0.67% ✗
- Cap rate
- 5.34%
- Cash-on-cash
- -3.42%
- DSCR
- 0.85
- GRM
- 12.4
CMA / ARV
No comps found within radius.
Projected returns pro-forma
1.35% appreciation · 3.0% rent growth · sell at horizon
- IRR
- -1.0%
- Equity multiple
- 0.95×
- Total profit
- $-2,560
- Equity at exit
- $60,806
- IRR
- 3.6%
- Equity multiple
- 1.46×
- Total profit
- $21,845
- Equity at exit
- $83,270
Cash invested: $47,320 (down + closing). Projections, not guarantees.
Landlord ↔ Tenant lean methodology
- Overall (STATE)
- 81 Strongly Landlord-Friendly
- State Missouri
- 81 Strongly Landlord-Friendly · R+10
- County
- — inherits STATE
- City
- — inherits STATE
ZIP-level market 63530
- Home prices YoY
- 1.2%
- Active inventory
- 3
- Price-to-rent
- 12.4×
Monthly cashflow live
- Estimated rent
- $1,136 medium interval (Pro) →
- Mortgage (P&I)
- −$886
- Tax from tax record
- −$75 /mo · $902/yr
- Insurance
- −$70
- HOA
- −$0
- Vacancy / Maint / Mgmt
- −$238
- Net cashflow
- $-135
Break-even live
Sensitivity live
| Price | -10% $-39 | -5% $-87 | +0% $-135 | +5% $-183 | +10% $-230 |
|---|---|---|---|---|---|
| Rent | -10% $-224 | -5% $-180 | +0% $-135 | +5% $-90 | +10% $-45 |
| Rate | -1.0pp $-50 | -0.5pp $-92 | base $-135 | +0.5pp $-179 | +1.0pp $-223 |
UW: 25.0% down · 7.5% · 30yr · 1.5% tax · 5.0% vac · 8.0% maint · 8.0% mgmt
Financing live
Cash to close
- Down payment
- $42,250
- Closing costs
- $5,070
- Reserves months
- —
- Total cash needed
- —
Loan-product check · same deal, 3 products live
Conventional
25% down · 7.5% · 30yr
- Down + closing
- —
- Monthly P&I
- —
- Monthly cashflow
- —
- DSCR
- —
- Eligible?
- —
Personal DTI + credit; lowest rate.
DSCR
20% down · 8.5% · 30yr
- Down + closing
- —
- Monthly P&I
- —
- Monthly cashflow
- —
- DSCR
- —
- Eligible?
- —
No personal income docs; deal must DSCR.
Hard money
10% down · 12.0% · 12mo
- Down + closing
- —
- Monthly P&I
- —
- Monthly cashflow
- —
- DSCR
- —
- Eligible?
- —
Short-term bridge; refi at stabilization.
Listing history 19 events
-
2026-06-21days on market $169,000 Active 60 DOM
-
2026-06-21days on market $169,000 Active 59 DOM
-
2026-06-18days on market $169,000 Active 57 DOM
-
2026-06-17days on market $169,000 Active 56 DOM
-
2026-06-16days on market $169,000 Active 55 DOM
-
2026-06-15days on market $169,000 Active 54 DOM
-
2026-06-13days on market $169,000 Active 52 DOM
-
2026-06-12days on market $169,000 Active 51 DOM
-
2026-06-09days on market $169,000 Active 48 DOM
-
2026-06-08days on market $169,000 Active 47 DOM
-
2026-06-07days on market $169,000 Active 46 DOM
-
2026-06-05days on market $169,000 Active 44 DOM
-
2026-06-04days on market $169,000 Active 42 DOM
-
2026-06-02days on market $169,000 Active 41 DOM
-
2026-06-01days on market $169,000 Active 40 DOM
-
2026-05-31days on market $169,000 Active 39 DOM
-
2026-04-22$169,000 Active
-
2026-01-29status Pending
-
2025-11-14$179,900 Active
ⓘ Source: listings_history table (triggers on properties + properties_extension) + one-shot
backfill from property_details.listing_events for pre-trigger history.
Tax reassessment forecast MO · Resets to sale price
- Current annual tax
- $902 · $75/mo
- Projected year-2 tax
- $1,639 · $137/mo
- Expected delta
- +$738/yr (+$61/mo · 81.8%)
ⓘ Screening estimate from a state-policy table — verify with the county assessor before closing.
Climate risk First Street
- Flood 1/10 Low FEMA zone X (unshaded) · 0% chance over 30 yrs
- Wildfire 4/10 Moderate
- Heat 3/10 Moderate 7 d/yr ≥107°F today · 16 d/yr by 30 yrs out
- Wind 2/10 Low
- Air quality 2/10 Low 1 unhealthy d/yr today · 2 by 30 yrs out
Nearby sold comps map
Loading sold comps map…
Walkable amenities ~0.75 mi
Loading nearby amenities…
Taxation est. · year 1
- Rental income
- $13,627
- − Mortgage interest
- −$9,467
- − Property taxes
- −$902
- − Insurance
- −$845
- − Repairs & maintenance
- −$1,090
- − Management
- −$1,090
- − Depreciation
- −$4,916
- Taxable loss
- −$4,683
- Est. tax savings @ 24.0%
- +$1,124
- After-tax cash flow
- $-493/yr
For passive investors: Depreciation is non-cash, so a rental often shows a tax loss while cash-flowing — sheltering income. Rental losses are passive: they offset passive income freely, and up to $25,000/yr can offset ordinary (W-2) income if you actively participate and your MAGI is under $100k (phasing out to $0 by $150k); unused losses carry forward. On sale, claimed depreciation is recaptured at up to 25%, and gains may owe capital-gains tax (a 1031 exchange can defer both). Figures are a year-1 estimate at your 24.0% rate — not tax advice; consult a CPA.
Schools (NCES district)
- District
- Atlanta C-3
- NCES district ID
- 2903480
- Math proficiency
- 70% ▲ 5.00%
- Reading proficiency
- 70% ▬ 0.00%
- Median HH income
- $38,082
- Composite
- 59.43/100
- National rank
- #1896
- State rank
- #10 of 535 in MO
Livability — Atlanta
- Score
- 59/100
- State rank
- #554
- US rank
- #20299
Category grades
Schools grade is shown separately in the Schools card above.
Census & demographics
- Census place
- Atlanta, MO
- Population (ZIP)
- 1,310
Population outlook (Macon County) Hauer SSP2
- Today (2025)
- 14,692 people
- By 2030
- 14,209 · -3.3%
- By 2040
- 13,197 · -10.2%
- By 2050
- 12,160 · -17.2%
- By 2075
- 9,745 · -33.7%
- By 2100
- 7,314 · -50.2%
Race, ethnicity, and origin ACS 2023
- Neighborhood character
- Predominantly White (93%)
- Race & ethnicity
- White 93% Black 3% Two or more races 3%
- Common ancestry
- Italian 3% Iranian 1% Romanian 1%
- Foreign-born
- 0%
- Languages at home
- 93% English-only · German/W. Germanic 7%
Political lean MEDSL · Macon
- 2024 margin
- Solid R (+61.5) · D 18.9% · R 80.4%
- 2008→2024 swing
- -37.4pp toward R · 2008: -24.1pp · 2024: -61.5pp
- All cycles
- 2024: R+61.5 2020: R+56.3 2016: R+56.4 2012: R+33.4 2008: R+24.1
Not yet ingested
- Civics
- —
Market trends
- HPI YoY
- ▲ 1.35%
- Current HPI
- 109.8414
- Rent YoY
- —
- Metro
- —
- State GDP YoY
- ▲ 1.84%
- F500 in state
- 20
Industry mix (Fortune 500 HQ in MO)
| Industry | F500 HQs | Revenue |
|---|---|---|
| Healthcare | 1 | $163B |
|
||
| Insurance | 1 | $21B |
|
||
| Industrial Technology | 1 | $17B |
|
||
| Retail | 1 | $16B |
|
||
| Industrial Distribution | 1 | $10B |
|
||
| Utilities | 1 | $9B |
|
||
Price history
-6.1% since first listed3 events — show timeline
- 2026-04-22 Listed $169,000 NECAR
- 2026-01-29 Pending — NECAR
- 2025-11-14 Listed $179,900 NECAR
Property tax history
+3.0%/yrLatest (2025): $902 · +11.6% YoY. Source: county tax records.
Cash-flow waterfall
monthlySold comps — $/sqft
last 12 mo · ≤1 miLoading sold comps…