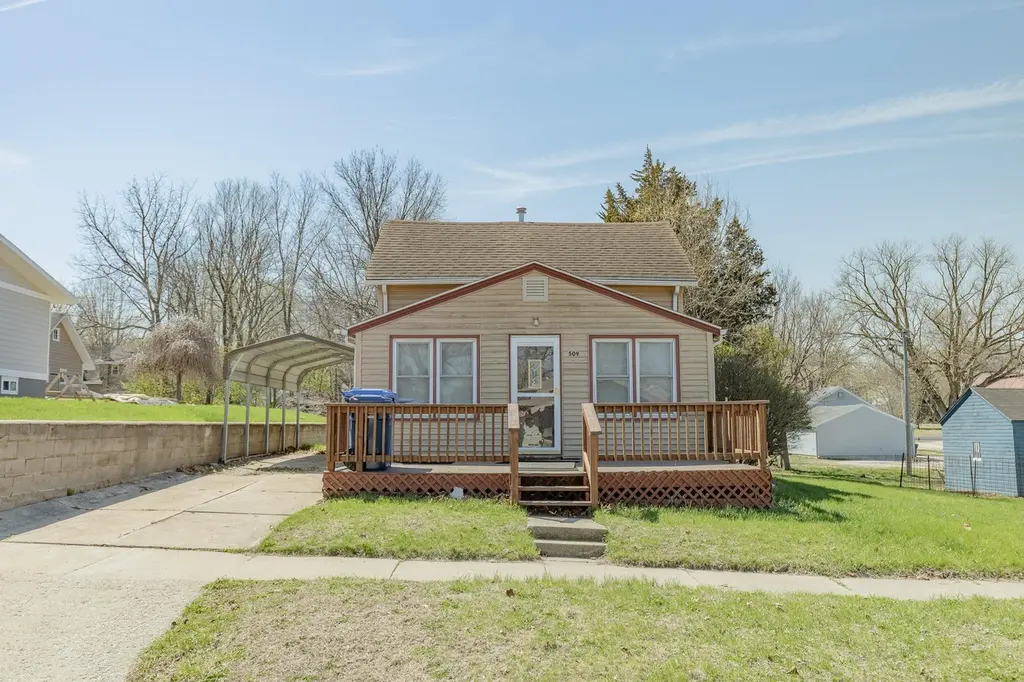
509 Main St · Sioux Rapids, IA
Flood risk 1/10 · Minimal
- FEMA flood zone
- X (unshaded)
- Chance of flooding over 30 yrs
- 0.0%
- Est. flood insurance / yr
- $473 – $860
Fire risk 4/10 · Minor
- Est. fire insurance / yr
- $902 – $1,676
Heat risk 2/10 · Minimal
- Hot days now (above 99°F)
- 7 days/yr
- Hot days in 30 yrs
- 16 days/yr
Wind risk 2/10 · Minimal
- Chance of severe wind over 30 yrs
- —
Air-quality risk 1/10 · Minimal
- Unhealthy air days now
- 0 days/yr
- Unhealthy air days in 30 yrs
- 0 days/yr
Risk factors via First Street. Map © Google.
Why this score? — see what drove the A grade
The composite is a weighted blend of 9 inputs, each scored 0–100. Each bar is that input's sub-score; the figure is the points it added to the 100-point composite (weight × sub-score).
- Cash flow +30.0/30.0
- ARV discount +15.0/15.0
- DSCR +10.0/10.0
- 1% rule +9.7/10.0
- Appreciation +6.5/10.0
- Schools +5.9/10.0
- Livability +3.5/5.0
- Rent growth +2.5/5.0
- Condition / age +2.5/5.0
$62,000
🖨 Deal sheet 📄 Offer letter ✓ Due diligence
Listing remarks
Charming and affordable 2-bedroom, with a possible 3rd non conforming upstairs, 1-bath home located in Sioux Rapids. This property features low-maintenance vinyl siding and vinyl windows, along with a carport for convenient covered parking. Enjoy the enclosed front porch and front deck—perfect for relaxing or entertaining. Inside, you’ll find a functional layout with main floor laundry, and all appliances included for added convenience. Recent updates include a newer AC and furnace, as well as an updated electric breaker panel. The roof was reshingled prior to the current owner’s purchase. Whether you’re looking for a great first home or a solid rental investment, th
Key facts
- Vinyl windows
- Front deck
- Carport
Tags
Property features AI
Finance
- Other: Lot dimensions approximately 45 x 132; Lot size approximately 0.14 acres
Exterior
- Parking: Attached or detached garage not specified with 1 garage space
- Utilities: Public water; Public sewer
- Home design: Single-family residence; One and one-half level; One story total
- Construction: Vinyl siding
- Exterior features: Deck
Interior
- Bathrooms: One three-quarter bathroom
- Heating & cooling: Natural gas forced air heating
- Interior features: Gas water heater; Full basement
Neighborhood map
What this means for you Summary
Snapshot
- This is a 3-bed/1.0-bath single-family listed at $62k.
Deal economics
- At list price, monthly cash flow is $313 ($4k/yr) — positive.
- The deal already cash-flows at list — no discount required.
- Meets the 1% rule at list price ($909 rent vs $62k).
- Recommended offer: $61k (1.5% below list) — sets the bar for market timing.
Location & tenants
- Location reads 69/100 on livability (#419 in IA) — a middle-class / working-renter tenant base. Strengths: cost of living A+, housing A+, schools B+; Watch: health & safety D, amenities F, commute F.
- Sioux Central Community School District (rural): math 68% / reading 73% proficiency, ranked #143 of 289 in IA (top 50%) — strong family-tenant draw, lease renewals of 3-5y typical.
- Market conditions: 5 active listings in the ZIP; 164 units permitted in Buena Vista County in 2024 (71 in 5+ unit buildings).
Forward outlook
- In year one you build about $2k of equity ($429 loan paydown + $2k appreciation (3.0% local appreciation)).
- Buena Vista County population projected at +12% by 2050 — modest demand growth; plan on rents tracking national, not racing it.
- At projected returns (3.0% appreciation + 3.0% rent growth), your $17k cash investment doubles in ~3 years — after that, you're playing with house money.
Negotiation context
- It's been on market 24 days — a 2% lower offer ($61k) is reasonable based on typical stale-listing flexibility.
Risks & watch-outs
- Watch-outs: built in 1920 — expect roof / HVAC / electrical / plumbing capex.
Questions for the listing agent
- Built in 1920 — when were the roof, HVAC, electrical panel, plumbing, and water heater last replaced?
- Is there a deadline driving the sale (1031 exchange, divorce, estate, relocation)? That informs how much negotiation room exists.
- Schools are B-rated — typically a magnet for longer-tenancy family renters. What's the average tenant stay here, and is there a school-zone premium baked into asking?
- What's the average days-on-market for RENTAL listings here right now (not sales)? A rising rental-DOM trend means longer vacancies and softer asking-rent achievability than the comps imply.
- What's the recent tenant-quality profile in this submarket — average credit score on applications, eviction rate, late-payment / NSF rate, and stable-employment percentage? A property-management company in the area should have these aggregated.
- How much new for-sale + rental construction is in the pipeline within 1–3 miles? Heavy new supply typically softens prices + rents 12–24 months out; constrained supply supports both.
Investment metrics
- 1% rule
- 1.47% ✓
- Cap rate
- 12.34%
- Cash-on-cash
- 21.60%
- DSCR
- 1.96
- GRM
- 5.7
CMA / ARV
- ARV (median comp)
- $116,940
- List price
- $62,000
- Delta
- -46.98%
- Verdict
- UNDERPRICED
- Comps
- 4 within 1.0 mi
Show comp detail 2 sales within ~0.75 mi
| Address | Dist | Beds/Ba | Sqft | Sold | Price | $/sf | Match |
|---|---|---|---|---|---|---|---|
| 509 Main St | 0.00mi | 3/1.0 | 824 (0%) | 0mo | $62,000 | $75 | 100 |
| 507 1st St | 0.32mi | 2/1.0 (-1) | 784 (-5%) | 20mo | $45,000 | $57 | 55 |
Match score weights: distance 35% · size 25% · config 20% · recency 20%. Top-matched comps best support the ARV.
Projected returns pro-forma
3.01% appreciation · 3.0% rent growth · sell at horizon
- IRR
- 27.9%
- Equity multiple
- 2.58×
- Total profit
- $27,415
- Equity at exit
- $27,921
- IRR
- 28.4%
- Equity multiple
- 5.01×
- Total profit
- $69,657
- Equity at exit
- $43,064
Cash invested: $17,360 (down + closing). Projections, not guarantees.
Landlord ↔ Tenant lean methodology
- Overall (STATE)
- 83 Strongly Landlord-Friendly
- State Iowa
- 83 Strongly Landlord-Friendly · R+6
- County
- — inherits STATE
- City
- — inherits STATE
ZIP-level market 50585
- Home prices YoY
- 1.8%
- Active inventory
- 5
- Price-to-rent
- 5.7×
Monthly cashflow live
- Estimated rent
- $909 medium interval (Pro) →
- Mortgage (P&I)
- −$325
- Tax from tax record
- −$55 /mo · $656/yr
- Insurance
- −$26
- HOA
- −$0
- Vacancy / Maint / Mgmt
- −$191
- Net cashflow
- $313
Break-even live
UW: 25.0% down · 7.5% · 30yr · 1.5% tax · 5.0% vac · 8.0% maint · 8.0% mgmt
Financing live
Cash to close
- Down payment
- $15,500
- Closing costs
- $1,860
- Reserves months
- —
- Total cash needed
- —
Loan-product check · same deal, 3 products live
Conventional
25% down · 7.5% · 30yr
- Down + closing
- —
- Monthly P&I
- —
- Monthly cashflow
- —
- DSCR
- —
- Eligible?
- —
Personal DTI + credit; lowest rate.
DSCR
20% down · 8.5% · 30yr
- Down + closing
- —
- Monthly P&I
- —
- Monthly cashflow
- —
- DSCR
- —
- Eligible?
- —
No personal income docs; deal must DSCR.
Hard money
10% down · 12.0% · 12mo
- Down + closing
- —
- Monthly P&I
- —
- Monthly cashflow
- —
- DSCR
- —
- Eligible?
- —
Short-term bridge; refi at stabilization.
Listing history 5 events
-
2026-05-18status Pending 750-char remark
-
2026-05-04historical Active Under Contract 750-char remark
-
2026-04-24$62,000 Active 750-char remark
-
2021-11-15soldstatus $46,500
-
2019-07-29soldstatus $33,000
ⓘ Source: listings_history table (triggers on properties + properties_extension) + one-shot
backfill from property_details.listing_events for pre-trigger history.
Tax reassessment forecast IA · Partial reset (capped growth)
- Current annual tax
- $656 · $55/mo
- Projected year-2 tax
- $815 · $68/mo
- Expected delta
- +$159/yr (+$13/mo · 24.2%)
ⓘ Screening estimate from a state-policy table — verify with the county assessor before closing.
Climate risk First Street
- Flood 1/10 Low FEMA zone X (unshaded) · 0% chance over 30 yrs
- Wildfire 4/10 Moderate
- Heat 2/10 Low 7 d/yr ≥99°F today · 16 d/yr by 30 yrs out
- Wind 2/10 Low
- Air quality 1/10 Low 0 unhealthy d/yr today · 0 by 30 yrs out
Nearby sold comps map
Loading sold comps map…
Walkable amenities ~0.75 mi
Loading nearby amenities…
Taxation est. · year 1
- Rental income
- $10,909
- − Mortgage interest
- −$3,473
- − Property taxes
- −$656
- − Insurance
- −$310
- − Repairs & maintenance
- −$873
- − Management
- −$873
- − Depreciation
- −$1,804
- Taxable income
- $2,921
- Est. tax owed @ 24.0%
- −$701
- After-tax cash flow
- $3,050/yr
For passive investors: Depreciation is non-cash, so a rental often shows a tax loss while cash-flowing — sheltering income. Rental losses are passive: they offset passive income freely, and up to $25,000/yr can offset ordinary (W-2) income if you actively participate and your MAGI is under $100k (phasing out to $0 by $150k); unused losses carry forward. On sale, claimed depreciation is recaptured at up to 25%, and gains may owe capital-gains tax (a 1031 exchange can defer both). Figures are a year-1 estimate at your 24.0% rate — not tax advice; consult a CPA.
Schools (NCES district)
- District
- Sioux Central Community School District
- NCES district ID
- 1900023
- Math proficiency
- 68% ▼ -4.00%
- Reading proficiency
- 73% ▼ -3.00%
- Median HH income
- $47,122
- Composite
- 59.49/100
- National rank
- #922
- State rank
- #143 of 289 in IA
Livability — Sioux Rapids
- Score
- 69/100
- State rank
- #419
- US rank
- #9052
Category grades
Schools grade is shown separately in the Schools card above.
Census & demographics
- Census place
- Sioux Rapids, IA
- Population (ZIP)
- 1,165
Population outlook (Buena Vista County) Hauer SSP2
- Today (2025)
- 20,775 people
- By 2030
- 21,101 · +1.6%
- By 2040
- 21,955 · +5.7%
- By 2050
- 23,202 · +11.7%
- By 2075
- 27,159 · +30.7%
- By 2100
- 29,578 · +42.4%
Race, ethnicity, and origin ACS 2023
- Neighborhood character
- Predominantly White (86%)
- Race & ethnicity
- White 86% Hispanic / Latino 12% Two or more races 7%
- Hispanic origin (detail)
- Mexican 12%
- Common ancestry
- Portuguese 7% Iranian 6% Slovak 1%
- Foreign-born
- 4% · Canada
- Languages at home
- 90% English-only · Spanish 10%
Political lean MEDSL · Buena Vista
- 2024 margin
- Solid R (+33.3) · D 32.8% · R 66.0% · Other 1.2%
- 2008→2024 swing
- -31.5pp toward R · 2008: -1.8pp · 2024: -33.3pp
- All cycles
- 2024: R+33.3 2020: R+25.6 2016: R+25.0 2012: R+10.4 2008: R+1.8
Not yet ingested
- Civics
- —
Market trends
- HPI YoY
- ▲ 3.01%
- Current HPI
- 174.4794
- Rent YoY
- —
- Metro
- —
- State GDP YoY
- ▲ 2.48%
- F500 in state
- 4
Industry mix (Fortune 500 HQ in IA)
| Industry | F500 HQs | Revenue |
|---|---|---|
| Financial Services | 1 | $16B |
|
||
| Retail / Convenience | 1 | $15B |
|
||
Price history
+87.9% since first listed6 events — show timeline
- 2026-06-15 Sold (MLS) $62,000 Iowa Great Lakes BOR
- 2026-05-18 Pending — Iowa Great Lakes BOR
- 2026-05-04 Contingent — Iowa Great Lakes BOR
- 2026-04-24 Listed $62,000 Iowa Great Lakes BOR
- 2021-11-15 Sold (Public Records) $46,500 Public Records
- 2019-07-29 Sold (Public Records) $33,000 Public Records
Property tax history
+9.0%/yrLatest (2025): $656 · +1.2% YoY. Source: county tax records.
Cash-flow waterfall
monthlySold comps — $/sqft
last 12 mo · ≤1 miLoading sold comps…