 🏷️ Likely Rental
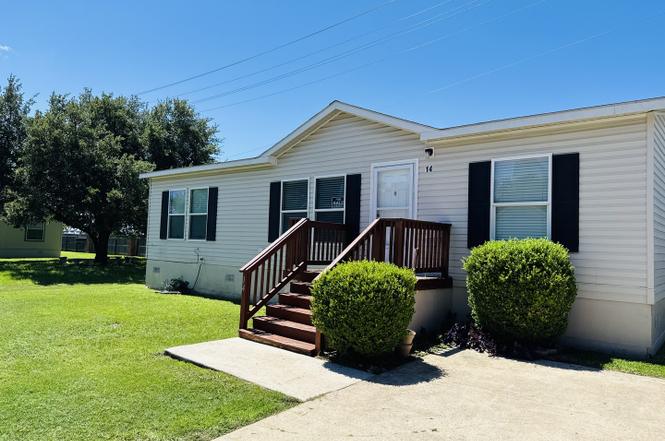
11555 LOT 14 Culebra · San Antonio, TX
Flood risk No data
- FEMA flood zone
- —
- Chance of flooding over 30 yrs
- —
- Est. flood insurance / yr
- —
Fire risk No data
- Est. fire insurance / yr
- —
Heat risk No data
- Hot days now (above threshold)
- —
- Hot days in 30 yrs
- —
Wind risk No data
- Chance of severe wind over 30 yrs
- —
Air-quality risk No data
- Unhealthy air days now
- —
- Unhealthy air days in 30 yrs
- —
Risk factors via First Street. Map © Google.
Why this score? — see what drove the C+ grade
The composite is a weighted blend of 9 inputs, each scored 0–100. Each bar is that input's sub-score; the figure is the points it added to the 100-point composite (weight × sub-score).
- Cash flow +24.3/30.0
- 1% rule +10.0/10.0
- DSCR +7.8/10.0
- ARV discount +7.5/15.0
- Livability +4.0/5.0
- Condition / age +3.8/5.0
- Rent growth +2.2/5.0
- Schools +1.4/10.0
- Appreciation +0.0/10.0
$60,000
🖨 Deal sheet 📄 Offer letter ✓ Due diligence
Listing remarks
Location, location location! Come out to discover this great home is located on the vibrant NW side of San Antonio. This open concept home, made in 2010,by CMH Manufacturing Inc. is great for entertaining. The Home does have a 2-car parking pad. The Alamo Ranch area has lots of restaurants, shopping, entertainment, and much more. Just down the road from Taft high school. Enjoy access to the great amenities like the Pool, Park and more. Every person over 18 needs to go through a background check, have a valid I. D and social security number in order to live in this neighborhood. an 8x10 storage unit included in price.
Key facts
- Open concept
- Access to amenities
- Pool
Tags
Property features AI
Finance
- Other: Subdivision: Stonebridge
- Financial info: Not a down payment resource participant
- HOA & community: Mandatory HOA; HOA dues $825 monthly; Association transfer fee $100
Exterior
- Utilities: Public water system; Public sewer system
- Home design: Pre-owned property; Approximate age: 16 years
- Construction: Composition roof; Other foundation (see remarks)
- Exterior features: Community pool; Clubhouse; Park/playground; Siding exterior
Interior
- Kitchen: Kitchen (13 x 12); Microwave
- Bedrooms: Master bedroom on lower level (14 x 13); Bedroom 2 (12 x 11); Bedroom 3 (13 x 11)
- Flooring: Linoleum flooring; Vinyl flooring
- Bathrooms: 2 full bathrooms; Master bath with shower only (5 x 8)
- Heating & cooling: Central heating (electric); Central air conditioning
- Interior features: Ceiling fans; All window coverings remain; 1 living area
Neighborhood map
What this means for you Summary
Snapshot
- This is a 3-bed/2.0-bath single-family listed at $60k. Condition is rated good.
Deal economics
- At list price, monthly cash flow is $120 ($1k/yr) — positive.
- The deal already cash-flows at list — no discount required.
- Meets the 1% rule at list price ($2k rent vs $60k).
- Recommended offer: $59k (1.5% below list) — sets the bar for market timing.
- Cap rate 8.7% vs local median 3.8% in San Antonio — top-decile yield for the area; either an underpriced asset or a hidden risk that comps aren't pricing in. Stress-test before assuming the spread holds.
Location & tenants
- Location reads 80/100 on livability (#31 in TX, #1,616 nationally) — a professional / high-income tenant draw. Strengths: amenities A+, commute A+, cost of living A+; Watch: schools C-, crime F.
- San Antonio ISD (urban): math 12% / reading 22% proficiency, ranked #805 of 826 in TX (top 98%) — low school quality limits family demand, transient renter base, plan for 1-2y turnover; 80% free/reduced lunch — lower-income household profile, screen leases tightly.
- Market conditions: Rents soft (-1.1%/yr); 697 active listings in the ZIP; 40 comparable units currently listed for rent nearby; rentals at typical pace (median 24d on market — plan ~3-4 weeks tenant-placement turnaround); solid renter incomes; 8,308 units permitted in Bexar County in 2024 (2,506 in 5+ unit buildings).
Forward outlook
- Local home prices are declining (-3.0%/yr); year-one equity from $415 of loan paydown is wiped out by about $2k of value loss. Plan a longer hold.
- Bexar County population projected at +50% by 2050 — long-run rental-demand tailwind backs the buy-and-hold thesis.
Negotiation context
- It's been on market 15 days — a 2% lower offer ($59k) is reasonable based on typical stale-listing flexibility.
Risks & watch-outs
- Watch-outs: HOA is 48% of rent.
Questions for the listing agent
- What does the HOA fee cover, when was the last increase, and are there any pending special assessments or reserve-fund shortfalls?
- Is there a deadline driving the sale (1031 exchange, divorce, estate, relocation)? That informs how much negotiation room exists.
- Crime grade is F in this area — have there been break-ins, vandalism, or insurance claims at this property in the last 3 years? What carrier currently insures it and at what premium?
- What's the average days-on-market for RENTAL listings here right now (not sales)? A rising rental-DOM trend means longer vacancies and softer asking-rent achievability than the comps imply.
- What's the recent tenant-quality profile in this submarket — average credit score on applications, eviction rate, late-payment / NSF rate, and stable-employment percentage? A property-management company in the area should have these aggregated.
- How much new for-sale + rental construction is in the pipeline within 1–3 miles? Heavy new supply typically softens prices + rents 12–24 months out; constrained supply supports both.
Investment metrics
- 1% rule
- 2.87% ✓
- Cap rate
- 8.70%
- Cash-on-cash
- 8.61%
- DSCR
- 1.38
- GRM
- 2.9
CMA / ARV
- ARV (on-the-fly)
- $194,480
- Comps found
- 12
Show comp detail 12 sales within ~0.75 mi
| Address | Dist | Beds/Ba | Sqft | Sold | Price | $/sf | Match |
|---|---|---|---|---|---|---|---|
| 1114 W Myrtle | 0.19mi | 2/2.0 (-1) | 1,080 (-6%) | 1mo | $199,999 | $185 | 76 |
| 117 Nesbit | 0.27mi | 3/2.0 | 1,043 (-9%) | 1mo | $150,000 | $144 | 72 |
| 2213 N Flores | 0.35mi | 3/2.0 | 1,195 (+4%) | 10mo | $149,900 | $125 | 68 |
| 823 W French | 0.50mi | 3/1.0 | 1,226 (+7%) | 12mo | $150,000 | $122 | 51 |
| 1129 N Smith St | 0.49mi | 3/1.0 | 1,036 (-9%) | 10mo | $170,000 | $164 | 49 |
| 520 Cincinnati | 0.74mi | 3/2.0 | 1,216 (+6%) | 12mo | $244,999 | $201 | 44 |
| 113 Yale Ave | 0.45mi | 3/2.0 | 1,314 (+15%) | 13mo | $334,000 | $254 | 43 |
| 115 Harvard Ter | 0.75mi | 2/1.0 (-1) | 1,106 (-3%) | 12mo | $179,000 | $162 | 40 |
| 310 W Evergreen St #125 | 0.51mi | 2/2.0 (-1) | 1,268 (+11%) | 23mo | $375,000 | $296 | 34 |
| 711 Ruiz St | 0.71mi | 2/1.0 (-1) | 1,057 (-8%) | 16mo | $179,900 | $170 | 32 |
| 426 Cincinnati Ave | 0.64mi | 2/1.0 (-1) | 1,050 (-8%) | 19mo | $103,000 | $98 | 32 |
| 623 Ogden St | 0.73mi | 2/1.5 (-1) | 1,024 (-10%) | 20mo | $268,000 | $262 | 25 |
Match score weights: distance 35% · size 25% · config 20% · recency 20%. Top-matched comps best support the ARV.
Projected returns pro-forma
-3.0% appreciation · 0.0% rent growth · sell at horizon
- IRR
- -11.6%
- Equity multiple
- 0.61×
- Total profit
- $-6,562
- Equity at exit
- $8,946
- IRR
- -31.0%
- Equity multiple
- 0.22×
- Total profit
- $-13,167
- Equity at exit
- $5,188
Cash invested: $16,800 (down + closing). Projections, not guarantees.
Landlord ↔ Tenant lean methodology
- Overall (STATE)
- 87 Strongly Landlord-Friendly
- State Texas
- 87 Strongly Landlord-Friendly · R+5
- County
- — inherits STATE
- City
- — inherits STATE
ZIP-level market 78253
- Home prices YoY
- -33.4%
- Rents YoY
- -1.1%
- Active inventory
- 697
- Price-to-rent
- 2.9×
Monthly cashflow live
- Estimated rent
- $1,722 high interval (Pro) →
- Mortgage (P&I)
- −$315
- Tax est. 1.5%
- −$75 /mo · $900/yr
- Insurance
- −$25
- HOA
- −$825
- Vacancy / Maint / Mgmt
- −$362
- Net cashflow
- $120
Break-even live
UW: 25.0% down · 7.5% · 30yr · 1.5% tax · 5.0% vac · 8.0% maint · 8.0% mgmt
Financing live
Cash to close
- Down payment
- $15,000
- Closing costs
- $1,800
- Reserves months
- —
- Total cash needed
- —
Loan-product check · same deal, 3 products live
Conventional
25% down · 7.5% · 30yr
- Down + closing
- —
- Monthly P&I
- —
- Monthly cashflow
- —
- DSCR
- —
- Eligible?
- —
Personal DTI + credit; lowest rate.
DSCR
20% down · 8.5% · 30yr
- Down + closing
- —
- Monthly P&I
- —
- Monthly cashflow
- —
- DSCR
- —
- Eligible?
- —
No personal income docs; deal must DSCR.
Hard money
10% down · 12.0% · 12mo
- Down + closing
- —
- Monthly P&I
- —
- Monthly cashflow
- —
- DSCR
- —
- Eligible?
- —
Short-term bridge; refi at stabilization.
Rent comps 40 comps
| Address | Beds | Baths | Sqft | Rent | $/sqft | DOM | Units | Dist |
|---|---|---|---|---|---|---|---|---|
| 123 Park Ct San Antonio, TX | 3.0 | 2.0 | 1368 | $1,995 | $1.46 | 43d | 1 | 0.10mi |
| 610 Croft Trace Ln San Antonio, TX | 2.0 | 1.0 | 1092 | $1,500 | $1.37 | 43d | 1 | 0.22mi |
| 232 Cornell Ave #2 San Antonio, TX | 2.0 | 1.0 | 924 | $1,050 | $1.14 | 16d | 1 | 0.34mi |
| 219 Princeton Ave San Antonio, TX | 3.0 | 2.0 | 1230 | $2,200 | $1.79 | 23d | 1 | 0.35mi |
| 1020 W Poplar St San Antonio, TX | 2.0 | 1.0 | 902 | $1,300 | $1.44 | 23d | 1 | 0.35mi |
| 125 Hess St Unit 202 San Antonio, TX | 2.0 | 1.0 | 800 | $1,600 | $2.00 | 43d | 1 | 0.39mi |
| 310 W Evergreen St #114 San Antonio, TX | 3.0 | 2.5 | 1321 | $2,000 | $1.51 | 23d | 1 | 0.48mi |
| 408 Lewis St San Antonio, TX | 2.0 | 2.5 | 1467 | $2,500 | $1.70 | 23d | 1 | 0.52mi |
| 210 Cadwallader St San Antonio, TX | 4.0 | 2.5 | 1396 | $1,975 | $1.41 | 43d | 1 | 0.59mi |
| 542 Rivas St Unit B San Antonio, TX | 3.0 | 2.0 | 876 | $999 | $1.14 | 4d | 1 | 0.61mi |
| 233 Howard St San Antonio, TX | 1.0–2.0 | 1.0 | 769 | $999 | $1.30 | 1d | 15 | 0.64mi |
| 1415 N Main Ave San Antonio, TX | 3.0 | 1.0–3.0 | 906 | $2,150 | $2.37 | 2d | 12 | 0.64mi |
| 1415 N Main Ave San Antonio, TX | 1.0–3.0 | 1.0–3.0 | 980 | $2,715 | $2.77 | 10d | 15 | 0.64mi |
| 1415 N Main Ave San Antonio, TX | 3.0 | 1.0–3.0 | 818 | $2,150 | $2.63 | 1d | 35 | 0.64mi |
| 521 W Craig Pl Unit 2 San Antonio, TX | 2.0 | 1.0 | 848 | $1,450 | $1.71 | 21d | 1 | 0.66mi |
| 126 E Myrtle St San Antonio, TX | 2.0 | 2.5 | 1218 | $1,900 | $1.56 | 3d | 1 | 0.70mi |
| 111 E Park Ave San Antonio, TX | 1.0–2.0 | 1.0 | 789 | $999 | $1.27 | 14d | 7 | 0.70mi |
| 717 N Colorado St San Antonio, TX | 3.0 | 1.0 | 1100 | $1,199 | $1.09 | 43d | 1 | 0.73mi |
| 1311 W French Pl San Antonio, TX | 3.0 | 2.0 | 1400 | $2,500 | $1.79 | 23d | 1 | 0.74mi |
| 711 N Frio St Unit 1203 San Antonio, TX | 2.0 | 1.0 | 790 | $966 | $1.22 | 10d | 1 | 0.75mi |
| 711 N Frio St Unit 2204 San Antonio, TX | 2.0 | 1.0 | 790 | $966 | $1.22 | 2d | 1 | 0.75mi |
| 711 N Frio St Unit 2303 San Antonio, TX | 2.0 | 1.0 | 790 | $966 | $1.22 | 17d | 1 | 0.75mi |
| 711 N Frio St Unit 1302 San Antonio, TX | 2.0 | 2.0 | 980 | $1,400 | $1.43 | 17d | 1 | 0.75mi |
| 520 Cincinnati Ave San Antonio, TX | 3.0 | 2.0 | 1216 | $2,000 | $1.64 | 43d | 1 | 0.76mi |
| 913 Ogden St San Antonio, TX | 2.0 | 2.5 | 1349 | $1,900 | $1.41 | 20d | 1 | 0.76mi |
| 831 N Flores St Unit 3104 San Antonio, TX | 2.0 | 2.0 | 982 | $1,695 | $1.73 | 43d | 1 | 0.78mi |
| 810 W Magnolia Ave Unit 2 San Antonio, TX | 2.0 | 1.0 | 1104 | $999 | $0.90 | 43d | 1 | 0.80mi |
| 311 E Evergreen St San Antonio, TX | 3.0 | 2.5 | 1382 | $2,295 | $1.66 | 43d | 1 | 0.82mi |
| 411 W Mistletoe Ave San Antonio, TX | 2.0 | 1.0 | 1226 | $1,650 | $1.35 | 43d | 1 | 0.82mi |
| 1016 Blanco Rd Apt 104 San Antonio, TX | 2.0 | 1.0 | 814 | $895 | $1.10 | 23d | 1 | 0.87mi |
| 811 Rivas St San Antonio, TX | 3.0 | 2.0 | 1276 | $1,580 | $1.24 | 23d | 1 | 0.90mi |
| 141 W Woodlawn Ave Unit 1 San Antonio, TX | 3.0 | 1.0 | 1260 | $1,850 | $1.47 | 23d | 1 | 0.92mi |
| 118 E Craig Pl Unit 2 San Antonio, TX | 2.0 | 1.0 | 1258 | $1,699 | $1.35 | 43d | 1 | 0.94mi |
| 601 N Santa Rosa San Antonio, TX | 2.0 | 1.0 | 615 | $1,221 | $1.99 | 1d | 14 | 0.94mi |
| 1138 W Magnolia Ave San Antonio, TX | 2.0 | 1.0 | 1430 | $1,650 | $1.15 | 1d | 1 | 0.95mi |
| 901 Ripley Ave San Antonio, TX | 3.0 | 2.0 | 1230 | $1,600 | $1.30 | 43d | 1 | 0.95mi |
| 1910 Howard St Unit 12 San Antonio, TX | 2.0 | 1.0 | 857 | $995 | $1.16 | 43d | 1 | 1.02mi |
| 723 E Euclid Ave San Antonio, TX | 3.0 | 1.0 | 1265 | $1,297 | $1.03 | 2d | 1 | 1.04mi |
| 1409 W Woodlawn Ave #4 San Antonio, TX | 2.0 | 1.0 | 900 | $795 | $0.88 | 43d | 1 | 1.05mi |
| 1409 W Woodlawn Ave #4 San Antonio, TX | 2.0 | 1.0 | 900 | $795 | $0.88 | 21d | 1 | 1.05mi |
HOA detail
- Monthly dues
- $825 · $9,900/yr
- Likely covers
- poolsecurity
Listing history 11 events
-
2026-06-18days on market $60,000 Active 15 DOM
-
2026-06-17days on market $60,000 Active 14 DOM
-
2026-06-16days on market $60,000 Active 13 DOM
-
2026-06-15statusdays on market $60,000 Active 12 DOM
-
2026-06-13remarks 624-char remark
-
2026-06-13days on market $60,000 New 10 DOM
-
2026-06-10remarks 600-char remark
-
2026-06-09days on market $60,000 New 6 DOM
-
2026-06-08days on market $60,000 New 5 DOM
-
2026-06-08remarks 544-char remark
-
2026-06-08$60,000 New 4 DOM
ⓘ Source: listings_history table (triggers on properties + properties_extension) + one-shot
backfill from property_details.listing_events for pre-trigger history.
Nearby sold comps map
Loading sold comps map…
Walkable amenities ~0.75 mi
Loading nearby amenities…
Taxation est. · year 1
- Rental income
- $20,660
- − Mortgage interest
- −$3,361
- − Property taxes
- −$900
- − Insurance
- −$300
- − Repairs & maintenance
- −$1,653
- − Management
- −$1,653
- − HOA
- −$9,900
- − Depreciation
- −$1,745
- Taxable income
- $1,148
- Est. tax owed @ 24.0%
- −$276
- After-tax cash flow
- $1,170/yr
For passive investors: Depreciation is non-cash, so a rental often shows a tax loss while cash-flowing — sheltering income. Rental losses are passive: they offset passive income freely, and up to $25,000/yr can offset ordinary (W-2) income if you actively participate and your MAGI is under $100k (phasing out to $0 by $150k); unused losses carry forward. On sale, claimed depreciation is recaptured at up to 25%, and gains may owe capital-gains tax (a 1031 exchange can defer both). Figures are a year-1 estimate at your 24.0% rate — not tax advice; consult a CPA.
Condition & rehab AI · 10 photos
This well-maintained single-family home in a desirable location offers a good investment opportunity with minimal needed repairs and updates.
Value-add opportunities
- Both Paint exterior siding — Enhances curb appeal and value
- Resale Replace old appliances — Modernizes the kitchen and appeals to buyers
- Both Install smart home features — Improves convenience and adds value
Renovation cost estimate screening
Value-add ROI direction
- Both Paint exterior siding — Enhances curb appeal and value ↑
- Resale Replace old appliances — Modernizes the kitchen and appeals to buyers ↑
- Both Install smart home features — Improves convenience and adds value ↑
ⓘ Cost ranges are severity-bucket heuristics (US national rule-of-thumb). Get contractor quotes + a written scope before underwriting a rehab budget.
Schools (NCES district)
- District
- San Antonio ISD
- NCES district ID
- 4838730
- Math proficiency
- 12% ▼ -21.00%
- Reading proficiency
- 22% ▼ -7.00%
- Median HH income
- $30,952
- Composite
- 13.57/100
- National rank
- #9512
- State rank
- #805 of 826 in TX
Livability — San Antonio
- Score
- 80/100
- State rank
- #31
- US rank
- #1616
Category grades
Schools grade is shown separately in the Schools card above.
Census & demographics
- Census place
- San Antonio, TX
- County
- Bexar County · 1,990,555 people
- City population
- 1,806,925
- Metro
- San Antonio-New Braunfels, TX
- Population (ZIP)
- 69,282
- Household income
- $106,373
- Rent vs Own
- Severe rent burden
- 1496.0
Population outlook (Bexar County) Hauer SSP2
- Today (2025)
- 2,336,851 people
- By 2030
- 2,560,728 · +9.6%
- By 2040
- 3,020,569 · +29.3%
- By 2050
- 3,493,522 · +49.5%
- By 2075
- 4,668,459 · +99.8%
- By 2100
- 5,533,242 · +136.8%
Race, ethnicity, and origin ACS 2023
- Neighborhood character
- Diverse neighborhood (Simpson 0.65)
- Race & ethnicity
- Hispanic / Latino 47% White 34% Two or more races 27% Black 9% Asian 4% Native American 2%
- Hispanic origin (detail)
- Mexican 38% Puerto Rican 3%
- Common ancestry
- Italian 2% Lithuanian 1% Romanian 1%
- Foreign-born
- 9% · Canada
- Languages at home
- 73% English-only · Spanish 22% Other Asian/Pacific 1% Tagalog/Filipino 1%
Political lean MEDSL · Bexar
- 2024 margin
- Lean D (+9.8) · D 54.3% · R 44.6% · Other 1.1%
- 2008→2024 swing
- +4.2pp toward D · 2008: 5.6pp · 2024: 9.8pp
- All cycles
- 2024: D+9.8 2020: D+18.2 2016: D+13.5 2012: D+4.6 2008: D+5.6
Not yet ingested
- Civics
- —
Market trends
- HPI YoY
- ▼ -99.92%
- Current HPI
- 199.1827
- Rent YoY
- ▼ -1.10%
- Metro
- San Antonio-New Braunfels, TX
- State GDP YoY
- ▲ 3.95%
- F500 in state
- 110
Industry mix (Fortune 500 HQ in TX)
| Industry | F500 HQs | Revenue |
|---|---|---|
| Energy | 16 | $1,198B |
|
||
| Technology | 5 | $198B |
|
||
| Engineering / Construction | 4 | $72B |
|
||
| Energy Services | 3 | $60B |
|
||
| Utilities | 3 | $41B |
|
||
| Healthcare | 2 | $330B |
|
||
Price history
1 event — show timeline
- 2026-06-03 Listed $60,000 LERA
Cash-flow waterfall
monthlySold comps — $/sqft
last 12 mo · ≤1 miLoading sold comps…