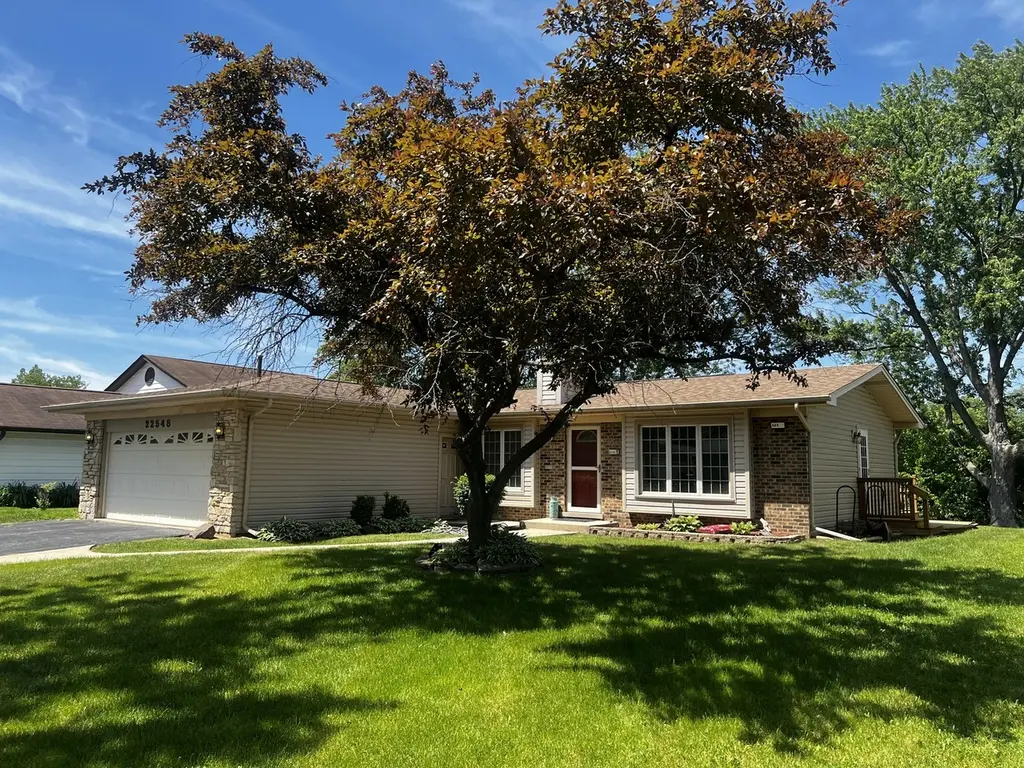
22548 Lakeshore Dr · Richton Park, IL
Flood risk 4/10 · Minor
- FEMA flood zone
- X (unshaded)
- Chance of flooding over 30 yrs
- 0.22%
- Est. flood insurance / yr
- $473 – $860
Fire risk 1/10 · Minimal
- Est. fire insurance / yr
- $804 – $1,492
Heat risk 3/10 · Minor
- Hot days now (above 102°F)
- 7 days/yr
- Hot days in 30 yrs
- 16 days/yr
Wind risk 2/10 · Minimal
- Chance of severe wind over 30 yrs
- —
Air-quality risk 2/10 · Minimal
- Unhealthy air days now
- 1 days/yr
- Unhealthy air days in 30 yrs
- 1 days/yr
Risk factors via First Street. Map © Google.
Why this score? — see what drove the D grade
The composite is a weighted blend of 9 inputs, each scored 0–100. Each bar is that input's sub-score; the figure is the points it added to the 100-point composite (weight × sub-score).
- Cash flow +17.4/30.0
- ARV discount +8.1/15.0
- DSCR +5.4/10.0
- 1% rule +4.1/10.0
- Livability +3.5/5.0
- Rent growth +2.5/5.0
- Condition / age +2.5/5.0
- Schools +0.9/10.0
- Appreciation +0.0/10.0
$220,000
🖨 Deal sheet (PDF) 📄 Offer letter ✓ Due diligence
Listing remarks
Come see this well-maintained ranch with a basement. Property has a partially finished basement with a fireplace and plenty of storage space. The living room has bay windows with a relaxing view onto the front manicured lawn. The deck in the back yard has a working hot tub for added relaxation and pleasure. This property is PRICED TO SELL Seller offering credit 5000.00 towards closing cost or upgrades. This wonderful property is in a nice community. It has curb appeal and locates near a grammar school for those wanting walking distance to school. Garage has a heater in it and plenty of cabinets for tools and storage. Property located near retail shopping and restaurants. Near I-57 and Metr
Key facts
- Heated garage
- Hot tub
- Near grammar school
Tags
Property features AI
Finance
- Other: Directions: Take Cicero South to Sauk Trail to Lakeshore Dr, turn right to address
- HOA & community: No master association fees required
Exterior
- Parking: Attached garage with 2 garage spaces (2 total parking spaces)
- Utilities: Water source: Lake Michigan; Public sewer
- Home design: Detached single-family home; One-story; Fee simple ownership; Built before 1978
- Construction: Vinyl siding with frame construction; Estimated age: 51–60 years
- Exterior features: Lot smaller than 0.25 acre; Lot dimensions: 8125
Interior
- Kitchen: Main-level kitchen approximately 12 x 9
- Bedrooms: Master bedroom (Main) with full bath, approximately 16 x 9; Bedroom (Main) approximately 12 x 14; Bedroom (Main) approximately 12 x 10
- Bathrooms: 1 full bathroom; 1 half bathroom
- Heating & cooling: Natural gas heating; Central air conditioning
- Interior features: Partially finished basement; Seven total rooms; School bus service
- Laundry & utility: Basement laundry room approximately 9 x 5; Gas dryer hookup
Neighborhood map
What this means for you Summary
Snapshot
- This is a 3-bed/1.0-bath single-family listed at $220k.
Deal economics
- At list price, monthly cash flow is $166 ($2k/yr) — positive.
- The deal already cash-flows at list — no discount required.
- To meet the 1% rule (rent ≥ 1% of price), the offer needs to be $201k (8.7% below list).
- Recommended offer: $201k (8.7% below list) — sets the bar for 1% rule.
- Cap rate 7.2% vs local median 4.3% in Richton Park — top-decile yield for the area; either an underpriced asset or a hidden risk that comps aren't pricing in. Stress-test before assuming the spread holds.
Location & tenants
- Location reads 69/100 on livability (#415 in IL) — a middle-class / working-renter tenant base. Strengths: cost of living A+, housing A+, employment B; Watch: crime C-, amenities F, commute F.
- Rich Twp Hsd 227 (suburban): math 5% / reading 12% proficiency, ranked #577 of 620 in IL (top 93%) — low school quality limits family demand, transient renter base, plan for 1-2y turnover.
- Zoned schools: Colin Powell Middle Sch (math 8% / reading 12%, grade F, #592 of 665 statewide, top 90%, 586 students, 0% FRL).
- Market conditions: 43 active listings in the ZIP; 11 comparable units currently listed for rent nearby; rentals leasing fast (median 9d on market — plan ~1-2 weeks tenant-placement turnaround); 6,272 units permitted in Cook County in 2024 (4,658 in 5+ unit buildings).
- This rent runs 37% of the median local income ($64k/yr) — at the standard rent-burdened threshold; future hikes will face affordability resistance.
Forward outlook
- Local home prices are declining (-3.0%/yr); year-one equity from $2k of loan paydown is wiped out by about $7k of value loss. Plan a longer hold.
Negotiation context
- It's been on market 21 days — a 2% lower offer ($217k) is reasonable based on typical stale-listing flexibility.
- Current owner paid $75k; list at $220k implies a 194% gain — meaningful room to come down on a strong offer.
Questions for the listing agent
- Built in 1972 — when were the roof, HVAC, electrical panel, plumbing, and water heater last replaced?
- Is there a deadline driving the sale (1031 exchange, divorce, estate, relocation)? That informs how much negotiation room exists.
- Schools are D-rated, which usually means shorter tenancies and higher turnover. Who's the typical renter profile here, and what's been the actual vacancy rate?
- The area grade is low — what's the realistic commute time and amenity access for the typical tenant pool here? Any planned neighborhood developments (good or bad) we should know about?
- What's the average days-on-market for RENTAL listings here right now (not sales)? A rising rental-DOM trend means longer vacancies and softer asking-rent achievability than the comps imply.
- What's the recent tenant-quality profile in this submarket — average credit score on applications, eviction rate, late-payment / NSF rate, and stable-employment percentage? A property-management company in the area should have these aggregated.
- How much new for-sale + rental construction is in the pipeline within 1–3 miles? Heavy new supply typically softens prices + rents 12–24 months out; constrained supply supports both.
Investment metrics
- 1% rule
- 0.91% ✗
- Cap rate
- 7.20%
- Cash-on-cash
- 3.23%
- DSCR
- 1.14
- GRM
- 9.1
CMA / ARV
- ARV (on-the-fly)
- $222,997
- Comps found
- 12
Show comp detail 12 sales within ~0.75 mi
| Address | Dist | Beds/Ba | Sqft | Sold | Price | $/sf | Match |
|---|---|---|---|---|---|---|---|
| 5110 Arquilla Dr | 0.19mi | 3/2.0 | 1,244 (-4%) | 1mo | $241,000 | $194 | 81 |
| 22621 Mission Dr | 0.14mi | 3/2.0 | 1,252 (-3%) | 5mo | $217,000 | $173 | 81 |
| 5208 Keith Dr | 0.32mi | 3/2.0 | 1,280 (-1%) | 0mo | $192,194 | $150 | 79 |
| 22607 Mission Dr | 0.13mi | 3/2.0 | 1,163 (-10%) | 2mo | $228,000 | $196 | 72 |
| 4611 Jefferson Dr | 0.39mi | 3/2.0 | 1,300 (+1%) | 6mo | $249,900 | $192 | 72 |
| 22500 Pleasant Dr | 0.17mi | 3/2.0 | 1,168 (-9%) | 4mo | $201,500 | $173 | 69 |
| 4827 Imperial Dr | 0.23mi | 3/1.5 | 1,410 (+9%) | 5mo | $179,900 | $128 | 67 |
| 22526 Clarendon Ave | 0.31mi | 4/3.0 (+1) | 1,325 (+3%) | 4mo | $239,000 | $180 | 65 |
| 22810 East Dr | 0.34mi | 3/2.0 | 1,175 (-9%) | 5mo | $167,000 | $142 | 62 |
| 4559 Saratoga Rd | 0.59mi | 4/1.5 (+1) | 1,250 (-3%) | 1mo | $195,000 | $156 | 60 |
| 22444 Adams Dr | 0.40mi | 3/1.5 | 1,415 (+10%) | 5mo | $184,000 | $130 | 59 |
| 4921 Lakeshore Dr | 0.64mi | 3/2.0 | 1,212 (-6%) | 2mo | $240,000 | $198 | 54 |
Match score weights: distance 35% · size 25% · config 20% · recency 20%. Top-matched comps best support the ARV.
Projected returns pro-forma
-3.0% appreciation · 3.0% rent growth · sell at horizon
- IRR
- -11.2%
- Equity multiple
- 0.59×
- Total profit
- $-25,129
- Equity at exit
- $32,803
- IRR
- -2.0%
- Equity multiple
- 0.86×
- Total profit
- $-8,420
- Equity at exit
- $19,022
Cash invested: $61,600 (down + closing). Projections, not guarantees.
Landlord ↔ Tenant lean methodology
- Overall (STATE)
- 43 Moderately Tenant-Leaning
- State Illinois
- 43 Moderately Tenant-Leaning · D+7
- County
- — inherits STATE
- City
- — inherits STATE
ZIP-level market 60471
- Home prices YoY
- -17.5%
- Active inventory
- 43
- Price-to-rent
- 9.1×
Monthly cashflow live
- Estimated rent
- $2,008 high interval (Pro) →
- Mortgage (P&I)
- −$1,154
- Tax from tax record
- −$175 /mo · $2,106/yr
- Insurance
- −$92
- HOA
- −$0
- Vacancy / Maint / Mgmt
- −$422
- Net cashflow
- $166
Break-even live
Sensitivity live
| Price | -10% $290 | -5% $228 | +0% $166 | +5% $103 | +10% $41 |
|---|---|---|---|---|---|
| Rent | -10% $7 | -5% $86 | +0% $166 | +5% $245 | +10% $324 |
| Rate | -1.0pp $276 | -0.5pp $222 | base $166 | +0.5pp $109 | +1.0pp $51 |
UW: 25.0% down · 7.5% · 30yr · 1.5% tax · 5.0% vac · 8.0% maint · 8.0% mgmt
Financing live
Cash to close
- Down payment
- $55,000
- Closing costs
- $6,600
- Reserves months
- —
- Total cash needed
- —
Loan-product check · same deal, 3 products live
Conventional
25% down · 7.5% · 30yr
- Down + closing
- —
- Monthly P&I
- —
- Monthly cashflow
- —
- DSCR
- —
- Eligible?
- —
Personal DTI + credit; lowest rate.
DSCR
20% down · 8.5% · 30yr
- Down + closing
- —
- Monthly P&I
- —
- Monthly cashflow
- —
- DSCR
- —
- Eligible?
- —
No personal income docs; deal must DSCR.
Hard money
10% down · 12.0% · 12mo
- Down + closing
- —
- Monthly P&I
- —
- Monthly cashflow
- —
- DSCR
- —
- Eligible?
- —
Short-term bridge; refi at stabilization.
Rent comps 11 comps
| Address | Beds | Baths | Sqft | Rent | $/sqft | DOM | Units | Dist |
|---|---|---|---|---|---|---|---|---|
| 22600 Amy Dr Richton Park, IL | 4.0 | 2.5 | 1721 | $2,581 | $1.50 | 4d | 1 | 0.13mi |
| 5051 Imperial Dr Richton Park, IL | 3.0 | 1.5 | 1342 | $1,800 | $1.34 | 0d | 1 | 0.20mi |
| 4561 Heartland Dr Unit 3F Richton Park, IL | 2.0 | 1.0 | 1000 | $1,350 | $1.35 | 26d | 1 | 0.42mi |
| 5265 Arquilla Dr Richton Park, IL | 3.0 | 2.0 | 1810 | $1,989 | $1.10 | 16d | 1 | 0.42mi |
| 22501 Butterfield Rd Unit 22400-311 Richton Park, IL | 2.0 | 1.0 | 882 | $1,360 | $1.54 | 9d | 1 | 0.95mi |
| 22501 Butterfield Rd Unit 22411-514 Richton Park, IL | 2.0 | 1.5 | 1021 | $1,365 | $1.34 | 9d | 1 | 0.95mi |
| 22501 Butterfield Rd Unit 22411-506 Richton Park, IL | 2.0 | 1.0 | 882 | $1,325 | $1.50 | 9d | 1 | 0.95mi |
| 22501 Butterfield Rd Unit 22415-207 Richton Park, IL | 2.0 | 1.5 | 944 | $1,360 | $1.44 | 9d | 1 | 0.95mi |
| 22015 E Churchill Dr Richton Park, IL | 4.0 | 2.0 | 1200 | $2,300 | $1.92 | 26d | 1 | 0.98mi |
| 4200 Arlington Dr Richton Park, IL | 3.0 | 2.0 | 1595 | $2,061 | $1.29 | 22d | 1 | 1.04mi |
| 3905 Tower Dr Richton Park, IL | 1.0–2.0 | 1.0–2.0 | 905 | $1,795 | $1.98 | 0d | 19 | 1.42mi |
Listing history 18 events
-
2026-06-21days on market $220,000 Active 21 DOM
-
2026-06-18days on market $220,000 Active 18 DOM
-
2026-06-17remarks 699-char remark
-
2026-06-17days on market $220,000 Active 17 DOM
-
2026-06-16days on market $220,000 Active 16 DOM
-
2026-06-15days on market $220,000 Active 15 DOM
-
2026-06-13days on market $220,000 Active 13 DOM
-
2026-06-10remarks 525-char remark
-
2026-06-10price $220,000 Active 9 DOM
-
2026-06-09days on market $231,000 Active 9 DOM
-
2026-06-08days on market $231,000 Active 8 DOM
-
2026-06-07days on market $231,000 Active 7 DOM
-
2026-06-04days on market $231,000 Active 4 DOM
-
2026-06-03days on market $231,000 Active 3 DOM
-
2026-06-02days on market $231,000 Active 2 DOM
-
2026-06-02remarks 423-char remark
-
2026-06-01remarks 395-char remark
-
2026-06-01$231,000 Active 1 DOM
ⓘ Source: listings_history table (triggers on properties + properties_extension) + one-shot
backfill from property_details.listing_events for pre-trigger history.
Tax reassessment forecast IL · Partial reset (capped growth)
- Current annual tax
- $2,106 · $175/mo
- Projected year-2 tax
- $3,550 · $296/mo
- Expected delta
- +$1,444/yr (+$120/mo · 68.6%)
ⓘ Screening estimate from a state-policy table — verify with the county assessor before closing.
Climate risk First Street
- Flood 4/10 Moderate FEMA zone X (unshaded) · 22% chance over 30 yrs
- Wildfire 1/10 Low
- Heat 3/10 Moderate 7 d/yr ≥102°F today · 16 d/yr by 30 yrs out
- Wind 2/10 Low
- Air quality 2/10 Low 1 unhealthy d/yr today · 1 by 30 yrs out
Nearby sold comps map
Loading sold comps map…
Walkable amenities ~0.75 mi
Loading nearby amenities…
Taxation est. · year 1
- Rental income
- $24,099
- − Mortgage interest
- −$12,323
- − Property taxes
- −$2,106
- − Insurance
- −$1,100
- − Repairs & maintenance
- −$1,928
- − Management
- −$1,928
- − Depreciation
- −$6,400
- Taxable loss
- −$1,686
- Est. tax savings @ 24.0%
- +$405
- After-tax cash flow
- $2,393/yr
For passive investors: Depreciation is non-cash, so a rental often shows a tax loss while cash-flowing — sheltering income. Rental losses are passive: they offset passive income freely, and up to $25,000/yr can offset ordinary (W-2) income if you actively participate and your MAGI is under $100k (phasing out to $0 by $150k); unused losses carry forward. On sale, claimed depreciation is recaptured at up to 25%, and gains may owe capital-gains tax (a 1031 exchange can defer both). Figures are a year-1 estimate at your 24.0% rate — not tax advice; consult a CPA.
Schools (NCES district)
- District
- Rich Twp Hsd 227
- NCES district ID
- 1733420
- Math proficiency
- 5% ▼ -3.00%
- Reading proficiency
- 12% ▬ 0.00%
- Median HH income
- $56,056
- Composite
- 8.93/100
- National rank
- #9885
- State rank
- #577 of 620 in IL
Livability — Richton Park
- Score
- 69/100
- State rank
- #415
- US rank
- #8530
Category grades
Schools grade is shown separately in the Schools card above.
Census & demographics
- Census place
- Richton Park, IL
- County
- Cook County · 4,486,803 people
- City population
- 12,848
- Metro
- Chicago-Naperville-Elgin, IL-IN-WI
- Population (ZIP)
- 12,848
- Household income
- $64,494
- Rent vs Own
- Severe rent burden
- 799.0
Population outlook (Cook County) Hauer SSP2
- Today (2025)
- 5,347,519 people
- By 2030
- 5,357,703 · +0.2%
- By 2040
- 5,324,924 · -0.4%
- By 2050
- 5,230,762 · -2.2%
- By 2075
- 4,785,735 · -10.5%
- By 2100
- 4,188,836 · -21.7%
Race, ethnicity, and origin ACS 2023
- Neighborhood character
- Predominantly Black (88%)
- Race & ethnicity
- Black 88% White 7% Hispanic / Latino 2% Two or more races 1%
- Common ancestry
- Romanian 1%
- Foreign-born
- 3% · Canada
- Languages at home
- 94% English-only · Spanish 3% French/Haitian/Cajun 1% German/W. Germanic 1%
Political lean MEDSL · Cook
- 2024 margin
- Solid D (+42.0) · D 70.4% · R 28.4% · Other 1.2%
- 2008→2024 swing
- -11.4pp toward R · 2008: 53.4pp · 2024: 42.0pp
- All cycles
- 2024: D+42.0 2020: D+50.3 2016: D+53.0 2012: D+49.4 2008: D+53.4
Not yet ingested
- Civics
- —
Market trends
- HPI YoY
- ▼ -48.01%
- Current HPI
- 226.6786
- Rent YoY
- —
- Metro
- Chicago-Naperville-Elgin, IL-IN-WI
- State GDP YoY
- ▲ 1.59%
- F500 in state
- 60
Industry mix (Fortune 500 HQ in IL)
| Industry | F500 HQs | Revenue |
|---|---|---|
| Insurance | 4 | $201B |
|
||
| Consumer Goods | 4 | $87B |
|
||
| Industrial Machinery | 3 | $64B |
|
||
| Healthcare | 2 | $55B |
|
||
| Retail / Pharmacy | 1 | $148B |
|
||
| Agriculture / Food | 1 | $86B |
|
||
Price history
+208.4% since first listed2 events — show timeline
- 2026-05-30 Listed $231,000 MRED as Distributed by MLS Grid
- 1986-07-01 Sold (Public Records) $74,900 Public Records
Property tax history
-3.4%/yrLatest (2023): $2,106 · -26.4% YoY. Source: county tax records.
Cash-flow waterfall
monthlySold comps — $/sqft
last 12 mo · ≤1 miLoading sold comps…