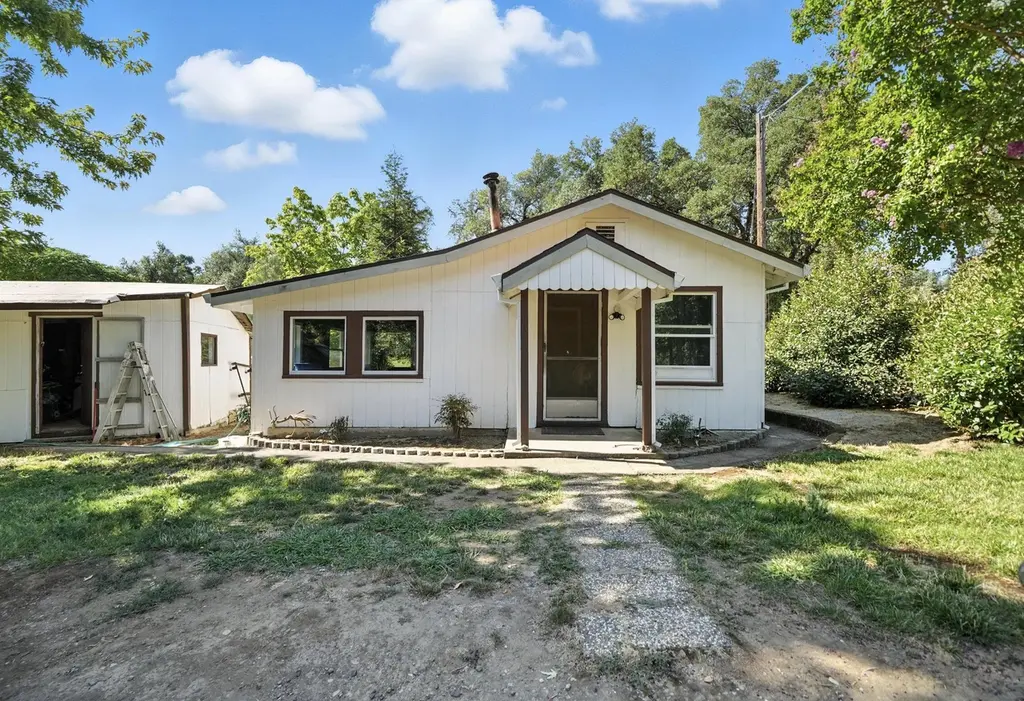
17789 Peterson Ln · Redding, CA
Flood risk 1/10 · Minimal
- FEMA flood zone
- X (unshaded)
- Chance of flooding over 30 yrs
- 0.0%
- Est. flood insurance / yr
- $507 – $1,088
Fire risk 7/10 · Major
- Est. fire insurance / yr
- $659 – $1,223
Heat risk 8/10 · Major
- Hot days now (above 106°F)
- 7 days/yr
- Hot days in 30 yrs
- 17 days/yr
Wind risk 1/10 · Minimal
- Chance of severe wind over 30 yrs
- —
Air-quality risk 10/10 · Severe
- Unhealthy air days now
- 37 days/yr
- Unhealthy air days in 30 yrs
- 40 days/yr
Risk factors via First Street. Map © Google.
Why this score? — see what drove the D+ grade
The composite is a weighted blend of 9 inputs, each scored 0–100. Each bar is that input's sub-score; the figure is the points it added to the 100-point composite (weight × sub-score).
- Cash flow +23.9/30.0
- DSCR +7.7/10.0
- 1% rule +5.2/10.0
- Rent growth +4.0/5.0
- Livability +3.8/5.0
- Schools +2.5/10.0
- Condition / age +2.5/5.0
- ARV discount +0.0/15.0
- Appreciation +0.0/10.0
$149,000
🖨 Deal sheet (PDF) 📄 Offer letter ✓ Due diligence
Listing remarks MLS
Check out this 2 bedroom 1 bath cottage with 2 separate parcels totaling . 63 acres, just minutes from town. Newer roof, windows, and septic system within the last year. Included is a shed for storage, plus a separate storage building with the beginnings of a bathroom that could be re-imagined into an adu, game room, or extra living space.
Key facts
- Shed for storage
- Newer roof
- Newer septic system
Tags
Neighborhood map
What this means for you Summary
Snapshot
- This is a 2-bed/1.0-bath single-family listed at $149k.
Deal economics
- At list price, monthly cash flow is $290 ($3k/yr) — positive.
- The deal already cash-flows at list — no discount required.
- Meets the 1% rule at list price ($2k rent vs $149k).
- Recommended offer: $131k (12.0% below list) — sets the bar for market timing.
Location & tenants
- Location reads 76/100 on livability (#106 in CA, #3,726 nationally) — a middle-class / working-renter tenant base. Strengths: amenities A+, commute A+, health & safety A+; Watch: employment C-, crime F, cost of living F.
- Gateway Unified (suburban): math 25% / reading 35% proficiency, ranked #355 of 517 in CA (top 69%) — families likely to look elsewhere, expect single-tenant / working-renter base with shorter leases.
- Zoned schools: Shasta Lake (math 27% / reading 36%, grade F, #816 of 1,571 statewide, top 52%, 616 students, 74% FRL); Central Valley High (math 42% / reading 67%, grade C-, #256 of 1,170 statewide, top 24%, 625 students, 60% FRL).
- Zoned-school proficiency averages 43% at this address vs 30% district-wide (+13 pts) — the actual schools serving this property are materially stronger than the Gateway Unified average implies; a family-tenant draw the district grade alone would hide.
- Market conditions: Rents rising fast (+6.0%/yr); 393 active listings in the ZIP; 246 units permitted in Shasta County in 2024 (0 in 5+ unit buildings).
Forward outlook
- Local home prices are declining (-3.0%/yr); year-one equity from $1k of loan paydown is wiped out by about $4k of value loss. Plan a longer hold.
- Shasta County population projected to shrink 9% by 2050 — rents likely to lag national; underwrite the cash flow, not the appreciation.
- At projected returns (-3.0% appreciation + 6.0% rent growth), your $42k cash investment doubles in ~9 years — after that, you're playing with house money.
Negotiation context
- It's been on market 140 days — a 12% lower offer ($131k) is reasonable based on typical stale-listing flexibility.
- 4 sale attempts since 6y ago; this cycle's ask has dropped $20k (12%) from the opening price — seller is motivated, your offer sets the floor, not the list.
- Current owner paid $30k; list at $149k implies a 397% gain — meaningful room to come down on a strong offer.
Risks & watch-outs
- Watch-outs: built in 1950 — expect roof / HVAC / electrical / plumbing capex.
- Climate carrying-cost: major wildfire risk; extreme-heat days projected 7→17/yr by 2055 (HVAC capex compounding) — expect insurance premiums to compound above CPI over the hold.
Questions for the listing agent
- It's been on market 140 days. Have you received any prior offers? Is the seller open to a 12% concession, seller financing, or rate buy-down credit?
- Built in 1950 — when were the roof, HVAC, electrical panel, plumbing, and water heater last replaced?
- Why hasn't it sold? Are there any deal-killer items the seller is aware of (foundation, flood, title, zoning, code violations)?
- Is there a deadline driving the sale (1031 exchange, divorce, estate, relocation)? That informs how much negotiation room exists.
- Schools are B-rated — typically a magnet for longer-tenancy family renters. What's the average tenant stay here, and is there a school-zone premium baked into asking?
- Crime grade is F in this area — have there been break-ins, vandalism, or insurance claims at this property in the last 3 years? What carrier currently insures it and at what premium?
- The area grade is low — what's the realistic commute time and amenity access for the typical tenant pool here? Any planned neighborhood developments (good or bad) we should know about?
- What's the average days-on-market for RENTAL listings here right now (not sales)? A rising rental-DOM trend means longer vacancies and softer asking-rent achievability than the comps imply.
- What's the recent tenant-quality profile in this submarket — average credit score on applications, eviction rate, late-payment / NSF rate, and stable-employment percentage? A property-management company in the area should have these aggregated.
- How much new for-sale + rental construction is in the pipeline within 1–3 miles? Heavy new supply typically softens prices + rents 12–24 months out; constrained supply supports both.
Investment metrics
- 1% rule
- 1.02% ✓
- Cap rate
- 8.63%
- Cash-on-cash
- 8.35%
- DSCR
- 1.37
- GRM
- 8.2
CMA / ARV
- ARV (median comp)
- $112,617
- List price
- $149,000
- Delta
- 50.07%
- Verdict
- OVERPRICED
- Comps
- 4 within 1.0 mi
Show comp detail 1 sale within ~0.75 mi
| Address | Dist | Beds/Ba | Sqft | Sold | Price | $/sf | Match |
|---|---|---|---|---|---|---|---|
| 12221 Macs Rd | 0.18mi | 1/1.0 (-1) | 712 (+10%) | 21mo | $120,000 | $169 | 53 |
Match score weights: distance 35% · size 25% · config 20% · recency 20%. Top-matched comps best support the ARV.
Projected returns pro-forma
-3.0% appreciation · 5.98% rent growth · sell at horizon
- IRR
- -0.6%
- Equity multiple
- 0.98×
- Total profit
- $-1,035
- Equity at exit
- $22,216
- IRR
- 11.7%
- Equity multiple
- 2.03×
- Total profit
- $43,093
- Equity at exit
- $12,883
Cash invested: $41,720 (down + closing). Projections, not guarantees.
Landlord ↔ Tenant lean methodology
- Overall (STATE)
- 18 Strongly Tenant-Friendly
- State California
- 18 Strongly Tenant-Friendly · D+13
- County
- — inherits STATE
- City
- — inherits STATE
ZIP-level market 96003
- Rents YoY
- 6.0%
- Active inventory
- 393
- Price-to-rent
- 8.2×
Monthly cashflow live
- Estimated rent
- $1,515 medium interval (Pro) →
- Mortgage (P&I)
- −$781
- Tax from tax record
- −$63 /mo · $759/yr
- Insurance
- −$62
- HOA
- −$0
- Vacancy / Maint / Mgmt
- −$318
- Net cashflow
- $290
Break-even live
Sensitivity live
| Price | -10% $375 | -5% $332 | +0% $290 | +5% $248 | +10% $206 |
|---|---|---|---|---|---|
| Rent | -10% $171 | -5% $230 | +0% $290 | +5% $350 | +10% $410 |
| Rate | -1.0pp $365 | -0.5pp $328 | base $290 | +0.5pp $252 | +1.0pp $212 |
UW: 25.0% down · 7.5% · 30yr · 1.5% tax · 5.0% vac · 8.0% maint · 8.0% mgmt
Financing live
Cash to close
- Down payment
- $37,250
- Closing costs
- $4,470
- Reserves months
- —
- Total cash needed
- —
Loan-product check · same deal, 3 products live
Conventional
25% down · 7.5% · 30yr
- Down + closing
- —
- Monthly P&I
- —
- Monthly cashflow
- —
- DSCR
- —
- Eligible?
- —
Personal DTI + credit; lowest rate.
DSCR
20% down · 8.5% · 30yr
- Down + closing
- —
- Monthly P&I
- —
- Monthly cashflow
- —
- DSCR
- —
- Eligible?
- —
No personal income docs; deal must DSCR.
Hard money
10% down · 12.0% · 12mo
- Down + closing
- —
- Monthly P&I
- —
- Monthly cashflow
- —
- DSCR
- —
- Eligible?
- —
Short-term bridge; refi at stabilization.
Listing history 7 events
-
2026-06-22price $149,000 Active 140 DOM
-
2026-06-21statusdays on market $169,000 Active 140 DOM
-
2026-01-07$169,000 Active 341-char remark
Show marketing remark (341 chars)
Check out this 2 bedroom 1 bath cottage with 2 separate parcels totaling . 63 acres, just minutes from town. Newer roof, windows, and septic system within the last year. Included is a shed for storage, plus a separate storage building with the beginnings of a bathroom that could be re-imagined into an adu, game room, or extra living space.
-
2025-08-01$169,000 Active
-
2020-11-09$110,000
-
2020-03-23$110,000
-
1990-06-13soldstatus $30,000
ⓘ Source: listings_history table (triggers on properties + properties_extension) + one-shot
backfill from property_details.listing_events for pre-trigger history.
Tax reassessment forecast CA · Resets to sale price
- Current annual tax
- $759 · $63/mo
- Projected year-2 tax
- $1,132 · $94/mo
- Expected delta
- +$374/yr (+$31/mo · 49.3%)
ⓘ Screening estimate from a state-policy table — verify with the county assessor before closing.
Climate risk First Street
- Flood 1/10 Low FEMA zone X (unshaded) · 0% chance over 30 yrs
- Wildfire 7/10 Severe
- Heat 8/10 Severe 7 d/yr ≥106°F today · 17 d/yr by 30 yrs out
- Wind 1/10 Low
- Air quality 10/10 Extreme 37 unhealthy d/yr today · 40 by 30 yrs out
Nearby sold comps map
Loading sold comps map…
Walkable amenities ~0.75 mi
Loading nearby amenities…
Taxation est. · year 1
- Rental income
- $18,180
- − Mortgage interest
- −$8,346
- − Property taxes
- −$759
- − Insurance
- −$745
- − Repairs & maintenance
- −$1,454
- − Management
- −$1,454
- − Depreciation
- −$4,335
- Taxable income
- $1,087
- Est. tax owed @ 24.0%
- −$261
- After-tax cash flow
- $3,222/yr
For passive investors: Depreciation is non-cash, so a rental often shows a tax loss while cash-flowing — sheltering income. Rental losses are passive: they offset passive income freely, and up to $25,000/yr can offset ordinary (W-2) income if you actively participate and your MAGI is under $100k (phasing out to $0 by $150k); unused losses carry forward. On sale, claimed depreciation is recaptured at up to 25%, and gains may owe capital-gains tax (a 1031 exchange can defer both). Figures are a year-1 estimate at your 24.0% rate — not tax advice; consult a CPA.
Schools (NCES district)
- District
- Gateway Unified
- NCES district ID
- 0614950
- Math proficiency
- 25% ▼ -5.00%
- Reading proficiency
- 35% ▲ 2.00%
- Median HH income
- $41,888
- Composite
- 25.39/100
- National rank
- #7465
- State rank
- #355 of 517 in CA
Livability — Redding
- Score
- 76/100
- State rank
- #106
- US rank
- #3726
Category grades
Schools grade is shown separately in the Schools card above.
Census & demographics
- County
- Shasta County · 147,641 people
- City population
- 112,523
- Metro
- Redding, CA
- Population (ZIP)
- 44,923
- Household income
- $72,445
- Rent vs Own
- Severe rent burden
- 1668.0
Population outlook (Shasta County) Hauer SSP2
- Today (2025)
- 179,231 people
- By 2030
- 176,953 · -1.3%
- By 2040
- 169,982 · -5.2%
- By 2050
- 162,547 · -9.3%
- By 2075
- 145,649 · -18.7%
- By 2100
- 123,025 · -31.4%
Race, ethnicity, and origin ACS 2023
- Neighborhood character
- Predominantly White (76%)
- Race & ethnicity
- White 76% Hispanic / Latino 11% Two or more races 10% Asian 4% Native American 1% Black 1%
- Hispanic origin (detail)
- Mexican 7%
- Common ancestry
- Italian 5% Slovak 3% Lithuanian 3%
- Foreign-born
- 6% · Canada, China
- Languages at home
- 92% English-only · Spanish 3% German/W. Germanic 1% Other Asian/Pacific 1%
Political lean MEDSL · Shasta
- 2024 margin
- Solid R (+36.5) · D 30.5% · R 67.0% · Other 2.5%
- 2008→2024 swing
- -10.7pp toward R · 2008: -25.8pp · 2024: -36.5pp
- All cycles
- 2024: R+36.5 2020: R+33.1 2016: R+37.4 2012: R+30.3 2008: R+25.8
Not yet ingested
- Civics
- —
Market trends
- HPI YoY
- ▼ -181.66%
- Current HPI
- 152.3069
- Rent YoY
- ▲ 5.98%
- Metro
- Redding, CA
- State GDP YoY
- ▲ 3.21%
- F500 in state
- 116
Industry mix (Fortune 500 HQ in CA)
| Industry | F500 HQs | Revenue |
|---|---|---|
| Technology | 27 | $1,492B |
|
||
| Financial Services | 3 | $174B |
|
||
| Retail | 3 | $44B |
|
||
| Insurance | 3 | $26B |
|
||
| Media / Entertainment | 2 | $115B |
|
||
| Pharmaceuticals / Biotech | 2 | $62B |
|
||
Price history
+463.3% since first listed5 events — show timeline
- 2026-01-07 Listed $169,000 SAOR
- 2025-08-01 Listed $169,000 SAOR
- 2020-11-09 Listed $110,000 SAOR
- 2020-03-23 Listed $110,000 SAOR
- 1990-06-13 Sold (Public Records) $30,000 Public Records
Property tax history
+2.3%/yrLatest (2025): $759 · +5.5% YoY. Source: county tax records.
Cash-flow waterfall
monthlySold comps — $/sqft
last 12 mo · ≤1 miLoading sold comps…