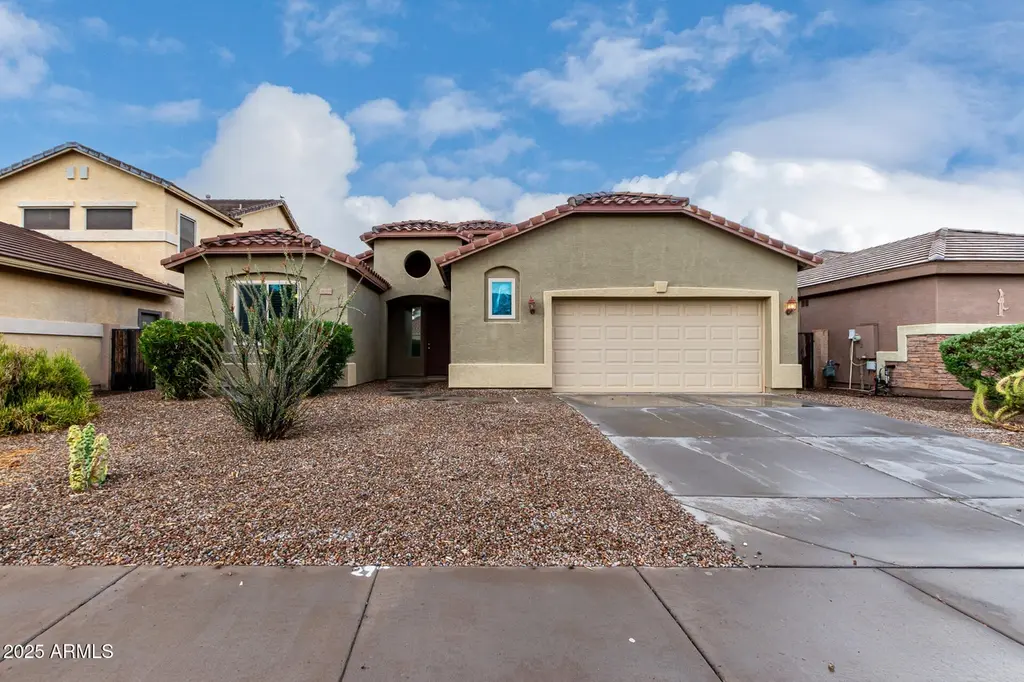
18305 N Larkspur Dr · Maricopa, AZ
Flood risk 4/10 · Minor
- FEMA flood zone
- X
- Chance of flooding over 30 yrs
- 0.21%
- Est. flood insurance / yr
- $507 – $1,088
Fire risk 6/10 · Moderate
- Est. fire insurance / yr
- $610 – $1,132
Heat risk 9/10 · Severe
- Hot days now (above 114°F)
- 7 days/yr
- Hot days in 30 yrs
- 19 days/yr
Wind risk 1/10 · Minimal
- Chance of severe wind over 30 yrs
- —
Air-quality risk 2/10 · Minimal
- Unhealthy air days now
- 1 days/yr
- Unhealthy air days in 30 yrs
- 1 days/yr
Risk factors via First Street. Map © Google.
Why this score? — see what drove the D- grade
The composite is a weighted blend of 9 inputs, each scored 0–100. Each bar is that input's sub-score; the figure is the points it added to the 100-point composite (weight × sub-score).
- ARV discount +14.3/15.0
- Cash flow +6.7/30.0
- Appreciation +4.6/10.0
- Livability +3.6/5.0
- Rent growth +2.9/5.0
- Condition / age +2.5/5.0
- Schools +2.3/10.0
- 1% rule +1.0/10.0
- DSCR +0.9/10.0
$333,900
🖨 Deal sheet 📄 Offer letter ✓ Due diligence
Listing remarks MLS
This beautifully maintained 3-bedroom, 3-bath home offers the perfect blend of style, comfort, and functionality. From the moment you arrive, you'll appreciate the charming curb appeal with low-maintenance desert landscaping and a spacious 2-car garage. Inside, you'll find a warm and inviting interior featuring tall ceilings, a fresh designer color palette, and a thoughtful mix of tile and new plush carpeting in all the right places. The semi-open floor plan provides both comfortable separation and a natural flow for everyday living and entertaining. The eat-in kitchen is the heart of the home, showcasing new stainless steel appliances, granite countertops, recessed lighting, a walk-in pantry, and abundant white cabinetry. A two-tiered peninsula with breakfast bar makes it perfect for casual dining and gathering with guests. A versatile den adds valuable flex space--ideal for a home office, playroom, or cozy retreat. The spacious primary suite offers an en-suite bath with dual sinks, a walk-in closet, and great natural light. Two additional bedrooms and bathrooms provide plenty of room for family, guests, or hobbies. Step outside to a generously sized backyard with a covered patio--perfect for relaxing, entertaining, or enjoying Arizona evenings. Move-in ready and ideally located near shopping, dining, and parks--this is one you don't want to miss!
Key facts
- Spacious garage
- Eat-in kitchen
- Granite countertops
Tags
Neighborhood map
What this means for you Summary
Snapshot
- This is a 3-bed/3.0-bath single-family listed at $334k.
Deal economics
- At list price, monthly cash flow is $-534 ($-6k/yr) — negative.
- To cash-flow at today's rent, offer at most $240k (28.3% below list).
- To meet the 1% rule (rent ≥ 1% of price), the offer needs to be $201k (39.7% below list).
- Recommended offer: $201k (39.7% below list) — sets the bar for 1% rule.
Location & tenants
- Location reads 72/100 on livability (#28 in AZ) — a middle-class / working-renter tenant base. Strengths: housing A+, employment A-, crime B+; Watch: amenities F, commute F, health & safety F.
- Maricopa Unified School District (4441) (town): math 20% / reading 29% proficiency, ranked #128 of 249 in AZ (top 51%) — low school quality limits family demand, transient renter base, plan for 1-2y turnover.
- Market conditions: Rents rising (+1.8%/yr); 845 active listings in the ZIP; 40 comparable units currently listed for rent nearby; rentals at typical pace (median 24d on market — plan ~3-4 weeks tenant-placement turnaround); 45% of comp listings sitting > 30 days — soft ceiling on asking rent; solid renter incomes; 9,504 units permitted in Pinal County in 2024 (776 in 5+ unit buildings).
Forward outlook
- Local home prices are declining (-0.9%/yr); year-one equity from $2k of loan paydown is wiped out by about $3k of value loss. Plan a longer hold.
Negotiation context
- It's been on market 64 days — a 6% lower offer ($314k) is reasonable based on typical stale-listing flexibility.
- 8 sale attempts since 16y ago with the ask held roughly flat each time — persistent listings suggest the price (not the market) is what's stuck; bring a comps-based counter.
- Current owner paid $171k; list at $334k implies a 95% gain — meaningful room to come down on a strong offer.
Risks & watch-outs
- Climate carrying-cost: major wildfire risk; extreme-heat days projected 7→19/yr by 2055 (HVAC capex compounding) — expect insurance premiums to compound above CPI over the hold.
Questions for the listing agent
- What do current leases actually rent for vs. the listed asking? Can we see a recent rent roll and the last 12 months of T-12 income?
- It's been on market 64 days. Have you received any prior offers? Is the seller open to a 40% concession, seller financing, or rate buy-down credit?
- What does the HOA fee cover, when was the last increase, and are there any pending special assessments or reserve-fund shortfalls?
- Why hasn't it sold? Are there any deal-killer items the seller is aware of (foundation, flood, title, zoning, code violations)?
- Is there a deadline driving the sale (1031 exchange, divorce, estate, relocation)? That informs how much negotiation room exists.
- Schools are B-rated — typically a magnet for longer-tenancy family renters. What's the average tenant stay here, and is there a school-zone premium baked into asking?
- The area grade is low — what's the realistic commute time and amenity access for the typical tenant pool here? Any planned neighborhood developments (good or bad) we should know about?
- What's the average days-on-market for RENTAL listings here right now (not sales)? A rising rental-DOM trend means longer vacancies and softer asking-rent achievability than the comps imply.
- What's the recent tenant-quality profile in this submarket — average credit score on applications, eviction rate, late-payment / NSF rate, and stable-employment percentage? A property-management company in the area should have these aggregated.
- How much new for-sale + rental construction is in the pipeline within 1–3 miles? Heavy new supply typically softens prices + rents 12–24 months out; constrained supply supports both.
Investment metrics
- 1% rule
- 0.60% ✗
- Cap rate
- 4.37%
- Cash-on-cash
- -6.86%
- DSCR
- 0.69
- GRM
- 13.8
CMA / ARV
- ARV (median comp)
- $393,498
- List price
- $333,900
- Delta
- -15.15%
- Verdict
- UNDERPRICED
- Comps
- 20 within 1.0 mi
Show comp detail 12 sales within ~0.75 mi
| Address | Dist | Beds/Ba | Sqft | Sold | Price | $/sf | Match |
|---|---|---|---|---|---|---|---|
| 43931 W Cypress Ln | 0.15mi | 3/2.5 | 2,201 (+6%) | 2mo | $329,900 | $150 | 81 |
| 18328 N Desert Willow Dr | 0.03mi | 4/2.0 (+1) | 2,137 (+2%) | 7mo | $325,000 | $152 | 80 |
| 43833 W Acacia Ave | 0.20mi | 4/2.0 (+1) | 1,902 (-9%) | 0mo | $330,000 | $174 | 66 |
| 43818 W Acacia Ave | 0.23mi | 4/2.0 (+1) | 1,902 (-9%) | 3mo | $330,000 | $174 | 63 |
| 43573 W Blazen Trl | 0.49mi | 3/2.0 | 1,938 (-7%) | 1mo | $287,000 | $148 | 60 |
| 43653 W Cypress Ln | 0.22mi | 4/2.5 (+1) | 2,357 (+13%) | 1mo | $350,000 | $148 | 60 |
| 18307 N Presley Ln | 0.39mi | 4/2.0 (+1) | 1,902 (-9%) | 1mo | $324,000 | $170 | 58 |
| 43752 W Arizona Ave | 0.61mi | 4/3.0 (+1) | 2,231 (+7%) | 1mo | $299,900 | $134 | 55 |
| 44810 W Horse Mesa Rd | 0.63mi | 3/3.0 | 1,844 (-12%) | 2mo | $247,000 | $134 | 50 |
| 43845 W Elizabeth Ave | 0.50mi | 3/2.0 | 1,816 (-13%) | 4mo | $305,000 | $168 | 48 |
| 18967 N Leland Rd | 0.62mi | 4/2.5 (+1) | 2,275 (+9%) | 4mo | $299,000 | $131 | 46 |
| 44014 W Magnolia Rd | 0.74mi | 4/3.0 (+1) | 2,221 (+6%) | 5mo | $265,000 | $119 | 45 |
Match score weights: distance 35% · size 25% · config 20% · recency 20%. Top-matched comps best support the ARV.
Projected returns pro-forma
-0.89% appreciation · 1.78% rent growth · sell at horizon
- IRR
- -15.0%
- Equity multiple
- 0.36×
- Total profit
- $-59,994
- Equity at exit
- $82,403
- IRR
- -9.3%
- Equity multiple
- 0.17×
- Total profit
- $-77,208
- Equity at exit
- $88,075
Cash invested: $93,492 (down + closing). Projections, not guarantees.
Landlord ↔ Tenant lean methodology
- Overall (STATE)
- 87 Strongly Landlord-Friendly
- State Arizona
- 87 Strongly Landlord-Friendly · R+3
- County
- — inherits STATE
- City
- — inherits STATE
ZIP-level market 85138
- Home prices YoY
- -0.3%
- Rents YoY
- 1.8%
- Active inventory
- 845
- Price-to-rent
- 13.8×
Monthly cashflow live
- Estimated rent
- $2,014 high interval (Pro) →
- Mortgage (P&I)
- −$1,751
- Tax from tax record
- −$175 /mo · $2,097/yr
- Insurance
- −$139
- HOA
- −$60
- Vacancy / Maint / Mgmt
- −$423
- Net cashflow
- $-534
Break-even live
UW: 25.0% down · 7.5% · 30yr · 1.5% tax · 5.0% vac · 8.0% maint · 8.0% mgmt
Financing live
Cash to close
- Down payment
- $83,475
- Closing costs
- $10,017
- Reserves months
- —
- Total cash needed
- —
Loan-product check · same deal, 3 products live
Conventional
25% down · 7.5% · 30yr
- Down + closing
- —
- Monthly P&I
- —
- Monthly cashflow
- —
- DSCR
- —
- Eligible?
- —
Personal DTI + credit; lowest rate.
DSCR
20% down · 8.5% · 30yr
- Down + closing
- —
- Monthly P&I
- —
- Monthly cashflow
- —
- DSCR
- —
- Eligible?
- —
No personal income docs; deal must DSCR.
Hard money
10% down · 12.0% · 12mo
- Down + closing
- —
- Monthly P&I
- —
- Monthly cashflow
- —
- DSCR
- —
- Eligible?
- —
Short-term bridge; refi at stabilization.
Rent comps 40 comps
| Address | Beds | Baths | Sqft | Rent | $/sqft | DOM | Units | Dist |
|---|---|---|---|---|---|---|---|---|
| 43814 W Cypress Ln Maricopa, AZ | 4.0 | 2.0 | 2170 | $2,095 | $0.97 | 43d | 1 | 0.15mi |
| 43760 W Cypress Ln Maricopa, AZ | 4.0 | 2.0 | 2142 | $2,000 | $0.93 | 43d | 1 | 0.17mi |
| 18283 N Presley Ln Maricopa, AZ | 3.0 | 2.5 | 2156 | $2,000 | $0.93 | 24d | 1 | 0.40mi |
| 43371 W Elizabeth Ave Maricopa, AZ | 4.0 | 2.5 | 2274 | $1,739 | $0.76 | 43d | 1 | 0.45mi |
| 43361 W Elizabeth Ave Maricopa, AZ | 3.0 | 2.0 | 1509 | $1,795 | $1.19 | 24d | 1 | 0.45mi |
| 43811 W Elizabeth Ave Maricopa, AZ | 3.0 | 2.0 | 1509 | $1,575 | $1.04 | 24d | 1 | 0.50mi |
| 43205 W Jeremy St Maricopa, AZ | 3.0 | 2.0 | 1699 | $1,850 | $1.09 | 5d | 1 | 0.61mi |
| 44928 W Zion Rd Maricopa, AZ | 3.0 | 2.5 | 1875 | $1,950 | $1.04 | 43d | 1 | 0.64mi |
| 43194 W Jeremy St Maricopa, AZ | 4.0 | 2.5 | 2424 | $1,699 | $0.70 | 43d | 1 | 0.64mi |
| 18967 N Leland Rd Maricopa, AZ | 4.0 | 2.5 | 2275 | $1,000 | $0.44 | 4d | 1 | 0.64mi |
| 43250 W Estrada St Maricopa, AZ | 4.0 | 2.0 | 2349 | $1,950 | $0.83 | 24d | 1 | 0.69mi |
| 43386 W Arizona Ave Maricopa, AZ | 4.0 | 3.0 | 2274 | $1,839 | $0.81 | 12d | 1 | 0.72mi |
| 43386 W Arizona Ave Maricopa, AZ | 4.0 | 3.0 | 2274 | $1,839 | $0.81 | 22d | 1 | 0.72mi |
| 45129 W Desert Cedars Ln Maricopa, AZ | 4.0 | 2.0 | 1753 | $1,875 | $1.07 | 5d | 1 | 0.74mi |
| 43269 W Arizona Ave Maricopa, AZ | 4.0 | 2.0 | 1533 | $1,695 | $1.11 | 43d | 1 | 0.74mi |
| 43410 W Wild Horse Trl Maricopa, AZ | 4.0 | 2.0 | 2349 | $1,845 | $0.79 | 11d | 1 | 0.76mi |
| 42725 W Martie Lynn Rd Maricopa, AZ | 3.0 | 2.0 | 1509 | $2,015 | $1.34 | 24d | 1 | 0.77mi |
| 18426 N Lariat Rd Maricopa, AZ | 4.0 | 2.5 | 2567 | $1,995 | $0.78 | 43d | 1 | 0.82mi |
| 19680 N Ortman Cir Maricopa, AZ | 3.0 | 2.0 | 1975 | $1,700 | $0.86 | 2d | 1 | 0.87mi |
| 19676 N Locke Ct Maricopa, AZ | 4.0 | 3.0 | 2466 | $1,995 | $0.81 | 43d | 1 | 0.91mi |
| 42495 W Monteverde Dr Maricopa, AZ | 3.0 | 2.0 | 1484 | $2,500 | $1.68 | 43d | 1 | 0.93mi |
| 44151 W Palmen Dr Maricopa, AZ | 4.0 | 2.5 | 2604 | $2,350 | $0.90 | 18d | 1 | 0.98mi |
| 44000 W Palo Olmo Rd Maricopa, AZ | 3.0 | 2.0 | 1853 | $1,850 | $1.00 | 43d | 1 | 0.99mi |
| 45539 W Sky Ln Maricopa, AZ | 4.0 | 2.0 | 1831 | $1,909 | $1.04 | 2d | 1 | 1.00mi |
| 45556 W Tucker Rd Maricopa, AZ | 4.0 | 2.0 | 2152 | $1,795 | $0.83 | 43d | 1 | 1.01mi |
| 44216 W Palmen Dr Maricopa, AZ | 4.0 | 2.5 | 2604 | $1,895 | $0.73 | 43d | 1 | 1.01mi |
| 43223 W Neely Dr Maricopa, AZ | 4.0 | 2.0 | 2223 | $2,900 | $1.30 | 16d | 1 | 1.03mi |
| 44425 W Oster Dr Maricopa, AZ | 4.0 | 2.5 | 2500 | $2,200 | $0.88 | 5d | 1 | 1.06mi |
| 43368 W Palmen Dr Maricopa, AZ | 4.0 | 2.5 | 2200 | $1,889 | $0.86 | 43d | 1 | 1.07mi |
| 44124 W Palo Cedro Rd Maricopa, AZ | 3.0 | 2.0 | 1619 | $1,595 | $0.99 | 43d | 1 | 1.11mi |
| 42381 W Mira Ct Maricopa, AZ | 3.0 | 2.0 | 1584 | $1,795 | $1.13 | 43d | 1 | 1.14mi |
| 42381 W Mira Ct Maricopa, AZ | 3.0 | 2.0 | 1584 | $1,795 | $1.13 | 24d | 1 | 1.14mi |
| 45779 W Tucker Rd Maricopa, AZ | 4.0 | 2.0 | 1925 | $2,199 | $1.14 | 24d | 1 | 1.14mi |
| 19165 N Ventana Ln Maricopa, AZ | 3.0 | 2.0 | 1440 | $1,650 | $1.15 | 24d | 1 | 1.15mi |
| 44415 W Knauss Dr Maricopa, AZ | 4.0 | 2.5 | 2454 | $1,895 | $0.77 | 43d | 1 | 1.16mi |
| 18184 N Calacera St Maricopa, AZ | 3.0 | 2.0 | 1603 | $1,795 | $1.12 | 16d | 1 | 1.17mi |
| 45579 W Dutchman Dr Maricopa, AZ | 4.0 | 2.5 | 2777 | $2,095 | $0.75 | 16d | 1 | 1.19mi |
| 42275 W Calle St Maricopa, AZ | 4.0 | 3.0 | 1807 | $2,050 | $1.13 | 43d | 1 | 1.19mi |
| 42275 W Calle St Maricopa, AZ | 4.0 | 3.0 | 1807 | $2,050 | $1.13 | 3d | 1 | 1.19mi |
| 45811 W Amsterdam Rd Maricopa, AZ | 3.0 | 2.0 | 1993 | $1,700 | $0.85 | 43d | 1 | 1.19mi |
HOA detail
- Monthly dues
- $60 · $720/yr
- Likely covers
- landscaping
Listing history 50 events
-
2026-06-18days on market $333,900 Active 64 DOM
-
2026-06-17days on market $333,900 Active 63 DOM
-
2026-06-16days on market $333,900 Active 62 DOM
-
2026-06-15days on market $333,900 Active 61 DOM
-
2026-06-13days on market $333,900 Active 59 DOM
-
2026-06-13days on market $333,900 Active 58 DOM
-
2026-06-09days on market $333,900 Active 55 DOM
-
2026-06-08days on market $333,900 Active 54 DOM
-
2026-06-07pricedays on market $333,900 Active 53 DOM
-
2026-06-04days on market $334,000 Active 50 DOM
-
2026-06-03days on market $334,000 Active 49 DOM
-
2026-06-02days on market $334,000 Active 48 DOM
-
2026-06-01days on market $334,000 Active 47 DOM
-
2026-05-31days on market $334,000 Active 46 DOM
-
2026-05-11price $334,000 1372-char remark
Show marketing remark (1372 chars)
This beautifully maintained 3-bedroom, 3-bath home offers the perfect blend of style, comfort, and functionality. From the moment you arrive, you'll appreciate the charming curb appeal with low-maintenance desert landscaping and a spacious 2-car garage. Inside, you'll find a warm and inviting interior featuring tall ceilings, a fresh designer color palette, and a thoughtful mix of tile and new plush carpeting in all the right places. The semi-open floor plan provides both comfortable separation and a natural flow for everyday living and entertaining. The eat-in kitchen is the heart of the home, showcasing new stainless steel appliances, granite countertops, recessed lighting, a walk-in pantry, and abundant white cabinetry. A two-tiered peninsula with breakfast bar makes it perfect for casual dining and gathering with guests. A versatile den adds valuable flex space--ideal for a home office, playroom, or cozy retreat. The spacious primary suite offers an en-suite bath with dual sinks, a walk-in closet, and great natural light. Two additional bedrooms and bathrooms provide plenty of room for family, guests, or hobbies. Step outside to a generously sized backyard with a covered patio--perfect for relaxing, entertaining, or enjoying Arizona evenings. Move-in ready and ideally located near shopping, dining, and parks--this is one you don't want to miss!
-
2026-04-15$339,000 Active 1372-char remark
Show marketing remark (1372 chars)
This beautifully maintained 3-bedroom, 3-bath home offers the perfect blend of style, comfort, and functionality. From the moment you arrive, you'll appreciate the charming curb appeal with low-maintenance desert landscaping and a spacious 2-car garage. Inside, you'll find a warm and inviting interior featuring tall ceilings, a fresh designer color palette, and a thoughtful mix of tile and new plush carpeting in all the right places. The semi-open floor plan provides both comfortable separation and a natural flow for everyday living and entertaining. The eat-in kitchen is the heart of the home, showcasing new stainless steel appliances, granite countertops, recessed lighting, a walk-in pantry, and abundant white cabinetry. A two-tiered peninsula with breakfast bar makes it perfect for casual dining and gathering with guests. A versatile den adds valuable flex space--ideal for a home office, playroom, or cozy retreat. The spacious primary suite offers an en-suite bath with dual sinks, a walk-in closet, and great natural light. Two additional bedrooms and bathrooms provide plenty of room for family, guests, or hobbies. Step outside to a generously sized backyard with a covered patio--perfect for relaxing, entertaining, or enjoying Arizona evenings. Move-in ready and ideally located near shopping, dining, and parks--this is one you don't want to miss!
-
2026-02-13historical
-
2025-12-08price $344,999
-
2025-10-22price $349,999
-
2025-08-15price $369,999
-
2025-07-07$380,000 Active
-
2016-08-26soldstatus $171,000 Closed
-
2016-08-26soldstatus $171,000
-
2016-08-06status Pending
-
2016-06-30historical Under Contract Accepting Backups
-
2016-06-15status Active
-
2016-06-14historical Under Contract Accepting Backups
-
2016-06-08price $172,000
-
2016-05-25$175,000 Active
-
2012-07-30soldstatus $139,000 Closed
-
2012-07-30soldstatus $139,000
-
2012-07-02status Pending
-
2012-06-22$139,900 Active
-
2012-05-25soldstatus $84,000
-
2011-03-14soldstatus $74,900 Closed
-
2011-02-05status Pending
-
2011-01-31$74,900 Active
-
2010-12-07historical
-
2010-12-02historical Under Contract Accepting Backups
-
2010-09-23price $73,900
-
2010-09-07price $79,900
-
2010-09-03status Active
-
2010-08-31historical Under Contract Accepting Backups
-
2010-08-20status Pending
-
2010-06-19historical Under Contract Accepting Backups
-
2010-06-10price $82,500
-
2010-05-17price $89,500
-
2010-05-10price $90,000
-
2010-04-29$95,000 Active
-
2004-02-03soldstatus $3,738,900
ⓘ Source: listings_history table (triggers on properties + properties_extension) + one-shot
backfill from property_details.listing_events for pre-trigger history.
Tax reassessment forecast AZ · Resets to sale price
- Current annual tax
- $2,097 · $175/mo
- Projected year-2 tax
- $2,204 · $184/mo
- Expected delta
- +$107/yr (+$9/mo · 5.1%)
ⓘ Screening estimate from a state-policy table — verify with the county assessor before closing.
Climate risk First Street
- Flood 4/10 Moderate FEMA zone X · 21% chance over 30 yrs
- Wildfire 6/10 Major
- Heat 9/10 Extreme 7 d/yr ≥114°F today · 19 d/yr by 30 yrs out
- Wind 1/10 Low
- Air quality 2/10 Low 1 unhealthy d/yr today · 1 by 30 yrs out
Nearby sold comps map
Loading sold comps map…
Walkable amenities ~0.75 mi
Loading nearby amenities…
Taxation est. · year 1
- Rental income
- $24,162
- − Mortgage interest
- −$18,704
- − Property taxes
- −$2,097
- − Insurance
- −$1,670
- − Repairs & maintenance
- −$1,933
- − Management
- −$1,933
- − HOA
- −$720
- − Depreciation
- −$9,713
- Taxable loss
- −$12,607
- Est. tax savings @ 24.0%
- +$3,026
- After-tax cash flow
- $-3,385/yr
For passive investors: Depreciation is non-cash, so a rental often shows a tax loss while cash-flowing — sheltering income. Rental losses are passive: they offset passive income freely, and up to $25,000/yr can offset ordinary (W-2) income if you actively participate and your MAGI is under $100k (phasing out to $0 by $150k); unused losses carry forward. On sale, claimed depreciation is recaptured at up to 25%, and gains may owe capital-gains tax (a 1031 exchange can defer both). Figures are a year-1 estimate at your 24.0% rate — not tax advice; consult a CPA.
Schools (NCES district)
- District
- Maricopa Unified School District (4441)
- NCES district ID
- 0404720
- Math proficiency
- 20% ▼ -18.00%
- Reading proficiency
- 29% ▼ -9.00%
- Median HH income
- $63,725
- Composite
- 22.92/100
- National rank
- #7993
- State rank
- #128 of 249 in AZ
Livability — Maricopa
- Score
- 72/100
- State rank
- #28
- US rank
- #5943
Category grades
Schools grade is shown separately in the Schools card above.
Census & demographics
- Census place
- Maricopa, AZ
- County
- Pinal County · 399,947 people
- City population
- 76,044
- Metro
- Phoenix-Mesa-Chandler, AZ
- Population (ZIP)
- 55,260
- Household income
- $95,867
- Rent vs Own
- Severe rent burden
- 432.0
Population outlook (Pinal County) Hauer SSP2
- Today (2025)
- 437,574 people
- By 2030
- 446,903 · +2.1%
- By 2040
- 452,589 · +3.4%
- By 2050
- 444,126 · +1.5%
- By 2075
- 430,300 · -1.7%
- By 2100
- 393,536 · -10.1%
Race, ethnicity, and origin ACS 2023
- Neighborhood character
- Diverse neighborhood (Simpson 0.69)
- Race & ethnicity
- White 45% Hispanic / Latino 30% Two or more races 17% Black 13% Native American 3% Asian 3% Pacific Islander 1%
- Hispanic origin (detail)
- Mexican 26% Puerto Rican 1%
- Common ancestry
- Lithuanian 2% Romanian 2% Italian 2%
- Foreign-born
- 10% · Canada
- Languages at home
- 79% English-only · Spanish 16% Other Asian/Pacific 1% Other Indo-European 1%
Political lean MEDSL · Pinal
- 2024 margin
- Strong R (+22.1) · D 38.5% · R 60.6%
- 2008→2024 swing
- -7.6pp toward R · 2008: -14.5pp · 2024: -22.1pp
- All cycles
- 2024: R+22.1 2020: R+17.3 2016: R+19.3 2012: R+17.1 2008: R+14.5
Not yet ingested
- Civics
- —
Market trends
- HPI YoY
- ▼ -0.89%
- Current HPI
- 258.1461
- Rent YoY
- ▲ 1.78%
- Metro
- Phoenix-Mesa-Chandler, AZ
- State GDP YoY
- ▲ 4.54%
- F500 in state
- 20
Industry mix (Fortune 500 HQ in AZ)
| Industry | F500 HQs | Revenue |
|---|---|---|
| Technology | 2 | $13B |
|
||
| Mining / Metals | 1 | $23B |
|
||
| Environmental Services | 1 | $16B |
|
||
| Metals / Steel | 1 | $14B |
|
||
| Technology Distribution | 1 | $9B |
|
||
| Homebuilding | 1 | $8B |
|
||
Price history
-91.1% since first listed36 events — show timeline
- 2026-05-11 Price Changed $334,000 ARMLS
- 2026-04-15 Listed $339,000 ARMLS
- 2026-02-13 Listing Removed — ARMLS
- 2025-12-08 Price Changed $344,999 ARMLS
- 2025-10-22 Price Changed $349,999 ARMLS
- 2025-08-15 Price Changed $369,999 ARMLS
- 2025-07-07 Listed $380,000 ARMLS
- 2016-08-26 Sold (Public Records) $171,000 Public Records
- 2016-08-26 Sold (MLS) $171,000 ARMLS
- 2016-08-06 Pending — ARMLS
- 2016-06-30 Contingent — ARMLS
- 2016-06-15 Relisted — ARMLS
- 2016-06-14 Contingent — ARMLS
- 2016-06-08 Price Changed $172,000 ARMLS
- 2016-05-25 Listed $175,000 ARMLS
- 2012-07-30 Sold (Public Records) $139,000 Public Records
- 2012-07-30 Sold (MLS) $139,000 ARMLS
- 2012-07-02 Pending — ARMLS
- 2012-06-22 Listed $139,900 ARMLS
- 2012-05-25 Sold (Public Records) $84,000 Public Records
- 2011-03-14 Sold (MLS) $74,900 ARMLS
- 2011-02-05 Pending — ARMLS
- 2011-01-31 Listed $74,900 ARMLS
- 2010-12-07 Listing Removed — ARMLS
- 2010-12-02 Contingent — ARMLS
- 2010-09-23 Price Changed $73,900 ARMLS
- 2010-09-07 Price Changed $79,900 ARMLS
- 2010-09-03 Relisted — ARMLS
- 2010-08-31 Contingent — ARMLS
- 2010-08-20 Pending — ARMLS
- 2010-06-19 Contingent — ARMLS
- 2010-06-10 Price Changed $82,500 ARMLS
- 2010-05-17 Price Changed $89,500 ARMLS
- 2010-05-10 Price Changed $90,000 ARMLS
- 2010-04-29 Listed $95,000 ARMLS
- 2004-02-03 Sold (Public Records) $3,738,900 Public Records
Property tax history
-0.1%/yrLatest (2025): $2,097 · +3.6% YoY. Source: county tax records.
Cash-flow waterfall
monthlySold comps — $/sqft
last 12 mo · ≤1 miLoading sold comps…