6705 S Santa Fe Dr Lot 43 · Littleton, CO
Flood risk 4/10 · Minor
- FEMA flood zone
- X (unshaded)
- Chance of flooding over 30 yrs
- 0.22%
- Est. flood insurance / yr
- $507 – $1,088
Fire risk 2/10 · Minimal
- Est. fire insurance / yr
- $939 – $1,743
Heat risk 3/10 · Minor
- Hot days now (above 91°F)
- 7 days/yr
- Hot days in 30 yrs
- 20 days/yr
Wind risk 2/10 · Minimal
- Chance of severe wind over 30 yrs
- —
Air-quality risk 3/10 · Minor
- Unhealthy air days now
- 2 days/yr
- Unhealthy air days in 30 yrs
- 3 days/yr
Risk factors via First Street. Map © Google.
Why this score? — see what drove the B- grade
The composite is a weighted blend of 9 inputs, each scored 0–100. Each bar is that input's sub-score; the figure is the points it added to the 100-point composite (weight × sub-score).
- Cash flow +30.0/30.0
- DSCR +10.0/10.0
- 1% rule +8.3/10.0
- ARV discount +7.5/15.0
- Schools +5.3/10.0
- Livability +3.5/5.0
- Condition / age +2.5/5.0
- Rent growth +2.3/5.0
- Appreciation +0.0/10.0
$179,000
🖨 Deal sheet (PDF) 📄 Offer letter ✓ Due diligence
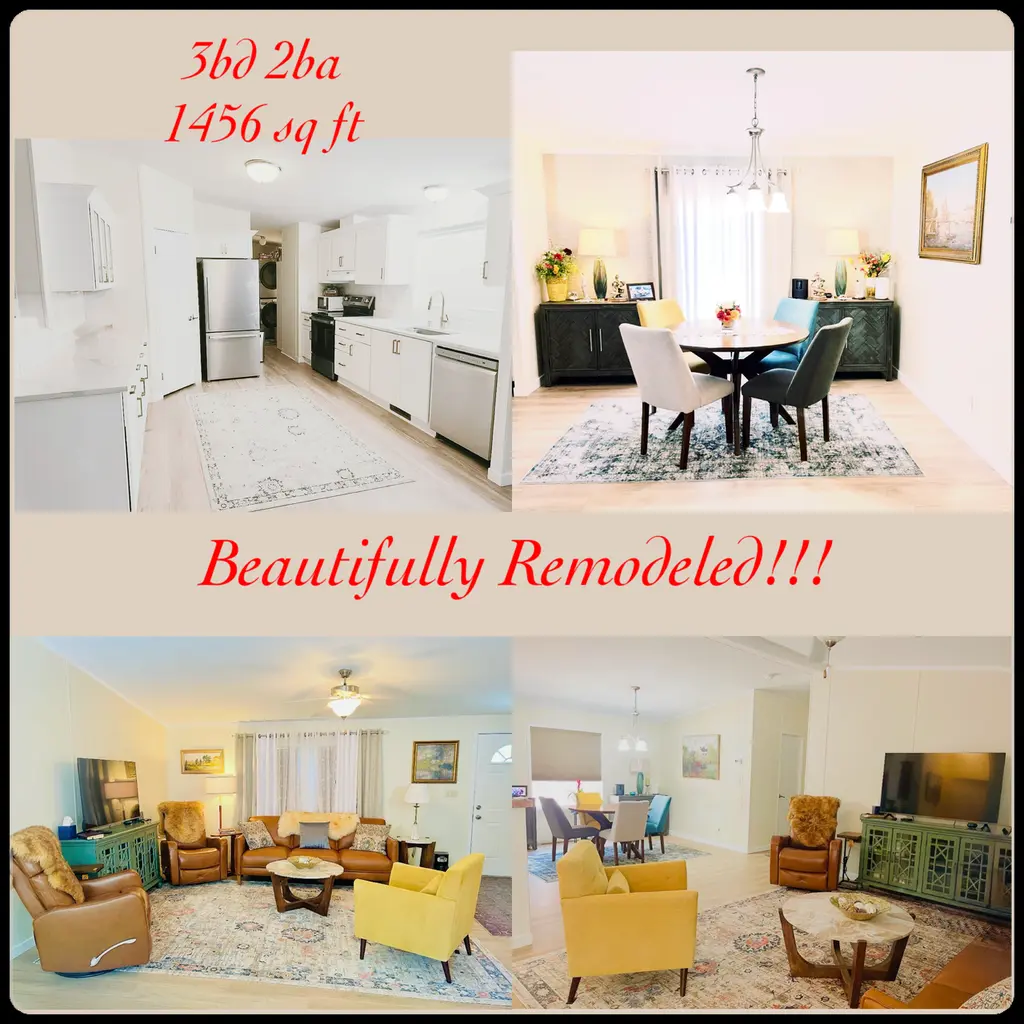
Listing remarks
MUST SEE THIS HOME WITH SPLIT FLOORPLAN AND UPGRADES YOU& apos; D LOVE -- Welcome to this Inviting, Better than New Home! This Home is Designed for Comfort and Convenience!!! MAINTENANCE FREE LIVING!!! Offering a Spacious and Functional Layout!!! Available Furnished (for an additional cost) or Unfurnished 3bd 2ba plus Laundry Room! Open floor plan design, Vaulted ceilings yet Cozy and Very Comfortable Home! Central Air and Heating! South Facing with Mature Trees! Best Location and Resident Owned 55+Plus Community in Littleton, CO! Walking distance to the South Platte River including bike and walking trails! Short walk to The Hudson Gard
Key facts
- Split floorplan
- South facing
- Mature trees
Tags
Property features AI
Finance
- HOA & community: Located in Meadowood Village MH Park
Exterior
- Home design: Manufactured home in a mobile home park; Built in 2011
- Construction: Manufactured construction; Year built 2011
- Exterior features: Patio; Located in Meadowood Village MH Park
Interior
- Kitchen: Dishwasher; Microwave; Refrigerator
- Interior features: Pantry; Patio
Neighborhood map
What this means for you Summary
Snapshot
- This is a 3-bed/2.0-bath manufactured listed at $179k.
Deal economics
- At list price, monthly cash flow is $825 ($10k/yr) — positive.
- The deal already cash-flows at list — no discount required.
- Meets the 1% rule at list price ($2k rent vs $179k).
- Recommended offer: $176k (1.5% below list) — sets the bar for market timing.
- Cap rate 11.8% vs local median 2.2% in Littleton — top-decile yield for the area; either an underpriced asset or a hidden risk that comps aren't pricing in. Stress-test before assuming the spread holds.
Location & tenants
- Location reads 69/100 on livability (#95 in CO) — a middle-class / working-renter tenant base. Strengths: commute A+, employment A+, housing A-; Watch: cost of living F, health & safety F.
- Littleton School District No. 6 In The County Of Arapahoe (suburban): math 50% / reading 69% proficiency, ranked #5 of 86 in CO (top 6%) — acceptable for families but not a draw, mixed tenant base, ~2y average lease; only 16% free/reduced lunch — higher-income household profile.
- Zoned schools: Centennial Academy of Fine Arts Education (math 5% / reading 52%, grade F, #534 of 966 statewide, top 56%, 370 students, 32% FRL); Goddard Middle School (math 37% / reading 52%, grade D, #56 of 270 statewide, top 23%, 552 students, 30% FRL); Heritage High School (math 48% / reading 78%, grade B-, #40 of 381 statewide, top 10%, 1,754 students, 10% FRL).
- Zoned-school proficiency averages 45% at this address vs 60% district-wide (-14 pts) — the specific schools serving this property underperform the Littleton School District No. 6 In The County Of Arapahoe average; the district grade overstates school quality for this exact location.
- Market conditions: Rents soft (-0.9%/yr); 156 active listings in the ZIP; 11 comparable units currently listed for rent nearby; rentals leasing fast (median 5d on market — plan ~1-2 weeks tenant-placement turnaround); solid renter incomes; 3,927 units permitted in Arapahoe County in 2024 (1,525 in 5+ unit buildings).
- This rent runs 30% of the median local income ($94k/yr) — at the standard rent-burdened threshold; future hikes will face affordability resistance.
Forward outlook
- Local home prices are declining (-3.0%/yr); year-one equity from $1k of loan paydown is wiped out by about $5k of value loss. Plan a longer hold.
- Arapahoe County population projected at +39% by 2050 — long-run rental-demand tailwind backs the buy-and-hold thesis.
- At projected returns (-3.0% appreciation + 0.0% rent growth), your $50k cash investment doubles in ~8 years — after that, you're playing with house money.
Negotiation context
- It's been on market 15 days — a 2% lower offer ($176k) is reasonable based on typical stale-listing flexibility.
Questions for the listing agent
- Is there a deadline driving the sale (1031 exchange, divorce, estate, relocation)? That informs how much negotiation room exists.
- Schools are B-rated — typically a magnet for longer-tenancy family renters. What's the average tenant stay here, and is there a school-zone premium baked into asking?
- What's the average days-on-market for RENTAL listings here right now (not sales)? A rising rental-DOM trend means longer vacancies and softer asking-rent achievability than the comps imply.
- What's the recent tenant-quality profile in this submarket — average credit score on applications, eviction rate, late-payment / NSF rate, and stable-employment percentage? A property-management company in the area should have these aggregated.
- How much new for-sale + rental construction is in the pipeline within 1–3 miles? Heavy new supply typically softens prices + rents 12–24 months out; constrained supply supports both.
Investment metrics
- 1% rule
- 1.33% ✓
- Cap rate
- 11.83%
- Cash-on-cash
- 19.76%
- DSCR
- 1.88
- GRM
- 6.2
CMA / ARV
- ARV (on-the-fly)
- $58,968
- Comps found
- 1
Show comp detail 1 sale within ~0.75 mi
| Address | Dist | Beds/Ba | Sqft | Sold | Price | $/sf | Match |
|---|---|---|---|---|---|---|---|
| 6705 S Santa Fe Dr | 0.04mi | 3/2.0 | 1,216 (-13%) | 8mo | $51,500 | $42 | 69 |
Match score weights: distance 35% · size 25% · config 20% · recency 20%. Top-matched comps best support the ARV.
Projected returns pro-forma
-3.0% appreciation · 0.0% rent growth · sell at horizon
- IRR
- 8.7%
- Equity multiple
- 1.33×
- Total profit
- $16,500
- Equity at exit
- $26,689
- IRR
- 15.4%
- Equity multiple
- 2.09×
- Total profit
- $54,737
- Equity at exit
- $15,477
Cash invested: $50,120 (down + closing). Projections, not guarantees.
Landlord ↔ Tenant lean methodology
- Overall (STATE)
- 38 Tenant-Leaning
- State Colorado
- 38 Tenant-Leaning · D+4
- County
- — inherits STATE
- City
- — inherits STATE
ZIP-level market 80120
- Rents YoY
- -0.9%
- Active inventory
- 156
- Price-to-rent
- 6.2×
Monthly cashflow live
- Estimated rent
- $2,387 high interval (Pro) →
- Mortgage (P&I)
- −$939
- Tax from tax record
- −$47 /mo · $561/yr
- Insurance
- −$75
- HOA
- −$0
- Vacancy / Maint / Mgmt
- −$501
- Net cashflow
- $825
Break-even live
Sensitivity live
| Price | -10% $927 | -5% $876 | +0% $825 | +5% $775 | +10% $724 |
|---|---|---|---|---|---|
| Rent | -10% $637 | -5% $731 | +0% $825 | +5% $920 | +10% $1,014 |
| Rate | -1.0pp $916 | -0.5pp $871 | base $825 | +0.5pp $779 | +1.0pp $732 |
UW: 25.0% down · 7.5% · 30yr · 1.5% tax · 5.0% vac · 8.0% maint · 8.0% mgmt
Financing live
Cash to close
- Down payment
- $44,750
- Closing costs
- $5,370
- Reserves months
- —
- Total cash needed
- —
Loan-product check · same deal, 3 products live
Conventional
25% down · 7.5% · 30yr
- Down + closing
- —
- Monthly P&I
- —
- Monthly cashflow
- —
- DSCR
- —
- Eligible?
- —
Personal DTI + credit; lowest rate.
DSCR
20% down · 8.5% · 30yr
- Down + closing
- —
- Monthly P&I
- —
- Monthly cashflow
- —
- DSCR
- —
- Eligible?
- —
No personal income docs; deal must DSCR.
Hard money
10% down · 12.0% · 12mo
- Down + closing
- —
- Monthly P&I
- —
- Monthly cashflow
- —
- DSCR
- —
- Eligible?
- —
Short-term bridge; refi at stabilization.
Rent comps 11 comps
| Address | Beds | Baths | Sqft | Rent | $/sqft | DOM | Units | Dist |
|---|---|---|---|---|---|---|---|---|
| 6419 S Vinewood St Littleton, CO | 2.0–3.0 | 1.0–2.0 | 1057 | $2,615 | $2.47 | 0d | 10 | 0.28mi |
| 7132 S Bryant St #233 Littleton, CO | 2.0 | 2.0 | 1050 | $1,795 | $1.71 | 0d | 1 | 0.62mi |
| 7317 S Platte River Pkwy Littleton, CO | 1.0–3.0 | 1.0–2.0 | 1076 | $3,108 | $2.89 | 0d | 17 | 0.73mi |
| 2268 W Maplewood Ave Littleton, CO | 3.0 | 2.0 | 1650 | $2,695 | $1.63 | 23d | 1 | 0.84mi |
| 2258 W Maplewood Ave Littleton, CO | 3.0 | 2.0 | 1650 | $2,595 | $1.57 | 26d | 1 | 0.84mi |
| 4379 W Ponds Cir Littleton, CO | 2.0 | 1.5 | 1758 | $2,300 | $1.31 | 3d | 1 | 1.16mi |
| 5754 S Lowell Way Littleton, CO | 1.0–2.0 | 1.0–2.0 | 1053 | $1,795 | $1.70 | 4d | 5 | 1.26mi |
| 5820 S Windermere St Littleton, CO | 2.0 | 1.0–2.0 | 639 | $1,780 | $2.79 | 4d | 10 | 1.39mi |
| 2248 W Powers Ave Littleton, CO | 2.0 | 4.0 | 1656 | $3,500 | $2.11 | 6d | 1 | 1.41mi |
| 2949 W Riverwalk Cir Unit A Littleton, CO | 3.0 | 2.0 | 1404 | $1,400 | $1.00 | 26d | 1 | 1.42mi |
| 5907 S Gallup St Littleton, CO | 2.0 | 2.0 | 975 | $1,824 | $1.87 | 4d | 2 | 1.46mi |
Listing history 10 events
-
2026-06-21pricedays on market $179,000 Active 15 DOM
-
2026-06-18days on market $185,000 Active 12 DOM
-
2026-06-17days on market $185,000 Active 11 DOM
-
2026-06-16days on market $185,000 Active 10 DOM
-
2026-06-15days on market $185,000 Active 9 DOM
-
2026-06-13days on market $185,000 Active 7 DOM
-
2026-06-09days on market $185,000 Active 3 DOM
-
2026-06-08days on market $185,000 Active 2 DOM
-
2026-06-07remarks 695-char remark
-
2026-06-07$185,000 Active 1 DOM
ⓘ Source: listings_history table (triggers on properties + properties_extension) + one-shot
backfill from property_details.listing_events for pre-trigger history.
Tax reassessment forecast CO · Resets to sale price
- Current annual tax
- $561 · $47/mo
- Projected year-2 tax
- $984 · $82/mo
- Expected delta
- +$423/yr (+$35/mo · 75.4%)
ⓘ Screening estimate from a state-policy table — verify with the county assessor before closing.
Climate risk First Street
- Flood 4/10 Moderate FEMA zone X (unshaded) · 22% chance over 30 yrs
- Wildfire 2/10 Low
- Heat 3/10 Moderate 7 d/yr ≥91°F today · 20 d/yr by 30 yrs out
- Wind 2/10 Low
- Air quality 3/10 Moderate 2 unhealthy d/yr today · 3 by 30 yrs out
Nearby sold comps map
Loading sold comps map…
Walkable amenities ~0.75 mi
Loading nearby amenities…
Taxation est. · year 1
- Rental income
- $28,640
- − Mortgage interest
- −$10,027
- − Property taxes
- −$561
- − Insurance
- −$895
- − Repairs & maintenance
- −$2,291
- − Management
- −$2,291
- − Depreciation
- −$5,207
- Taxable income
- $7,368
- Est. tax owed @ 24.0%
- −$1,768
- After-tax cash flow
- $8,137/yr
For passive investors: Depreciation is non-cash, so a rental often shows a tax loss while cash-flowing — sheltering income. Rental losses are passive: they offset passive income freely, and up to $25,000/yr can offset ordinary (W-2) income if you actively participate and your MAGI is under $100k (phasing out to $0 by $150k); unused losses carry forward. On sale, claimed depreciation is recaptured at up to 25%, and gains may owe capital-gains tax (a 1031 exchange can defer both). Figures are a year-1 estimate at your 24.0% rate — not tax advice; consult a CPA.
Schools (NCES district)
- District
- Littleton School District No. 6 In The County Of Arapahoe
- NCES district ID
- 0805310
- Math proficiency
- 50% ▼ -3.00%
- Reading proficiency
- 69% ▲ 3.00%
- Median HH income
- $72,130
- Composite
- 52.7/100
- National rank
- #1551
- State rank
- #5 of 86 in CO
Livability — Littleton
- Score
- 69/100
- State rank
- #95
- US rank
- #8386
Category grades
Schools grade is shown separately in the Schools card above.
Census & demographics
- Census place
- Littleton, CO
- County
- Arapahoe County · 715,018 people
- City population
- 126,616
- Metro
- Denver-Aurora-Lakewood, CO
- Population (ZIP)
- 29,725
- Household income
- $94,296
- Rent vs Own
- Severe rent burden
- 1527.0
Population outlook (Arapahoe County) Hauer SSP2
- Today (2025)
- 757,407 people
- By 2030
- 819,724 · +8.2%
- By 2040
- 940,367 · +24.2%
- By 2050
- 1,053,720 · +39.1%
- By 2075
- 1,297,693 · +71.3%
- By 2100
- 1,412,796 · +86.5%
Race, ethnicity, and origin ACS 2023
- Neighborhood character
- Predominantly White (80%)
- Race & ethnicity
- White 80% Hispanic / Latino 12% Two or more races 8% Black 2% Asian 2%
- Hispanic origin (detail)
- Mexican 9%
- Common ancestry
- Italian 6% Slovak 4% Romanian 3%
- Foreign-born
- 6% · Canada
- Languages at home
- 90% English-only · Spanish 7% Other Indo-European 1% French/Haitian/Cajun 1%
Political lean MEDSL · Arapahoe
- 2024 margin
- Strong D (+20.1) · D 58.6% · R 38.5% · Other 2.9%
- 2008→2024 swing
- +7.2pp toward D · 2008: 12.9pp · 2024: 20.1pp
- All cycles
- 2024: D+20.1 2020: D+24.6 2016: D+13.8 2012: D+8.3 2008: D+12.9
Not yet ingested
- Civics
- —
Market trends
- HPI YoY
- ▼ -478.26%
- Current HPI
- 272.6876
- Rent YoY
- ▼ -0.95%
- Metro
- Denver-Aurora-Lakewood, CO
- State GDP YoY
- ▲ 1.95%
- F500 in state
- 14
Industry mix (Fortune 500 HQ in CO)
| Industry | F500 HQs | Revenue |
|---|---|---|
| Technology Distribution | 1 | $31B |
|
||
| Food / Agriculture | 1 | $18B |
|
||
| Packaging | 1 | $14B |
|
||
| Healthcare | 1 | $13B |
|
||
| Energy | 1 | $10B |
|
||
| Technology | 1 | $4B |
|
||
Price history
1 event — show timeline
- 2026-06-06 Listed $185,000 FSBO.com
Property tax history
+7.8%/yrLatest (2025): $561 · +250.1% YoY. Source: county tax records.
Cash-flow waterfall
monthlySold comps — $/sqft
last 12 mo · ≤1 miLoading sold comps…