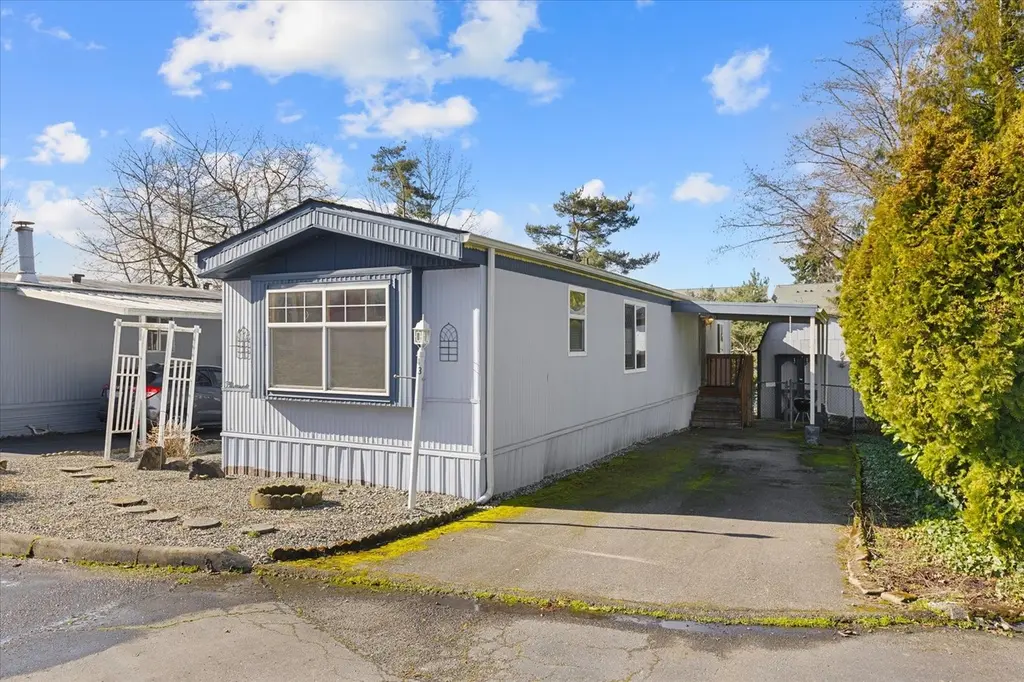
4111 164th St SW #43 · North Lynnwood, WA
Flood risk No data
- FEMA flood zone
- —
- Chance of flooding over 30 yrs
- —
- Est. flood insurance / yr
- —
Fire risk No data
- Est. fire insurance / yr
- —
Heat risk No data
- Hot days now (above threshold)
- —
- Hot days in 30 yrs
- —
Wind risk No data
- Chance of severe wind over 30 yrs
- —
Air-quality risk No data
- Unhealthy air days now
- —
- Unhealthy air days in 30 yrs
- —
Risk factors via First Street. Map © Google.
Why this score? — see what drove the A- grade
The composite is a weighted blend of 9 inputs, each scored 0–100. Each bar is that input's sub-score; the figure is the points it added to the 100-point composite (weight × sub-score).
- Cash flow +30.0/30.0
- ARV discount +15.0/15.0
- 1% rule +10.0/10.0
- DSCR +10.0/10.0
- Schools +5.4/10.0
- Livability +4.5/5.0
- Rent growth +2.8/5.0
- Condition / age +2.5/5.0
- Appreciation +0.0/10.0
$54,950
🖨 Deal sheet (PDF) 📄 Offer letter ✓ Due diligence
Listing remarks
55+ Community Opportunity knocks! Spacious living room, dining area and 2 bedrooms. Kitchen has eating area with large picture window to offer plenty of natural light. Built-ins and generous storage throughout, plus a large detached shed with electricity—ideal for hobbies or workspace. Tandem 3 car covered carport adds convenience. Corner unit gives plenty of privacy. Pet-friendly community near Alderwood Mall with easy access to I-5 and 405. Why rent when you can own for less? Bring your vision and make it yours! Amazing potential for sweat equity.
Key facts
- Tandem carport
- Large picture window
- Corner unit
Tags
Neighborhood map
What this means for you Summary
Snapshot
- This is a 2-bed/1.0-bath manufactured listed at $55k.
Deal economics
- At list price, monthly cash flow is $1k ($17k/yr) — positive.
- The deal already cash-flows at list — no discount required.
- Meets the 1% rule at list price ($2k rent vs $55k).
- Recommended offer: $50k (9.0% below list) — sets the bar for market timing.
- Cap rate 37.6% vs local median 2.3% in North Lynnwood — top-decile yield for the area; either an underpriced asset or a hidden risk that comps aren't pricing in. Stress-test before assuming the spread holds.
Location & tenants
- Location reads 90/100 on livability (#6 in WA, #107 nationally) — a professional / high-income tenant draw. Strengths: schools A+, amenities A+, commute A+; Watch: cost of living F.
- Edmonds School District (suburban): math 54% / reading 65% proficiency, ranked #53 of 291 in WA (top 18%) — acceptable for families but not a draw, mixed tenant base, ~2y average lease.
- Market conditions: Rents rising (+1.2%/yr); 232 active listings in the ZIP; 40 comparable units currently listed for rent nearby; rentals leasing fast (median 3d on market — plan ~1-2 weeks tenant-placement turnaround); solid renter incomes; 3,982 units permitted in Snohomish County in 2024 (1,492 in 5+ unit buildings).
Forward outlook
- Local home prices are declining (-3.0%/yr); year-one equity from $380 of loan paydown is wiped out by about $2k of value loss. Plan a longer hold.
- Snohomish County population projected at +30% by 2050 — long-run rental-demand tailwind backs the buy-and-hold thesis.
- At projected returns (-3.0% appreciation + 1.2% rent growth), your $15k cash investment doubles in ~1 year — after that, you're playing with house money.
Negotiation context
- It's been on market 111 days — a 9% lower offer ($50k) is reasonable based on typical stale-listing flexibility.
Questions for the listing agent
- It's been on market 111 days. Have you received any prior offers? Is the seller open to a 9% concession, seller financing, or rate buy-down credit?
- Built in 1977 — when were the roof, HVAC, electrical panel, plumbing, and water heater last replaced?
- Why hasn't it sold? Are there any deal-killer items the seller is aware of (foundation, flood, title, zoning, code violations)?
- Is there a deadline driving the sale (1031 exchange, divorce, estate, relocation)? That informs how much negotiation room exists.
- Schools are A-rated — typically a magnet for longer-tenancy family renters. What's the average tenant stay here, and is there a school-zone premium baked into asking?
- What's the average days-on-market for RENTAL listings here right now (not sales)? A rising rental-DOM trend means longer vacancies and softer asking-rent achievability than the comps imply.
- What's the recent tenant-quality profile in this submarket — average credit score on applications, eviction rate, late-payment / NSF rate, and stable-employment percentage? A property-management company in the area should have these aggregated.
- How much new for-sale + rental construction is in the pipeline within 1–3 miles? Heavy new supply typically softens prices + rents 12–24 months out; constrained supply supports both.
Investment metrics
- 1% rule
- 4.09% ✓
- Cap rate
- 37.65%
- Cash-on-cash
- 111.98%
- DSCR
- 5.98
- GRM
- 2.0
CMA / ARV
- ARV (median comp)
- $99,146
- List price
- $54,950
- Delta
- -44.58%
- Verdict
- UNDERPRICED
- Comps
- 14 within 1.0 mi
Show comp detail 3 sales within ~0.75 mi
| Address | Dist | Beds/Ba | Sqft | Sold | Price | $/sf | Match |
|---|---|---|---|---|---|---|---|
| 4111 164th St SW #36 | 0.00mi | 2/1.0 | 924 (+10%) | 4mo | $39,900 | $43 | 80 |
| 4111 164th St SW #16 | 0.00mi | 2/2.0 | 952 (+13%) | 0mo | $40,000 | $42 | 73 |
| 3832 164th St SW #10 | 0.27mi | 2/2.0 | 924 (+10%) | 11mo | $113,556 | $123 | 57 |
Match score weights: distance 35% · size 25% · config 20% · recency 20%. Top-matched comps best support the ARV.
Projected returns pro-forma
-3.0% appreciation · 1.22% rent growth · sell at horizon
- IRR
- —
- Equity multiple
- 6.11×
- Total profit
- $78,598
- Equity at exit
- $8,193
- IRR
- —
- Equity multiple
- 12.09×
- Total profit
- $170,572
- Equity at exit
- $4,751
Cash invested: $15,386 (down + closing). Projections, not guarantees.
Landlord ↔ Tenant lean methodology
- Overall (STATE)
- 28 Tenant-Leaning
- State Washington
- 28 Tenant-Leaning · D+8
- County
- — inherits STATE
- City
- — inherits STATE
ZIP-level market 98087
- Rents YoY
- 1.2%
- Active inventory
- 232
- Price-to-rent
- 2.0×
Monthly cashflow live
- Estimated rent
- $2,248 high interval (Pro) →
- Mortgage (P&I)
- −$288
- Tax from tax record
- −$29 /mo · $350/yr
- Insurance
- −$23
- HOA
- −$0
- Vacancy / Maint / Mgmt
- −$472
- Net cashflow
- $1,436
Break-even live
Sensitivity live
| Price | -10% $1,467 | -5% $1,451 | +0% $1,436 | +5% $1,420 | +10% $1,405 |
|---|---|---|---|---|---|
| Rent | -10% $1,258 | -5% $1,347 | +0% $1,436 | +5% $1,525 | +10% $1,613 |
| Rate | -1.0pp $1,464 | -0.5pp $1,450 | base $1,436 | +0.5pp $1,422 | +1.0pp $1,407 |
UW: 25.0% down · 7.5% · 30yr · 1.5% tax · 5.0% vac · 8.0% maint · 8.0% mgmt
Financing live
Cash to close
- Down payment
- $13,738
- Closing costs
- $1,648
- Reserves months
- —
- Total cash needed
- —
Loan-product check · same deal, 3 products live
Conventional
25% down · 7.5% · 30yr
- Down + closing
- —
- Monthly P&I
- —
- Monthly cashflow
- —
- DSCR
- —
- Eligible?
- —
Personal DTI + credit; lowest rate.
DSCR
20% down · 8.5% · 30yr
- Down + closing
- —
- Monthly P&I
- —
- Monthly cashflow
- —
- DSCR
- —
- Eligible?
- —
No personal income docs; deal must DSCR.
Hard money
10% down · 12.0% · 12mo
- Down + closing
- —
- Monthly P&I
- —
- Monthly cashflow
- —
- DSCR
- —
- Eligible?
- —
Short-term bridge; refi at stabilization.
Rent comps 40 comps
| Address | Beds | Baths | Sqft | Rent | $/sqft | DOM | Units | Dist |
|---|---|---|---|---|---|---|---|---|
| 4217 164th St SW Unit A204 Lynnwood, WA | 3.0 | 2.0 | 1100 | $2,450 | $2.23 | 44d | 1 | 0.11mi |
| 3805 164th St SW Lynnwood, WA | 1.0–2.0 | 1.0–2.0 | 843 | $2,295 | $2.72 | 2d | 5 | 0.20mi |
| 15914 44th Ave W Lynnwood, WA | 1.0–2.0 | 1.0–2.0 | 932 | $2,159 | $2.32 | 2d | 10 | 0.26mi |
| 3711 164th St SW Lynnwood, WA | 1.0–2.0 | 1.0–2.0 | 845 | $2,514 | $2.97 | 0d | 7 | 0.27mi |
| 2510 164th St SW Lynnwood, WA | 3.0 | 1.0–2.0 | 998 | $2,662 | $2.67 | 0d | 1 | 0.32mi |
| 15700 44th Ave W Lynnwood, WA | 1.0–3.0 | 1.0–2.0 | 940 | $1,979 | $2.11 | 3d | 1 | 0.33mi |
| 16419 Spruce Way Lynnwood, WA | 2.0 | 2.0 | 946 | $2,500 | $2.64 | 0d | 1 | 0.33mi |
| 16104 36th Ave W Lynnwood, WA | 1.0–2.0 | 1.0 | 761 | $2,099 | $2.76 | 0d | 5 | 0.33mi |
| 16419 Spruce Way Unit H4 Lynnwood, WA | 2.0 | 2.0 | 900 | $2,350 | $2.61 | 44d | 1 | 0.34mi |
| 4109 156th St SW Unit A3 Lynnwood, WA | 2.0 | 1.0 | 988 | $1,895 | $1.92 | 25d | 1 | 0.35mi |
| 4109 156th St SW Unit B4 Lynnwood, WA | 2.0 | 1.0 | 985 | $1,995 | $2.03 | 44d | 1 | 0.35mi |
| 3333 164th St SW Lynnwood, WA | 1.0–2.0 | 1.0–2.0 | 1048 | $2,522 | $2.41 | 0d | 20 | 0.39mi |
| 4525 164th St SW Lynnwood, WA | 2.0–3.0 | 1.0–2.0 | 1093 | $2,042 | $1.87 | 0d | 9 | 0.41mi |
| 15713 35th Ave W Lynnwood, WA | 2.0 | 1.0 | 940 | $2,000 | $2.13 | 25d | 1 | 0.47mi |
| 16200 Admiralty Way Lynnwood, WA | 2.0 | 1.0–2.0 | 783 | $3,019 | $3.86 | 0d | 34 | 0.57mi |
| 16003 Admiralty Way Lynnwood, WA | 1.0–3.0 | 1.0–2.0 | 1052 | $1,910 | $1.81 | 0d | 4 | 0.63mi |
| 16604 48th Ave W Lynnwood, WA | 1.0–3.0 | 1.0–2.0 | 890 | $2,162 | $2.43 | 3d | 9 | 0.63mi |
| 3116 164th St SW #2211 Lynnwood, WA | 2.0 | 1.5 | 1100 | $2,425 | $2.20 | 0d | 1 | 0.68mi |
| 16308 52nd Ave W Unit 4 Edmonds, WA | 2.0 | 1.0 | 900 | $1,795 | $1.99 | 11d | 1 | 0.72mi |
| 15001 35th Ave W Lynnwood, WA | 1.0–3.0 | 1.0–2.0 | 885 | $2,040 | $2.31 | 0d | 15 | 0.79mi |
| 17314 44th Ave W Unit C Lynnwood, WA | 2.0 | 1.5 | 1000 | $2,200 | $2.20 | 18d | 1 | 0.81mi |
| 3717 148th St SW Lynnwood, WA | 2.0 | 1.0–2.0 | 865 | $1,912 | $2.21 | 3d | 6 | 0.88mi |
| 4902 148th St SW Edmonds, WA | 1.0–2.0 | 1.0–2.0 | 801 | $2,221 | $2.77 | 0d | 10 | 0.90mi |
| 17529 44th Ave W Lynnwood, WA | 2.0 | 1.0 | 1000 | $2,395 | $2.40 | 4d | 1 | 0.96mi |
| 4410 176th St SW Lynnwood, WA | 1.0–2.0 | 1.0 | 770 | $1,850 | $2.40 | 5d | 3 | 1.00mi |
| 4432 176th St SW Unit 3 Lynnwood, WA | 2.0 | 2.0 | 1004 | $2,195 | $2.19 | 44d | 1 | 1.07mi |
| 4432 176th St SW Unit 2 Lynnwood, WA | 2.0 | 2.0 | 1004 | $2,195 | $2.19 | 24d | 1 | 1.07mi |
| 4428 176th St SW Unit 4 Lynnwood, WA | 2.0 | 2.0 | 1004 | $2,195 | $2.19 | 24d | 1 | 1.07mi |
| 4702 176th St SW Lynnwood, WA | 1.0–2.0 | 1.0 | 886 | $1,950 | $2.20 | 0d | 7 | 1.08mi |
| 4816 176th St SW Lynnwood, WA | 1.0–2.0 | 1.0–1.5 | 802 | $1,970 | $2.45 | 0d | 6 | 1.09mi |
| 4502 176th St SW Unit 2 Lynnwood, WA | 2.0 | 2.0 | 1004 | $2,195 | $2.19 | 44d | 1 | 1.11mi |
| 5419 172nd Pl SW Lynnwood, WA | 3.0 | 2.0 | 980 | $2,895 | $2.95 | 25d | 1 | 1.11mi |
| 17422 52nd Ave W Lynnwood, WA | 2.0 | 1.5 | 850 | $1,960 | $2.31 | 25d | 1 | 1.12mi |
| 17828 44th Ave W Unit 2 Lynnwood, WA | 2.0 | 2.0 | 750 | $2,100 | $2.80 | 44d | 1 | 1.14mi |
| 14611 Admiralty Way Lynnwood, WA | 1.0–3.0 | 1.0–2.0 | 1004 | $2,299 | $2.29 | 2d | 11 | 1.18mi |
| 16116 Ash Way Lynnwood, WA | 1.0–3.0 | 1.0–2.0 | 1000 | $2,367 | $2.37 | 0d | 9 | 1.34mi |
| 18031 36th Ave W Lynnwood, WA | 1.0–2.0 | 1.0–2.0 | 760 | $2,186 | $2.88 | 0d | 6 | 1.34mi |
| 16605 Ash Way Lynnwood, WA | 2.0 | 1.0–2.0 | 802 | $3,125 | $3.89 | 0d | 73 | 1.35mi |
| 18124 36th Ave W Lynnwood, WA | 1.0–2.0 | 1.0–2.0 | 821 | $2,159 | $2.63 | 0d | 9 | 1.36mi |
| 14131 Admiralty Way Unit B Lynnwood, WA | 2.0 | 1.5 | 1000 | $2,245 | $2.25 | 25d | 1 | 1.43mi |
Listing history 17 events
-
2026-06-18days on market $54,950 Active 111 DOM
-
2026-06-17days on market $54,950 Active 110 DOM
-
2026-06-16days on market $54,950 Active 109 DOM
-
2026-06-15days on market $54,950 Active 108 DOM
-
2026-06-13days on market $54,950 Active 106 DOM
-
2026-06-13days on market $54,950 Active 105 DOM
-
2026-06-09days on market $54,950 Active 102 DOM
-
2026-06-08days on market $54,950 Active 101 DOM
-
2026-06-07days on market $54,950 Active 100 DOM
-
2026-06-04days on market $54,950 Active 97 DOM
-
2026-06-03days on market $54,950 Active 96 DOM
-
2026-06-02days on market $54,950 Active 95 DOM
-
2026-06-01days on market $54,950 Active 94 DOM
-
2026-05-31days on market $54,950 Active 93 DOM
-
2026-05-18price $54,950
-
2026-04-01price $69,500
-
2026-02-27$79,990 Active
ⓘ Source: listings_history table (triggers on properties + properties_extension) + one-shot
backfill from property_details.listing_events for pre-trigger history.
Tax reassessment forecast WA · Resets to sale price
- Current annual tax
- $350 · $29/mo
- Projected year-2 tax
- $539 · $45/mo
- Expected delta
- +$189/yr (+$16/mo · 54.1%)
ⓘ Screening estimate from a state-policy table — verify with the county assessor before closing.
Nearby sold comps map
Loading sold comps map…
Walkable amenities ~0.75 mi
Loading nearby amenities…
Taxation est. · year 1
- Rental income
- $26,978
- − Mortgage interest
- −$3,078
- − Property taxes
- −$350
- − Insurance
- −$275
- − Repairs & maintenance
- −$2,158
- − Management
- −$2,158
- − Depreciation
- −$1,599
- Taxable income
- $17,360
- Est. tax owed @ 24.0%
- −$4,166
- After-tax cash flow
- $13,064/yr
For passive investors: Depreciation is non-cash, so a rental often shows a tax loss while cash-flowing — sheltering income. Rental losses are passive: they offset passive income freely, and up to $25,000/yr can offset ordinary (W-2) income if you actively participate and your MAGI is under $100k (phasing out to $0 by $150k); unused losses carry forward. On sale, claimed depreciation is recaptured at up to 25%, and gains may owe capital-gains tax (a 1031 exchange can defer both). Figures are a year-1 estimate at your 24.0% rate — not tax advice; consult a CPA.
Schools (NCES district)
- District
- Edmonds School District
- NCES district ID
- 5302400
- Math proficiency
- 54% ▼ -1.00%
- Reading proficiency
- 65% ▬ 0.00%
- Median HH income
- $67,451
- Composite
- 53.94/100
- National rank
- #3026
- State rank
- #53 of 291 in WA
Livability — North Lynnwood
- Score
- 90/100
- State rank
- #6
- US rank
- #107
Category grades
Schools grade is shown separately in the Schools card above.
Census & demographics
- Census place
- North Lynnwood, WA
- County
- Snohomish County · 786,756 people
- City population
- 40,607
- Metro
- Seattle-Tacoma-Bellevue, WA
- Population (ZIP)
- 41,796
- Household income
- $106,693
- Rent vs Own
- Severe rent burden
- 2303.0
Population outlook (Snohomish County) Hauer SSP2
- Today (2025)
- 899,800 people
- By 2030
- 960,975 · +6.8%
- By 2040
- 1,074,447 · +19.4%
- By 2050
- 1,171,954 · +30.2%
- By 2075
- 1,384,849 · +53.9%
- By 2100
- 1,497,296 · +66.4%
Race, ethnicity, and origin ACS 2023
- Neighborhood character
- Highly diverse neighborhood (Simpson 0.71)
- Race & ethnicity
- White 48% Asian 20% Two or more races 13% Hispanic / Latino 12% Black 8% Pacific Islander 2%
- Hispanic origin (detail)
- Mexican 8%
- Common ancestry
- Portuguese 3% Slovak 3% Italian 3%
- Foreign-born
- 29% · Canada, South Korea, Vietnam
- Languages at home
- 64% English-only · Spanish 6% Russian/Polish/Slavic 5% Other Indo-European 5%
Political lean MEDSL · Snohomish
- 2024 margin
- D (+19.0) · D 57.8% · R 38.9% · Other 3.3%
- 2008→2024 swing
- +0.1pp no change · 2008: 18.9pp · 2024: 19.0pp
- All cycles
- 2024: D+19.0 2020: D+20.6 2016: D+16.6 2012: D+16.2 2008: D+18.9
Not yet ingested
- Civics
- —
Market trends
- HPI YoY
- ▼ -723.54%
- Current HPI
- 320.6888
- Rent YoY
- ▲ 1.22%
- Metro
- Seattle-Tacoma-Bellevue, WA
- State GDP YoY
- ▲ 4.65%
- F500 in state
- 22
Industry mix (Fortune 500 HQ in WA)
| Industry | F500 HQs | Revenue |
|---|---|---|
| Retail | 2 | $269B |
|
||
| Technology / Retail | 1 | $638B |
|
||
| Technology | 1 | $245B |
|
||
| Telecommunications | 1 | $38B |
|
||
| Food / Beverage | 1 | $36B |
|
||
| Automotive / Trucks | 1 | $34B |
|
||
Price history
-31.3% since first listed3 events — show timeline
- 2026-05-18 Price Changed $54,950 NWMLS as Distributed by MLS Grid
- 2026-04-01 Price Changed $69,500 NWMLS as Distributed by MLS Grid
- 2026-02-27 Listed $79,990 NWMLS as Distributed by MLS Grid
Property tax history
+9.0%/yrLatest (2026): $350 · +13.6% YoY. Source: county tax records.
Cash-flow waterfall
monthlySold comps — $/sqft
last 12 mo · ≤1 miLoading sold comps…