 🏷️ Likely Rental
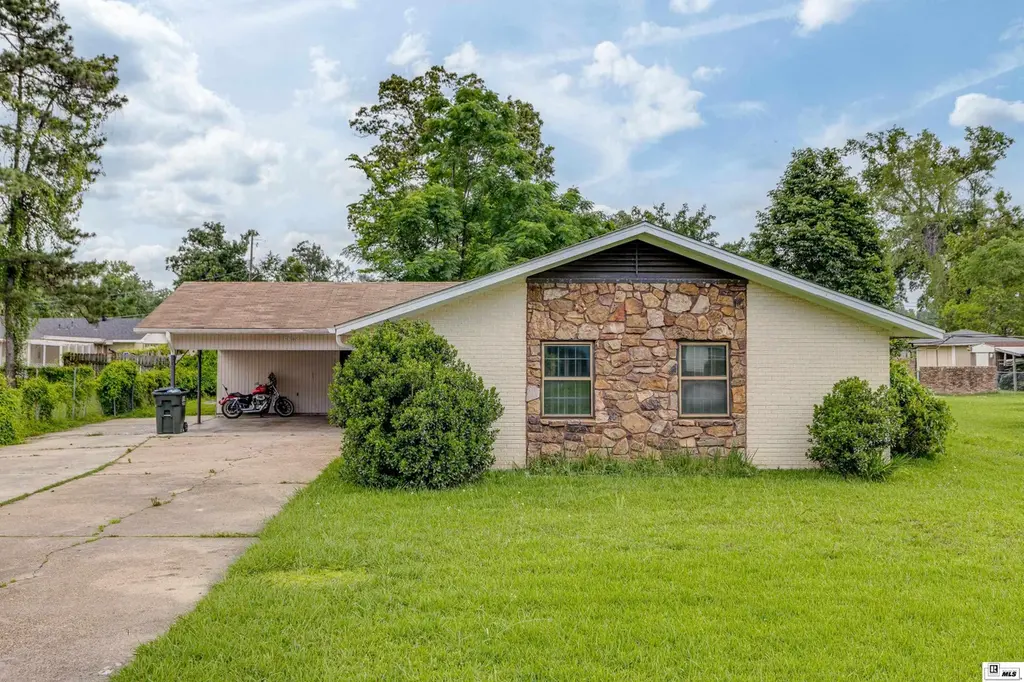
2205 Fannie St · Monroe, LA
Flood risk 6/10 · Moderate
- FEMA flood zone
- X (shaded)
- Chance of flooding over 30 yrs
- 0.74%
- Est. flood insurance / yr
- $507 – $1,088
Fire risk 1/10 · Minimal
- Est. fire insurance / yr
- $1,269 – $2,357
Heat risk 8/10 · Major
- Hot days now (above 111°F)
- 7 days/yr
- Hot days in 30 yrs
- 20 days/yr
Wind risk 6/10 · Moderate
- Chance of severe wind over 30 yrs
- 74.0%
Air-quality risk 1/10 · Minimal
- Unhealthy air days now
- 0 days/yr
- Unhealthy air days in 30 yrs
- 0 days/yr
Risk factors via First Street. Map © Google.
Why this score? — see what drove the B- grade
The composite is a weighted blend of 9 inputs, each scored 0–100. Each bar is that input's sub-score; the figure is the points it added to the 100-point composite (weight × sub-score).
- Cash flow +26.0/30.0
- ARV discount +15.0/15.0
- DSCR +8.7/10.0
- 1% rule +6.3/10.0
- Livability +3.3/5.0
- Rent growth +2.5/5.0
- Condition / age +2.5/5.0
- Schools +2.1/10.0
- Appreciation +0.0/10.0
$175,000
🖨 Deal sheet (PDF) 📄 Offer letter ✓ Due diligence
Listing remarks
Welcome to 2205 Fannie St in the heart of Monroe ~ a 3~Bedroom, 1.5 Bathroom located in the Sally Humble school zone. Currently occupied by a tenant. The current Rent is $1,320. The property received a new stove top and new flooring in part of the house in late 2025. The kitchen features plenty of cabinets and countertop space with dining area and adjoining laundry room. The laundry room features plenty of space for extra storage. The inviting living room offers a cozy atmosphere with built~in bookshelves. The living room leads directly into an extra room which can be used for office space or as a gaming room. The primary bedroom provides plenty of space with an adjoining jack and jill ba
Key facts
- Dining area
- Built-in bookshelves
- 0.24 acre lot
Tags
Property features AI
Exterior
- Parking: 2 covered parking spaces
- Security: Smoke detector(s)
- Utilities: Public water; Public sewer; Natural gas available and connected
- Home design: Residential income property (single-family residence)
- Construction: Vinyl siding and brick veneer exterior; Asphalt roof; Slab foundation; Built as single-family residence
- Exterior features: Rain gutters
Interior
- Kitchen: Dishwasher; Refrigerator; Gas range; Range hood; Gas cooktop
- Heating & cooling: Natural gas heating; Central air conditioning; Electric cooling; Ceiling fans
- Interior features: Ceiling fans throughout; Smoke detectors
- Laundry & utility: In-unit laundry; Gas water heater
Neighborhood map
What this means for you Summary
Snapshot
- This is a 3-bed/2.0-bath single-family listed at $175k.
Deal economics
- At list price, monthly cash flow is $435 ($5k/yr) — positive.
- The deal already cash-flows at list — no discount required.
- Meets the 1% rule at list price ($2k rent vs $175k).
- Recommended offer: $172k (1.5% below list) — sets the bar for market timing.
- Cap rate 9.3% vs local median 5.7% in Monroe — top-decile yield for the area; either an underpriced asset or a hidden risk that comps aren't pricing in. Stress-test before assuming the spread holds.
Location & tenants
- Location reads 66/100 on livability (#128 in LA) — a middle-class / working-renter tenant base. Strengths: cost of living A+, health & safety A+; Watch: crime F, amenities F, commute F.
- City Of Monroe School District (urban): math 21% / reading 31% proficiency, ranked #60 of 98 in LA (top 61%) — low school quality limits family demand, transient renter base, plan for 1-2y turnover; 82% free/reduced lunch — lower-income household profile, screen leases tightly.
- Zoned schools: Lexington Elementary School (604 students, 48% FRL); Neville Junior High School (math 29% / reading 53%, grade F, #61 of 218 statewide, top 28%, 480 students, 58% FRL); Neville High School (math 35% / reading 52%, grade F, #64 of 265 statewide, top 24%, 1,121 students, 49% FRL) — zoned schools average 52% FRL vs 82% district-wide (30 pts lower); this property's tenant base skews higher-income than the district average.
- Zoned-school proficiency averages 42% at this address vs 26% district-wide (+16 pts) — the actual schools serving this property are materially stronger than the City Of Monroe School District average implies; a family-tenant draw the district grade alone would hide.
- Market conditions: 142 active listings in the ZIP; 2 comparable units currently listed for rent nearby; 345 units permitted in Ouachita Parish in 2024 (0 in 5+ unit buildings).
- This rent runs 36% of the median local income ($65k/yr) — at the standard rent-burdened threshold; future hikes will face affordability resistance.
Forward outlook
- Local home prices are declining (-3.0%/yr); year-one equity from $1k of loan paydown is wiped out by about $5k of value loss. Plan a longer hold.
Negotiation context
- It's been on market 24 days — a 2% lower offer ($172k) is reasonable based on typical stale-listing flexibility.
- 2 sale attempts with the ask held roughly flat each time — persistent listings suggest the price (not the market) is what's stuck; bring a comps-based counter.
- Current owner paid $88k; list at $175k implies a 99% gain — meaningful room to come down on a strong offer.
Risks & watch-outs
- Watch-outs: built in 1959 — expect roof / HVAC / electrical / plumbing capex.
- Climate carrying-cost: major flood risk; major wind risk, 74% chance of damaging wind over 30y; extreme-heat days projected 7→20/yr by 2055 (HVAC capex compounding) — expect insurance premiums to compound above CPI over the hold.
Questions for the listing agent
- Built in 1959 — when were the roof, HVAC, electrical panel, plumbing, and water heater last replaced?
- Is there a deadline driving the sale (1031 exchange, divorce, estate, relocation)? That informs how much negotiation room exists.
- Crime grade is F in this area — have there been break-ins, vandalism, or insurance claims at this property in the last 3 years? What carrier currently insures it and at what premium?
- What's the average days-on-market for RENTAL listings here right now (not sales)? A rising rental-DOM trend means longer vacancies and softer asking-rent achievability than the comps imply.
- What's the recent tenant-quality profile in this submarket — average credit score on applications, eviction rate, late-payment / NSF rate, and stable-employment percentage? A property-management company in the area should have these aggregated.
- How much new for-sale + rental construction is in the pipeline within 1–3 miles? Heavy new supply typically softens prices + rents 12–24 months out; constrained supply supports both.
Investment metrics
- 1% rule
- 1.13% ✓
- Cap rate
- 9.28%
- Cash-on-cash
- 10.66%
- DSCR
- 1.47
- GRM
- 7.4
CMA / ARV
- ARV (on-the-fly)
- $232,560
- Comps found
- 12
Show comp detail 12 sales within ~0.75 mi
| Address | Dist | Beds/Ba | Sqft | Sold | Price | $/sf | Match |
|---|---|---|---|---|---|---|---|
| 2202 Jan St | 0.10mi | 3/2.0 | 1,622 (-5%) | 24mo | $170,000 | $105 | 67 |
| 1907 John Cir | 0.47mi | 3/2.0 | 1,668 (-2%) | 13mo | $285,000 | $171 | 64 |
| 1916 Spencer Ave | 0.73mi | 3/2.0 | 1,718 (+0%) | 11mo | $165,000 | $96 | 56 |
| 2520 Felicity Dr | 0.56mi | 3/2.0 | 1,863 (+9%) | 9mo | $356,000 | $191 | 52 |
| 1901 Richard Dr | 0.55mi | 3/2.0 | 1,468 (-14%) | 2mo | $200,000 | $136 | 49 |
| 1805 Townhouse Dr Unit A | 0.29mi | 2/2.0 (-1) | 1,468 (-14%) | 12mo | $163,000 | $111 | 48 |
| 1904 John Cir | 0.46mi | 3/2.0 | 1,521 (-11%) | 16mo | $164,900 | $108 | 46 |
| 2001 Brierfield Dr | 0.58mi | 3/2.5 | 1,798 (+5%) | 20mo | $330,000 | $184 | 46 |
| 1901 Sherwood Ave | 0.63mi | 3/2.0 | 1,883 (+10%) | 11mo | $164,000 | $87 | 44 |
| 2004 Oakmont St | 0.60mi | 2/2.0 (-1) | 1,484 (-13%) | 9mo | $207,000 | $139 | 38 |
| 1603 Auburn Ave | 0.72mi | 3/2.0 | 1,529 (-11%) | 16mo | $176,000 | $115 | 35 |
| 2422 Destrehan Dr | 0.65mi | 2/2.0 (-1) | 1,582 (-8%) | 21mo | $320,000 | $202 | 34 |
Match score weights: distance 35% · size 25% · config 20% · recency 20%. Top-matched comps best support the ARV.
Projected returns pro-forma
-3.0% appreciation · 3.0% rent growth · sell at horizon
- IRR
- -0.4%
- Equity multiple
- 0.99×
- Total profit
- $-655
- Equity at exit
- $26,093
- IRR
- 9.3%
- Equity multiple
- 1.72×
- Total profit
- $35,036
- Equity at exit
- $15,131
Cash invested: $49,000 (down + closing). Projections, not guarantees.
Landlord ↔ Tenant lean methodology
- Overall (STATE)
- 90 Strongly Landlord-Friendly
- State Louisiana
- 90 Strongly Landlord-Friendly · R+12
- County
- — inherits STATE
- City
- — inherits STATE
ZIP-level market 71201
- Home prices YoY
- -31.9%
- Active inventory
- 142
- Price-to-rent
- 7.4×
Monthly cashflow live
- Estimated rent
- $1,972 medium interval (Pro) →
- Mortgage (P&I)
- −$918
- Tax from tax record
- −$132 /mo · $1,583/yr
- Insurance
- −$73
- HOA
- −$0
- Vacancy / Maint / Mgmt
- −$414
- Net cashflow
- $435
Break-even live
Sensitivity live
| Price | -10% $534 | -5% $485 | +0% $435 | +5% $386 | +10% $336 |
|---|---|---|---|---|---|
| Rent | -10% $280 | -5% $357 | +0% $435 | +5% $513 | +10% $591 |
| Rate | -1.0pp $523 | -0.5pp $480 | base $435 | +0.5pp $390 | +1.0pp $344 |
UW: 25.0% down · 7.5% · 30yr · 1.5% tax · 5.0% vac · 8.0% maint · 8.0% mgmt
Financing live
Cash to close
- Down payment
- $43,750
- Closing costs
- $5,250
- Reserves months
- —
- Total cash needed
- —
Loan-product check · same deal, 3 products live
Conventional
25% down · 7.5% · 30yr
- Down + closing
- —
- Monthly P&I
- —
- Monthly cashflow
- —
- DSCR
- —
- Eligible?
- —
Personal DTI + credit; lowest rate.
DSCR
20% down · 8.5% · 30yr
- Down + closing
- —
- Monthly P&I
- —
- Monthly cashflow
- —
- DSCR
- —
- Eligible?
- —
No personal income docs; deal must DSCR.
Hard money
10% down · 12.0% · 12mo
- Down + closing
- —
- Monthly P&I
- —
- Monthly cashflow
- —
- DSCR
- —
- Eligible?
- —
Short-term bridge; refi at stabilization.
Rent comps 2 comps
| Address | Beds | Baths | Sqft | Rent | $/sqft | DOM | Units | Dist |
|---|---|---|---|---|---|---|---|---|
| 1707 N 5th St Monroe, LA | 3.0 | 2.0 | 1694 | $3,500 | $2.07 | 22d | 1 | 1.45mi |
| 403 K St Monroe, LA | 3.0 | 2.0 | 1561 | $1,100 | $0.70 | 22d | 1 | 1.48mi |
Listing history 21 events
-
2026-06-21days on market $175,000 Active 24 DOM
-
2026-06-19days on market $175,000 Active 22 DOM
-
2026-06-18days on market $175,000 Active 21 DOM
-
2026-06-17days on market $175,000 Active 20 DOM
-
2026-06-16days on market $175,000 Active 19 DOM
-
2026-06-15days on market $175,000 Active 18 DOM
-
2026-06-14days on market $175,000 Active 16 DOM
-
2026-06-13days on market $175,000 Active 15 DOM
-
2026-06-10days on market $175,000 Active 13 DOM
-
2026-06-09days on market $175,000 Active 12 DOM
-
2026-06-08days on market $175,000 Active 11 DOM
-
2026-06-07days on market $175,000 Active 10 DOM
-
2026-06-05days on market $175,000 Active 7 DOM
-
2026-06-02days on market $175,000 Active 5 DOM
-
2026-06-01days on market $175,000 Active 4 DOM
-
2026-05-31days on market $175,000 Active 3 DOM
-
2026-05-30days on market $175,000 Active 2 DOM
-
2026-05-28$175,000 Active
-
2025-12-21historical $1,295
-
2025-11-29$1,295
-
2016-10-28soldstatus $88,000
ⓘ Source: listings_history table (triggers on properties + properties_extension) + one-shot
backfill from property_details.listing_events for pre-trigger history.
Tax reassessment forecast LA · Resets to sale price
- Current annual tax
- $1,583 · $132/mo
- Projected year-2 tax
- $1,583 · $132/mo
- Expected delta
- $0/yr ($0/mo · 0.0%)
ⓘ Screening estimate from a state-policy table — verify with the county assessor before closing.
Climate risk First Street
- Flood 6/10 Major FEMA zone X (shaded) · 74% chance over 30 yrs
- Wildfire 1/10 Low
- Heat 8/10 Severe 7 d/yr ≥111°F today · 20 d/yr by 30 yrs out
- Wind 6/10 Major 74% chance of damaging wind over 30 yrs
- Air quality 1/10 Low 0 unhealthy d/yr today · 0 by 30 yrs out
Nearby sold comps map
Loading sold comps map…
Walkable amenities ~0.75 mi
Loading nearby amenities…
Taxation est. · year 1
- Rental income
- $23,664
- − Mortgage interest
- −$9,803
- − Property taxes
- −$1,583
- − Insurance
- −$875
- − Repairs & maintenance
- −$1,893
- − Management
- −$1,893
- − Depreciation
- −$5,091
- Taxable income
- $2,526
- Est. tax owed @ 24.0%
- −$606
- After-tax cash flow
- $4,618/yr
For passive investors: Depreciation is non-cash, so a rental often shows a tax loss while cash-flowing — sheltering income. Rental losses are passive: they offset passive income freely, and up to $25,000/yr can offset ordinary (W-2) income if you actively participate and your MAGI is under $100k (phasing out to $0 by $150k); unused losses carry forward. On sale, claimed depreciation is recaptured at up to 25%, and gains may owe capital-gains tax (a 1031 exchange can defer both). Figures are a year-1 estimate at your 24.0% rate — not tax advice; consult a CPA.
Schools (NCES district)
- District
- City Of Monroe School District
- NCES district ID
- 2201080
- Math proficiency
- 21% ▼ -36.00%
- Reading proficiency
- 31% ▼ -34.00%
- Median HH income
- $28,751
- Composite
- 20.82/100
- National rank
- #8505
- State rank
- #60 of 98 in LA
Livability — Monroe
- Score
- 66/100
- State rank
- #128
- US rank
- #11948
Category grades
Schools grade is shown separately in the Schools card above.
Census & demographics
- Census place
- Monroe, LA
- County
- Ouachita Parish · 118,340 people
- City population
- 60,136
- Metro
- Monroe, LA
- Population (ZIP)
- 21,782
- Household income
- $65,446
- Rent vs Own
- Severe rent burden
- 1466.0
Population outlook (Ouachita County) Hauer SSP2
- Today (2025)
- 163,370 people
- By 2030
- 165,520 · +1.3%
- By 2040
- 167,652 · +2.6%
- By 2050
- 166,699 · +2.0%
- By 2075
- 156,348 · -4.3%
- By 2100
- 134,102 · -17.9%
Race, ethnicity, and origin ACS 2023
- Neighborhood character
- Diverse neighborhood (Simpson 0.55)
- Race & ethnicity
- White 57% Black 35% Two or more races 3% Hispanic / Latino 3% Asian 2%
- Common ancestry
- Lithuanian 3% Slovak 2% Italian 1%
- Foreign-born
- 3% · Vietnam
- Languages at home
- 95% English-only · Spanish 3% Other Indo-European 1% Arabic 1%
Political lean MEDSL · Ouachita
- 2024 margin
- Strong R (+27.9) · D 35.5% · R 63.3% · Other 1.2%
- 2008→2024 swing
- -2.7pp toward R · 2008: -25.2pp · 2024: -27.9pp
- All cycles
- 2024: R+27.9 2020: R+23.6 2016: R+25.4 2012: R+20.9 2008: R+25.2
Not yet ingested
- Civics
- —
Market trends
- HPI YoY
- ▼ -92.35%
- Current HPI
- 196.7468
- Rent YoY
- —
- Metro
- Monroe, LA
- State GDP YoY
- ▲ 3.29%
- F500 in state
- 10
Industry mix (Fortune 500 HQ in LA)
| Industry | F500 HQs | Revenue |
|---|---|---|
| Telecommunications | 2 | $23B |
|
||
| Utilities | 1 | $12B |
|
||
| Wholesale / Distribution | 1 | $5B |
|
||
| Advertising | 1 | $2B |
|
||
Price history
+98.9% since first listed4 events — show timeline
- 2026-05-28 Listed $175,000 NELABOR
- 2025-12-21 Rental Removed $1,295 BUILDIUM
- 2025-11-29 Listed for Rent $1,295 BUILDIUM
- 2016-10-28 Sold (Public Records) $88,000 Public Records
Property tax history
+5.5%/yrLatest (2025): $1,583 · -0.1% YoY. Source: county tax records.
Cash-flow waterfall
monthlySold comps — $/sqft
last 12 mo · ≤1 miLoading sold comps…