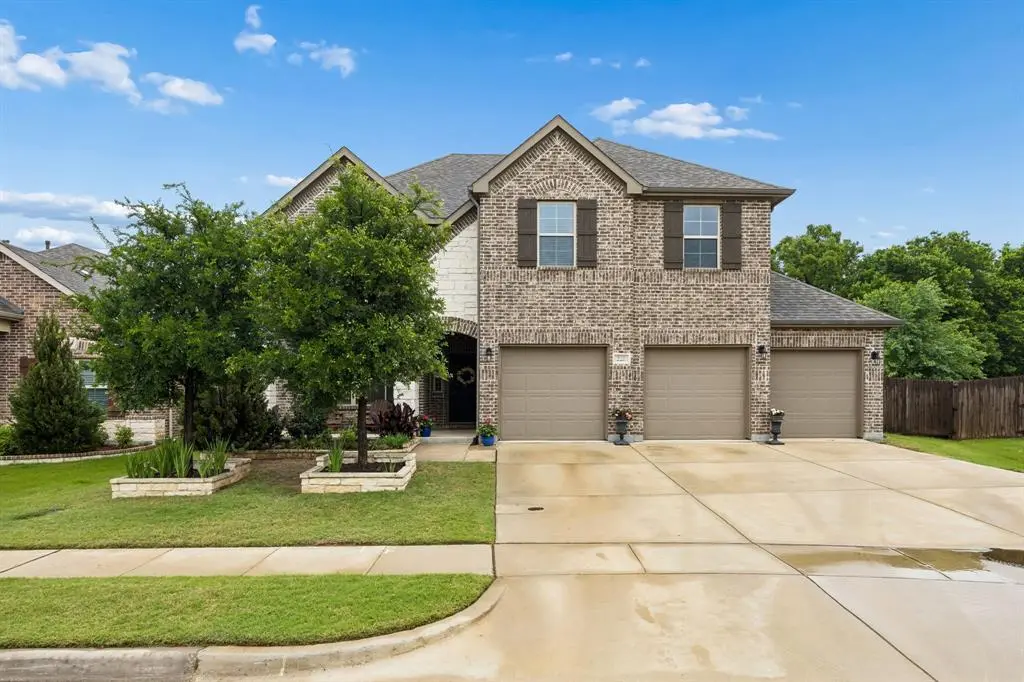
220 Virginia Ln · Hickory Creek, TX
Flood risk 1/10 · Minimal
- FEMA flood zone
- X (unshaded)
- Chance of flooding over 30 yrs
- 0.0%
- Est. flood insurance / yr
- $507 – $1,088
Fire risk 3/10 · Minor
- Est. fire insurance / yr
- $1,222 – $2,270
Heat risk 7/10 · Major
- Hot days now (above 109°F)
- 7 days/yr
- Hot days in 30 yrs
- 23 days/yr
Wind risk 5/10 · Moderate
- Chance of severe wind over 30 yrs
- 26.0%
Air-quality risk 4/10 · Minor
- Unhealthy air days now
- 4 days/yr
- Unhealthy air days in 30 yrs
- 5 days/yr
Risk factors via First Street. Map © Google.
Why this score? — see what drove the C+ grade
The composite is a weighted blend of 9 inputs, each scored 0–100. Each bar is that input's sub-score; the figure is the points it added to the 100-point composite (weight × sub-score).
- Cash flow +30.0/30.0
- 1% rule +10.0/10.0
- DSCR +10.0/10.0
- Condition / age +4.0/5.0
- Livability +3.6/5.0
- Schools +3.4/10.0
- Rent growth +2.5/5.0
- ARV discount +0.0/15.0
- Appreciation +0.0/10.0
$625,000
🖨 Deal sheet (PDF) 📄 Offer letter ✓ Due diligence
Listing remarks
A little slice of heaven in Hickory Creek, this 4-bedroom, 3.5-bath home built in 2020 sits on one of the largest lots in the neighborhood and has a 3-car garage! Newer than most surrounding homes and currently the only 2020 build available, it offers a level of comfort, efficiency, and long-term confidence that stands out immediately. Rich wood flooring carries you through the main living areas. Just off the entry, a dedicated office with French doors creates a focused space for work or creative pursuits. The kitchen’s sweeping wraparound island anchors the space, offering room to gather, prep, and serve. Quartz counters reflect the natural light, while the upgraded appliance package
Key facts
- Wraparound island
- Quartz countertops
- Stone fireplace
Tags
Property features AI
Finance
- Other: Community playground
- Financial info: Association fee paid annually
- HOA & community: Mandatory association; Annual association fee; HOA fee covers full use of facilities, maintenance structure, and management fees; HOA management: Neighborhood Management
Exterior
- Parking: Attached garage with 3 garage spaces; Garage faces front with 2-car single door and oversized bay; Garage door opener; Covered parking for 3 vehicles; Driveway with concrete surface; Additional parking
- Utilities: City water; City sewer; Electricity connected; Individual gas meter; Individual water meter; Natural gas available; Cable available; Concrete curbs
- Home design: Single family residence; Two-story; Entry and primary living areas on main level
- Construction: Built in 2020; Brick construction; Composition shingle roof; Slab foundation; Smart home features present
- Exterior features: Covered porch(es); Covered patio; Gardens; Gutters; Private yard; Back yard fencing (wood); Fenced yard; Sprinkler system; Large backyard grass; Poultry coop; Landscaped; Few trees; Located on a cul-de-sac; Subdivision lot
Interior
- Kitchen: Dishwasher; Disposal; Gas cooktop; Gas oven; Microwave; Double oven; Refrigerator; Plumbed for gas in kitchen; Kitchen island; Pantry; Granite counters
- Bedrooms: 4 bedrooms (primary suite on main level)
- Flooring: Carpet; Tile; Wood
- Bathrooms: 3 full bathrooms; 1 half bathroom
- Heating & cooling: Central heating (natural gas); Central air conditioning (electric); Ceiling fans
- Interior features: Built-in features; Cable TV available; Decorative lighting; Double vanity; Granite counters; High speed internet available; Kitchen island; Open floorplan; Pantry; Vaulted ceilings; Walk-in closets; Window coverings
- Laundry & utility: Utility room; Full-size washer/dryer area; Washer hookup; Washer hookup in utility room
Neighborhood map
What this means for you Summary
Snapshot
- This is a 4-bed/3.5-bath single-family listed at $625k. Condition is rated good.
Deal economics
- At list price, monthly cash flow is $6k ($69k/yr) — positive.
- The deal already cash-flows at list — no discount required.
- Meets the 1% rule at list price ($13k rent vs $625k).
- Recommended offer: $606k (3.0% below list) — sets the bar for market timing.
- Cap rate 17.3% vs local median 2.6% in Hickory Creek — top-decile yield for the area; either an underpriced asset or a hidden risk that comps aren't pricing in. Stress-test before assuming the spread holds.
Location & tenants
- Location reads 72/100 on livability (#238 in TX) — a middle-class / working-renter tenant base. Strengths: crime A+, employment A+, housing A+; Watch: cost of living D+, amenities F, commute F.
- Lake Dallas ISD (suburban): math 34% / reading 39% proficiency, ranked #413 of 826 in TX (top 50%) — families likely to look elsewhere, expect single-tenant / working-renter base with shorter leases.
- Zoned schools: Lake Dallas El (math 30% / reading 32%, grade F, #2,429 of 4,322 statewide, top 57%, 534 students, 63% FRL) — zoned schools average 63% FRL vs 36% district-wide (26 pts higher); higher-poverty schools than district average — tighter screening recommended.
- Market conditions: 128 active listings in the ZIP; 4 comparable units currently listed for rent nearby; rentals at typical pace (median 23d on market — plan ~3-4 weeks tenant-placement turnaround); 10,531 units permitted in Denton County in 2024 (2,713 in 5+ unit buildings).
Forward outlook
- Local home prices are declining (-3.0%/yr); year-one equity from $4k of loan paydown is wiped out by about $19k of value loss. Plan a longer hold.
- Denton County population projected at +66% by 2050 — long-run rental-demand tailwind backs the buy-and-hold thesis.
- At projected returns (-3.0% appreciation + 3.0% rent growth), your $175k cash investment doubles in ~3 years — after that, you're playing with house money.
Negotiation context
- It's been on market 58 days — a 3% lower offer ($606k) is reasonable based on typical stale-listing flexibility.
Risks & watch-outs
- Climate carrying-cost: moderate wind risk, 26% chance of damaging wind over 30y; extreme-heat days projected 7→23/yr by 2055 (HVAC capex compounding) — expect insurance premiums to compound above CPI over the hold.
Questions for the listing agent
- It's been on market 58 days. Have you received any prior offers? Is the seller open to a 3% concession, seller financing, or rate buy-down credit?
- What does the HOA fee cover, when was the last increase, and are there any pending special assessments or reserve-fund shortfalls?
- Is there a deadline driving the sale (1031 exchange, divorce, estate, relocation)? That informs how much negotiation room exists.
- Schools are A-rated — typically a magnet for longer-tenancy family renters. What's the average tenant stay here, and is there a school-zone premium baked into asking?
- What's the average days-on-market for RENTAL listings here right now (not sales)? A rising rental-DOM trend means longer vacancies and softer asking-rent achievability than the comps imply.
- What's the recent tenant-quality profile in this submarket — average credit score on applications, eviction rate, late-payment / NSF rate, and stable-employment percentage? A property-management company in the area should have these aggregated.
- How much new for-sale + rental construction is in the pipeline within 1–3 miles? Heavy new supply typically softens prices + rents 12–24 months out; constrained supply supports both.
Investment metrics
- 1% rule
- 2.06% ✓
- Cap rate
- 17.33%
- Cash-on-cash
- 39.41%
- DSCR
- 2.75
- GRM
- 4.0
CMA / ARV
- ARV (median comp)
- $515,418
- List price
- $625,000
- Delta
- 21.26%
- Verdict
- OVERPRICED
- Comps
- 20 within 1.0 mi
Show comp detail 12 sales within ~0.75 mi
| Address | Dist | Beds/Ba | Sqft | Sold | Price | $/sf | Match |
|---|---|---|---|---|---|---|---|
| 142 Whitney Dr | 0.16mi | 4/3.5 | 3,804 (+4%) | 13mo | $675,000 | $177 | 76 |
| 109 Belton Dr | 0.22mi | 4/3.5 | 3,584 (-2%) | 13mo | $560,000 | $156 | 75 |
| 100 Red Bluff Ct | 0.32mi | 4/3.0 | 3,383 (-8%) | 1mo | $724,900 | $214 | 69 |
| 103 Lakehill Ct | 0.20mi | 5/4.0 (+1) | 3,512 (-4%) | 12mo | $679,000 | $193 | 66 |
| 251 Barkley Dr | 0.62mi | 4/3.5 | 3,461 (-6%) | 1mo | $649,900 | $188 | 61 |
| 146 Shasta Dr | 0.34mi | 4/2.5 | 3,293 (-10%) | 3mo | $619,900 | $188 | 61 |
| 1106 Ellard Dr | 0.56mi | 4/3.0 | 3,392 (-8%) | 2mo | $1,100,000 | $324 | 58 |
| 201 Barkley Dr | 0.32mi | 4/3.0 | 3,243 (-12%) | 7mo | $579,900 | $179 | 58 |
| 115 Lakehill Ct | 0.28mi | 4/3.0 | 3,243 (-12%) | 12mo | $875,000 | $270 | 55 |
| 116 Deerpath Rd | 0.56mi | 5/3.5 (+1) | 3,459 (-6%) | 9mo | $525,000 | $152 | 52 |
| 219 Livingston Dr | 0.48mi | 4/2.5 | 3,169 (-14%) | 1mo | $545,000 | $172 | 50 |
| 242 Livingston Dr | 0.57mi | 4/3.0 | 3,203 (-13%) | 2mo | $585,000 | $183 | 49 |
Match score weights: distance 35% · size 25% · config 20% · recency 20%. Top-matched comps best support the ARV.
Projected returns pro-forma
-3.0% appreciation · 3.0% rent growth · sell at horizon
- IRR
- 35.7%
- Equity multiple
- 2.51×
- Total profit
- $265,008
- Equity at exit
- $93,190
- IRR
- 42.4%
- Equity multiple
- 5.02×
- Total profit
- $703,125
- Equity at exit
- $54,039
Cash invested: $175,000 (down + closing). Projections, not guarantees.
Landlord ↔ Tenant lean methodology
- Overall (STATE)
- 87 Strongly Landlord-Friendly
- State Texas
- 87 Strongly Landlord-Friendly · R+5
- County
- — inherits STATE
- City
- — inherits STATE
ZIP-level market 75065
- Home prices YoY
- -6.8%
- Active inventory
- 128
- Price-to-rent
- 4.0×
Monthly cashflow live
- Estimated rent
- $12,870 medium interval (Pro) →
- Mortgage (P&I)
- −$3,278
- Tax from tax record
- −$824 /mo · $9,888/yr
- Insurance
- −$260
- HOA
- −$58
- Vacancy / Maint / Mgmt
- −$2,703
- Net cashflow
- $5,747
Break-even live
Sensitivity live
| Price | -10% $6,101 | -5% $5,924 | +0% $5,747 | +5% $5,570 | +10% $5,393 |
|---|---|---|---|---|---|
| Rent | -10% $4,730 | -5% $5,239 | +0% $5,747 | +5% $6,255 | +10% $6,764 |
| Rate | -1.0pp $6,062 | -0.5pp $5,906 | base $5,747 | +0.5pp $5,585 | +1.0pp $5,420 |
UW: 25.0% down · 7.5% · 30yr · 1.5% tax · 5.0% vac · 8.0% maint · 8.0% mgmt
Financing live
Cash to close
- Down payment
- $156,250
- Closing costs
- $18,750
- Reserves months
- —
- Total cash needed
- —
Loan-product check · same deal, 3 products live
Conventional
25% down · 7.5% · 30yr
- Down + closing
- —
- Monthly P&I
- —
- Monthly cashflow
- —
- DSCR
- —
- Eligible?
- —
Personal DTI + credit; lowest rate.
DSCR
20% down · 8.5% · 30yr
- Down + closing
- —
- Monthly P&I
- —
- Monthly cashflow
- —
- DSCR
- —
- Eligible?
- —
No personal income docs; deal must DSCR.
Hard money
10% down · 12.0% · 12mo
- Down + closing
- —
- Monthly P&I
- —
- Monthly cashflow
- —
- DSCR
- —
- Eligible?
- —
Short-term bridge; refi at stabilization.
Rent comps 4 comps
| Address | Beds | Baths | Sqft | Rent | $/sqft | DOM | Units | Dist |
|---|---|---|---|---|---|---|---|---|
| 201 Barkley Dr Unit 1391266P Hickory Creek, TX | 4.0 | 3.0 | 3239 | $15,242 | $4.71 | 25d | 1 | 0.29mi |
| 201 Barkley Dr Lake Dallas, TX | 4.0 | 3.0 | 3243 | $10,500 | $3.24 | 23d | 1 | 0.29mi |
| 5429 Prince Dr Lake Dallas, TX | 5.0 | 2.5 | 2565 | $2,495 | $0.97 | 12d | 1 | 0.87mi |
| 123 Derby Ln Lake Dallas, TX | 4.0 | 3.0 | 2535 | $2,900 | $1.14 | 8d | 1 | 1.45mi |
HOA detail
- Monthly dues
- $58 · $696/yr
Listing history 15 events
-
2026-06-21days on market $625,000 Active 58 DOM
-
2026-06-18days on market $625,000 Active 55 DOM
-
2026-06-17days on market $625,000 Active 54 DOM
-
2026-06-16days on market $625,000 Active 53 DOM
-
2026-06-15days on market $625,000 Active 52 DOM
-
2026-06-13days on market $625,000 Active 50 DOM
-
2026-06-09days on market $625,000 Active 46 DOM
-
2026-06-08days on market $625,000 Active 45 DOM
-
2026-06-07pricedays on market $625,000 Active 44 DOM
-
2026-06-04days on market $650,000 Active 41 DOM
-
2026-06-03days on market $650,000 Active 40 DOM
-
2026-06-02days on market $650,000 Active 39 DOM
-
2026-06-01days on market $650,000 Active 38 DOM
-
2026-05-31days on market $650,000 Active 37 DOM
-
2026-04-24$650,000 Active 2008-char remark
ⓘ Source: listings_history table (triggers on properties + properties_extension) + one-shot
backfill from property_details.listing_events for pre-trigger history.
Tax reassessment forecast TX · Resets to sale price
- Current annual tax
- $9,888 · $824/mo
- Projected year-2 tax
- $11,438 · $953/mo
- Expected delta
- +$1,550/yr (+$129/mo · 15.7%)
ⓘ Screening estimate from a state-policy table — verify with the county assessor before closing.
Climate risk First Street
- Flood 1/10 Low FEMA zone X (unshaded) · 0% chance over 30 yrs
- Wildfire 3/10 Moderate
- Heat 7/10 Severe 7 d/yr ≥109°F today · 23 d/yr by 30 yrs out
- Wind 5/10 Major 26% chance of damaging wind over 30 yrs
- Air quality 4/10 Moderate 4 unhealthy d/yr today · 5 by 30 yrs out
Nearby sold comps map
Loading sold comps map…
Walkable amenities ~0.75 mi
Loading nearby amenities…
Taxation est. · year 1
- Rental income
- $154,434
- − Mortgage interest
- −$35,010
- − Property taxes
- −$9,888
- − Insurance
- −$3,125
- − Repairs & maintenance
- −$12,355
- − Management
- −$12,355
- − HOA
- −$696
- − Depreciation
- −$18,182
- Taxable income
- $62,825
- Est. tax owed @ 24.0%
- −$15,078
- After-tax cash flow
- $53,886/yr
For passive investors: Depreciation is non-cash, so a rental often shows a tax loss while cash-flowing — sheltering income. Rental losses are passive: they offset passive income freely, and up to $25,000/yr can offset ordinary (W-2) income if you actively participate and your MAGI is under $100k (phasing out to $0 by $150k); unused losses carry forward. On sale, claimed depreciation is recaptured at up to 25%, and gains may owe capital-gains tax (a 1031 exchange can defer both). Figures are a year-1 estimate at your 24.0% rate — not tax advice; consult a CPA.
Condition & rehab AI · 1 photo
This 2020-built home in Hickory Creek is in excellent condition with no visible repairs needed. It offers a great opportunity for a move-in-ready investment with potential for minor updates to enhance its resale and rental value.
Value-add opportunities
- Both Paint exterior and interior — Fresh paint enhances curb appeal and interior aesthetics
- Resale Replace countertops with quartz or similar material — Quartz countertops are durable and add value
- Both Install smart home devices — Enhances comfort and energy efficiency
Renovation cost estimate screening
Value-add ROI direction
- Both Paint exterior and interior — Fresh paint enhances curb appeal and interior aesthetics ↑
- Resale Replace countertops with quartz or similar material — Quartz countertops are durable and add value ↑
- Both Install smart home devices — Enhances comfort and energy efficiency ↑
ⓘ Cost ranges are severity-bucket heuristics (US national rule-of-thumb). Get contractor quotes + a written scope before underwriting a rehab budget.
Schools (NCES district)
- District
- Lake Dallas ISD
- NCES district ID
- 4826430
- Math proficiency
- 34% ▼ -20.00%
- Reading proficiency
- 39% ▼ -10.00%
- Median HH income
- $76,645
- Composite
- 34.13/100
- National rank
- #5287
- State rank
- #413 of 826 in TX
Livability — Hickory Creek
- Score
- 72/100
- State rank
- #238
- US rank
- #5782
Category grades
Schools grade is shown separately in the Schools card above.
Census & demographics
- Census place
- Hickory Creek, TX
- City population
- 13,046
- Population (ZIP)
- 13,046
Population outlook (Denton County) Hauer SSP2
- Today (2025)
- 1,053,010 people
- By 2030
- 1,192,269 · +13.2%
- By 2040
- 1,472,920 · +39.9%
- By 2050
- 1,746,506 · +65.9%
- By 2075
- 2,358,497 · +124.0%
- By 2100
- 2,779,183 · +163.9%
Race, ethnicity, and origin ACS 2023
- Neighborhood character
- Majority White (62%)
- Race & ethnicity
- White 62% Hispanic / Latino 27% Two or more races 13% Black 6% Asian 3%
- Hispanic origin (detail)
- Mexican 23%
- Common ancestry
- Italian 9% Slovak 2% Serbian 1%
- Foreign-born
- 20% · Canada, South Korea, United Kingdom
- Languages at home
- 73% English-only · Spanish 21% Korean 2% Other Asian/Pacific 1%
Political lean MEDSL · Denton
- 2024 margin
- R (+13.2) · D 42.7% · R 55.8% · Other 1.5%
- 2008→2024 swing
- +11.0pp toward D · 2008: -24.2pp · 2024: -13.2pp
- All cycles
- 2024: R+13.2 2020: R+8.1 2016: R+20.2 2012: R+31.7 2008: R+24.2
Not yet ingested
- Civics
- —
Market trends
- HPI YoY
- ▼ -21.91%
- Current HPI
- 300.0981
- Rent YoY
- —
- Metro
- —
- State GDP YoY
- ▲ 3.95%
- F500 in state
- 110
Industry mix (Fortune 500 HQ in TX)
| Industry | F500 HQs | Revenue |
|---|---|---|
| Energy | 16 | $1,198B |
|
||
| Technology | 5 | $198B |
|
||
| Engineering / Construction | 4 | $72B |
|
||
| Energy Services | 3 | $60B |
|
||
| Utilities | 3 | $41B |
|
||
| Healthcare | 2 | $330B |
|
||
Price history
-3.8% since first listed2 events — show timeline
- 2026-06-04 Price Changed $625,000 NTREIS
- 2026-04-24 Listed $650,000 NTREIS
Property tax history
+40.8%/yrLatest (2025): $9,888 · +9.1% YoY. Source: county tax records.
Cash-flow waterfall
monthlySold comps — $/sqft
last 12 mo · ≤1 miLoading sold comps…