 Multi-family
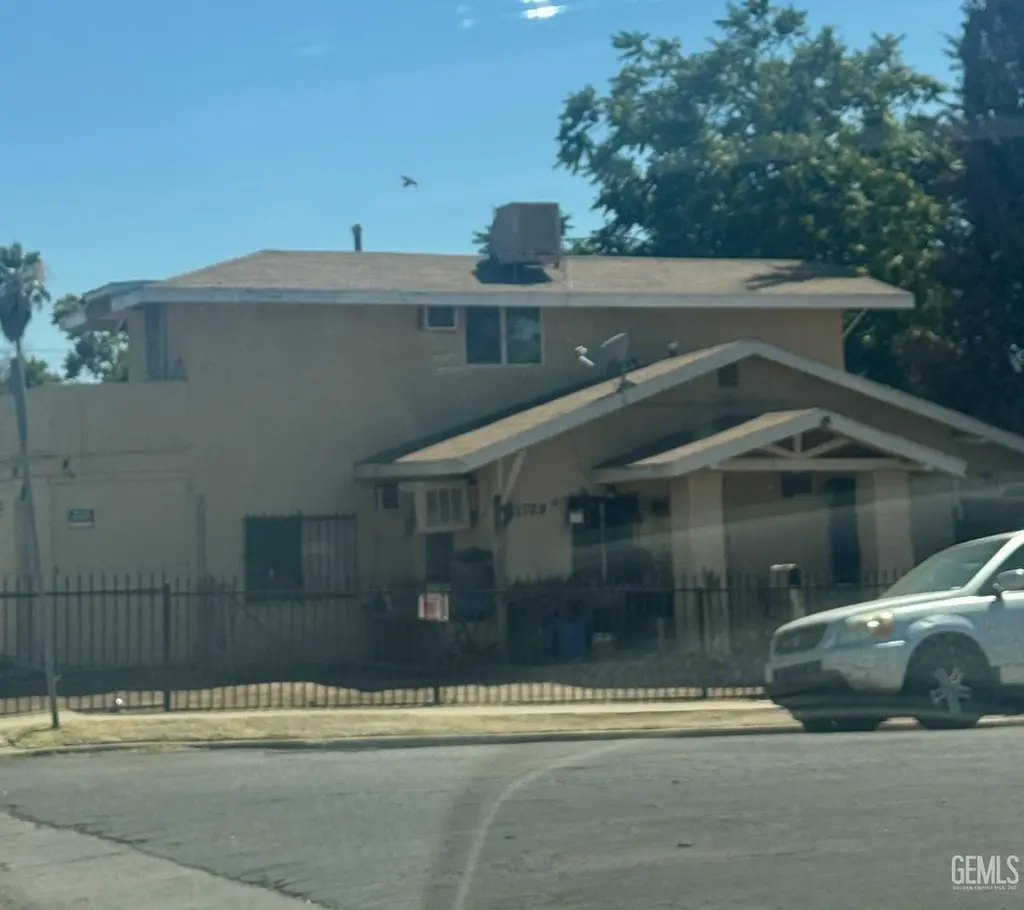
1522 West Dr Unit 5 -10 · East Bakersfield, CA
Flood risk 1/10 · Minimal
- FEMA flood zone
- X (unshaded)
- Chance of flooding over 30 yrs
- 0.0%
- Est. flood insurance / yr
- $507 – $1,088
Fire risk 1/10 · Minimal
- Est. fire insurance / yr
- $659 – $1,223
Heat risk 8/10 · Major
- Hot days now (above 105°F)
- 7 days/yr
- Hot days in 30 yrs
- 19 days/yr
Wind risk 1/10 · Minimal
- Chance of severe wind over 30 yrs
- —
Air-quality risk 10/10 · Severe
- Unhealthy air days now
- 39 days/yr
- Unhealthy air days in 30 yrs
- 45 days/yr
Risk factors via First Street. Map © Google.
Why this score? — see what drove the C+ grade
The composite is a weighted blend of 9 inputs, each scored 0–100. Each bar is that input's sub-score; the figure is the points it added to the 100-point composite (weight × sub-score).
- Cash flow +30.0/30.0
- 1% rule +10.0/10.0
- DSCR +10.0/10.0
- Schools +3.4/10.0
- ARV discount +2.6/15.0
- Livability +2.5/5.0
- Condition / age +2.2/5.0
- Rent growth +2.1/5.0
- Appreciation +0.0/10.0
$399,000
🖨 Deal sheet 📄 Offer letter ✓ Due diligence
Multi-family units
County records classify this as Multi-Family (5+ Unit). Listing-text estimate: 1 unit. estimate disagrees with records
5+ unit building — per-unit beds/baths from public records are typically unavailable; the breakdown below (if shown) is an estimate from the listing text.
Listing remarks MLS
The Seller is willing to finance up $200,000with the interest 7% for 15 years. The property is alsoAdjacent to the Kern Medical Center and The surrounding health care facilities that are part of the Kern Medical Center network.
Key facts
- 0.25 acre lot
- 5 parking spots
- Built 1937
Neighborhood map
What this means for you Summary
Snapshot
- This is a multifamily listed at $399k. Condition is rated fair.
Deal economics
- At list price, monthly cash flow is $2k ($24k/yr) — positive.
- The deal already cash-flows at list — no discount required.
- Meets the 1% rule at list price ($6k rent vs $399k).
- Recommended offer: $351k (12.0% below list) — sets the bar for market timing.
Location & tenants
- Location reads: area grade C — affects rentability + tenant quality, not the cash-flow math above.
- Kern High (urban): math 21% / reading 51% proficiency, ranked #860 of 1,400 in CA (top 61%) — families likely to look elsewhere, expect single-tenant / working-renter base with shorter leases.
- Market conditions: Rents soft (-1.7%/yr); 159 active listings in the ZIP; 2 comparable units currently listed for rent nearby; 3,244 units permitted in Kern County in 2024 (73 in 5+ unit buildings).
- At $6,032/mo this rent would consume 143% of the median local household income ($51k/yr) (locally 2587% of renters already pay >50% of income on rent) — very limited rent-growth headroom before tenants either downsize or default.
Forward outlook
- Local home prices are declining (-3.0%/yr); year-one equity from $3k of loan paydown is wiped out by about $12k of value loss. Plan a longer hold.
- Kern County population projected at +17% by 2050 — long-run rental-demand tailwind backs the buy-and-hold thesis.
- At projected returns (-3.0% appreciation + 0.0% rent growth), your $112k cash investment doubles in ~7 years — after that, you're playing with house money.
Negotiation context
- It's been on market 244 days — a 12% lower offer ($351k) is reasonable based on typical stale-listing flexibility.
- 2 sale attempts with the ask held roughly flat each time — persistent listings suggest the price (not the market) is what's stuck; bring a comps-based counter.
Risks & watch-outs
- Watch-outs: built in 1937 — expect roof / HVAC / electrical / plumbing capex.
- Climate carrying-cost: extreme-heat days projected 7→19/yr by 2055 (HVAC capex compounding) — expect insurance premiums to compound above CPI over the hold.
Questions for the listing agent
- It's been on market 244 days. Have you received any prior offers? Is the seller open to a 12% concession, seller financing, or rate buy-down credit?
- Have any recent inspections been done? Can we get a copy of the seller's disclosures and any deferred-maintenance estimates?
- Built in 1937 — when were the roof, HVAC, electrical panel, plumbing, and water heater last replaced?
- Why hasn't it sold? Are there any deal-killer items the seller is aware of (foundation, flood, title, zoning, code violations)?
- Is there a deadline driving the sale (1031 exchange, divorce, estate, relocation)? That informs how much negotiation room exists.
- What's the average days-on-market for RENTAL listings here right now (not sales)? A rising rental-DOM trend means longer vacancies and softer asking-rent achievability than the comps imply.
- What's the recent tenant-quality profile in this submarket — average credit score on applications, eviction rate, late-payment / NSF rate, and stable-employment percentage? A property-management company in the area should have these aggregated.
- How much new apartment / multifamily construction is in the pipeline within 1–3 miles? Heavy new supply (>2% of stock underway) typically softens rents 12–24 months out; light construction supports rent growth.
Investment metrics
- 1% rule
- 1.51% ✓
- Cap rate
- 12.33%
- Cash-on-cash
- 21.57%
- DSCR
- 1.96
- GRM
- 5.5
CMA / ARV
- ARV (median comp)
- $360,013
- List price
- $399,000
- Delta
- 10.83%
- Verdict
- OVERPRICED
- Comps
- 20 within 1.0 mi
Show comp detail 4 sales within ~0.75 mi
| Address | Dist | Beds/Ba | Sqft | Sold | Price | $/sf | Match |
|---|---|---|---|---|---|---|---|
| 2100 Oregon St | 0.30mi | 8/4.0 | 2,488 (-1%) | 4mo | $510,000 | $205 | 80 |
| 1529 Palm Dr | 0.20mi | 7/3.0 | 2,761 (+10%) | 18mo | $250,000 | $91 | 59 |
| 2300 Lake St | 0.59mi | 8/3.0 | 2,725 (+8%) | 10mo | $595,000 | $218 | 50 |
| 1309 Bernard St | 0.63mi | 4/4.0 | 2,696 (+7%) | 14mo | $420,000 | $156 | 47 |
Match score weights: distance 35% · size 25% · config 20% · recency 20%. Top-matched comps best support the ARV.
Projected returns pro-forma
-3.0% appreciation · 0.0% rent growth · sell at horizon
- IRR
- 10.7%
- Equity multiple
- 1.41×
- Total profit
- $45,641
- Equity at exit
- $59,492
- IRR
- 17.2%
- Equity multiple
- 2.22×
- Total profit
- $136,467
- Equity at exit
- $34,498
Cash invested: $111,720 (down + closing). Projections, not guarantees.
Landlord ↔ Tenant lean methodology
- Overall (STATE)
- 18 Strongly Tenant-Friendly
- State California
- 18 Strongly Tenant-Friendly · D+13
- County
- — inherits STATE
- City
- — inherits STATE
ZIP-level market 93304
- Rents YoY
- -1.7%
- Active inventory
- 159
- Price-to-rent
- 33.1×
Monthly cashflow live
- Estimated rent
- $6,032 medium interval (Pro) →
- Mortgage (P&I)
- −$2,092
- Tax est. 1.5%
- −$499 /mo · $5,985/yr
- Insurance
- −$166
- HOA
- −$0
- Vacancy / Maint / Mgmt
- −$1,267
- Net cashflow
- $2,008
Break-even live
6-unit breakdown (identical units grouped — click to expand)
| Units | Beds | Baths | Est. rent |
|---|---|---|---|
| 6× units | 1 | 1 | $6,030 |
| #1 | 1 | 1 | $1,005 |
| #2 | 1 | 1 | $1,005 |
| #3 | 1 | 1 | $1,005 |
| #4 | 1 | 1 | $1,005 |
| #5 | 1 | 1 | $1,005 |
| #6 | 1 | 1 | $1,005 |
| Total (6 units) | $6,032 | ||
UW: 25.0% down · 7.5% · 30yr · 1.5% tax · 5.0% vac · 8.0% maint · 8.0% mgmt
Financing live
Cash to close
- Down payment
- $99,750
- Closing costs
- $11,970
- Reserves months
- —
- Total cash needed
- —
Loan-product check · same deal, 3 products live
Conventional
25% down · 7.5% · 30yr
- Down + closing
- —
- Monthly P&I
- —
- Monthly cashflow
- —
- DSCR
- —
- Eligible?
- —
Personal DTI + credit; lowest rate.
DSCR
20% down · 8.5% · 30yr
- Down + closing
- —
- Monthly P&I
- —
- Monthly cashflow
- —
- DSCR
- —
- Eligible?
- —
No personal income docs; deal must DSCR.
Hard money
10% down · 12.0% · 12mo
- Down + closing
- —
- Monthly P&I
- —
- Monthly cashflow
- —
- DSCR
- —
- Eligible?
- —
Short-term bridge; refi at stabilization.
Rent comps 2 comps
| Address | Beds | Baths | Sqft | Rent | $/sqft | DOM | Units | Dist |
|---|---|---|---|---|---|---|---|---|
| 1500 Palm Dr Bakersfield, CA | 3.0 | 2.0 | 2000 | $2,200 | $1.10 | 2d | 1 | 0.18mi |
| 1308 Flower St Unit A Bakersfield, CA | 2.0 | 1.0 | 3432 | $1,475 | $0.43 | 2d | 1 | 0.44mi |
Listing history 17 events
-
2026-06-18days on market $399,000 Active 244 DOM
-
2026-06-17days on market $399,000 Active 243 DOM
-
2026-06-16days on market $399,000 Active 242 DOM
-
2026-06-15days on market $399,000 Active 241 DOM
-
2026-06-14days on market $399,000 Active 239 DOM
-
2026-06-10days on market $399,000 Active 236 DOM
-
2026-06-09days on market $399,000 Active 235 DOM
-
2026-06-08days on market $399,000 Active 234 DOM
-
2026-06-07days on market $399,000 Active 233 DOM
-
2026-06-05days on market $399,000 Active 230 DOM
-
2026-06-03days on market $399,000 Active 229 DOM
-
2026-06-03days on market $399,000 Active 228 DOM
-
2026-06-01days on market $399,000 Active 227 DOM
-
2026-05-31days on market $399,000 Active 226 DOM
-
2025-10-28status Active 227-char remark
Show marketing remark (227 chars)
The Seller is willing to finance up $200,000with the interest 7% for 15 years. The property is alsoAdjacent to the Kern Medical Center and The surrounding health care facilities that are part of the Kern Medical Center network.
-
2025-08-18status Pending 227-char remark
Show marketing remark (227 chars)
The Seller is willing to finance up $200,000with the interest 7% for 15 years. The property is alsoAdjacent to the Kern Medical Center and The surrounding health care facilities that are part of the Kern Medical Center network.
-
2025-08-07$399,000 Active 227-char remark
Show marketing remark (227 chars)
The Seller is willing to finance up $200,000with the interest 7% for 15 years. The property is alsoAdjacent to the Kern Medical Center and The surrounding health care facilities that are part of the Kern Medical Center network.
ⓘ Source: listings_history table (triggers on properties + properties_extension) + one-shot
backfill from property_details.listing_events for pre-trigger history.
Climate risk First Street
- Flood 1/10 Low FEMA zone X (unshaded) · 0% chance over 30 yrs
- Wildfire 1/10 Low
- Heat 8/10 Severe 7 d/yr ≥105°F today · 19 d/yr by 30 yrs out
- Wind 1/10 Low
- Air quality 10/10 Extreme 39 unhealthy d/yr today · 45 by 30 yrs out
Nearby sold comps map
Loading sold comps map…
Walkable amenities ~0.75 mi
Loading nearby amenities…
Taxation est. · year 1
- Rental income
- $72,384
- − Mortgage interest
- −$22,350
- − Property taxes
- −$5,985
- − Insurance
- −$1,995
- − Repairs & maintenance
- −$5,791
- − Management
- −$5,791
- − Depreciation
- −$11,607
- Taxable income
- $18,865
- Est. tax owed @ 24.0%
- −$4,528
- After-tax cash flow
- $19,567/yr
For passive investors: Depreciation is non-cash, so a rental often shows a tax loss while cash-flowing — sheltering income. Rental losses are passive: they offset passive income freely, and up to $25,000/yr can offset ordinary (W-2) income if you actively participate and your MAGI is under $100k (phasing out to $0 by $150k); unused losses carry forward. On sale, claimed depreciation is recaptured at up to 25%, and gains may owe capital-gains tax (a 1031 exchange can defer both). Figures are a year-1 estimate at your 24.0% rate — not tax advice; consult a CPA.
Condition & rehab AI · 12 photos
The property requires moderate repairs and maintenance, with potential for significant value increase through cosmetic updates and landscaping improvements.
Repairs flagged
- Moderate Kitchen cabinets — Worn condition
- Minor Bathroom fixtures — May need updating
- Moderate Exterior walls — Weathered appearance
- Minor Paint — Chipped in some areas
- Minor Windows — Blinds present but may need cleaning or replacement
- Minor HVAC units — May need cleaning
Value-add opportunities
- Both Painting and minor repairs to exterior — Enhances curb appeal and value
- Both Landscaping improvements — Enhances curb appeal and value
- Both Kitchen and bathroom updates — Improves functionality and aesthetics
Renovation cost estimate screening
| Repair item | Severity | Est. cost |
|---|---|---|
| Kitchen cabinets · Worn condition | Moderate | $3,000–15,000 |
| Bathroom fixtures · May need updating | Minor | $500–3,000 |
| Exterior walls · Weathered appearance | Moderate | $3,000–15,000 |
| Paint · Chipped in some areas | Minor | $500–3,000 |
| Windows · Blinds present but may need cleaning or replacement | Minor | $500–3,000 |
| HVAC units · May need cleaning | Minor | $500–3,000 |
| Total estimated repair cost · 6 items | $8,000–42,000 |
Value-add ROI direction
- Both Painting and minor repairs to exterior — Enhances curb appeal and value ↑
- Both Landscaping improvements — Enhances curb appeal and value ↑
- Both Kitchen and bathroom updates — Improves functionality and aesthetics ↑
ⓘ Cost ranges are severity-bucket heuristics (US national rule-of-thumb). Get contractor quotes + a written scope before underwriting a rehab budget.
Schools (NCES district)
- District
- Kern High
- NCES district ID
- 0619540
- Math proficiency
- 21% ▬ 0.00%
- Reading proficiency
- 51% ▲ 2.00%
- Median HH income
- $49,686
- Composite
- 33.68/100
- National rank
- #10443
- State rank
- #860 of 1400 in CA
Livability — East Bakersfield
No livability data for this city. (Only ~50 U.S. cities are tracked.)
Census & demographics
- Census place
- East Bakersfield, CA
- County
- Kern County · 710,371 people
- Metro
- Bakersfield, CA
- Population (ZIP)
- 51,037
- Household income
- $50,790
- Rent vs Own
- Severe rent burden
- 2587.0
Population outlook (Kern County) Hauer SSP2
- Today (2025)
- 947,286 people
- By 2030
- 978,984 · +3.3%
- By 2040
- 1,045,018 · +10.3%
- By 2050
- 1,105,232 · +16.7%
- By 2075
- 1,229,538 · +29.8%
- By 2100
- 1,238,059 · +30.7%
Race, ethnicity, and origin ACS 2023
- Neighborhood character
- Predominantly Hispanic (71%)
- Race & ethnicity
- Hispanic / Latino 71% Two or more races 18% White 14% Black 9% Asian 3% Native American 2%
- Hispanic origin (detail)
- Mexican 65%
- Foreign-born
- 22% · Canada, China
- Languages at home
- 48% English-only · Spanish 49% Other Asian/Pacific 1% Tagalog/Filipino 1%
Political lean MEDSL · Kern
- 2024 margin
- Strong R (+21.1) · D 38.2% · R 59.3% · Other 2.5%
- 2008→2024 swing
- -3.3pp toward R · 2008: -17.8pp · 2024: -21.1pp
- All cycles
- 2024: R+21.1 2020: R+10.2 2016: R+15.0 2012: R+20.9 2008: R+17.8
Not yet ingested
- Civics
- —
Market trends
- HPI YoY
- ▼ -314.78%
- Current HPI
- 397.9557
- Rent YoY
- ▼ -1.68%
- Metro
- Bakersfield, CA
- State GDP YoY
- ▲ 3.21%
- F500 in state
- 116
Industry mix (Fortune 500 HQ in CA)
| Industry | F500 HQs | Revenue |
|---|---|---|
| Technology | 27 | $1,492B |
|
||
| Financial Services | 3 | $174B |
|
||
| Retail | 3 | $44B |
|
||
| Insurance | 3 | $26B |
|
||
| Media / Entertainment | 2 | $115B |
|
||
| Pharmaceuticals / Biotech | 2 | $62B |
|
||
Price history
3 events — show timeline
- 2025-10-28 Relisted — GEMLS
- 2025-08-18 Pending — GEMLS
- 2025-08-07 Listed $399,000 GEMLS
Cash-flow waterfall
monthlySold comps — $/sqft
last 12 mo · ≤1 miLoading sold comps…