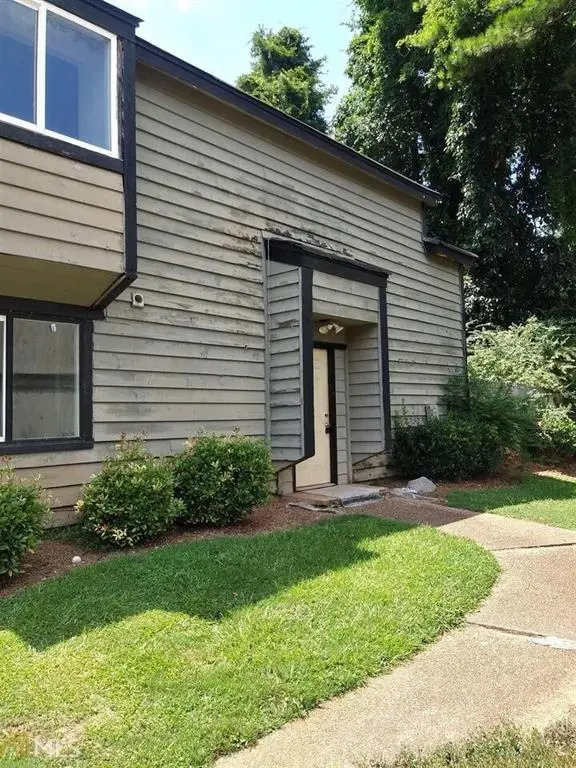
6020 Regent Mnr · Stonecrest, GA
Flood risk 1/10 · Minimal
- FEMA flood zone
- X (unshaded)
- Chance of flooding over 30 yrs
- 0.0%
- Est. flood insurance / yr
- $507 – $1,088
Fire risk 3/10 · Minor
- Est. fire insurance / yr
- $963 – $1,789
Heat risk 6/10 · Moderate
- Hot days now (above 105°F)
- 7 days/yr
- Hot days in 30 yrs
- 20 days/yr
Wind risk 5/10 · Moderate
- Chance of severe wind over 30 yrs
- 26.0%
Air-quality risk 5/10 · Moderate
- Unhealthy air days now
- 7 days/yr
- Unhealthy air days in 30 yrs
- 10 days/yr
Risk factors via First Street. Map © Google.
Why this score? — see what drove the B- grade
The composite is a weighted blend of 9 inputs, each scored 0–100. Each bar is that input's sub-score; the figure is the points it added to the 100-point composite (weight × sub-score).
- Cash flow +30.0/30.0
- 1% rule +10.0/10.0
- DSCR +10.0/10.0
- ARV discount +7.4/15.0
- Rent growth +2.8/5.0
- Livability +2.5/5.0
- Condition / age +2.5/5.0
- Schools +2.1/10.0
- Appreciation +0.0/10.0
$88,000
🖨 Deal sheet (PDF) 📄 Offer letter ✓ Due diligence
Listing remarks MLS
roomy townhome in good condition. walk to bus, shopping. 5 min to. Property is rented. Great find for investors.
Key facts
- Townhome
- Shopping
- Walk to bus
Tags
Neighborhood map
What this means for you Summary
Snapshot
- This is a 3-bed/2.5-bath condo listed at $88k.
Deal economics
- At list price, monthly cash flow is $586 ($7k/yr) — positive.
- The deal already cash-flows at list — no discount required.
- Meets the 1% rule at list price ($2k rent vs $88k).
- Recommended offer: $77k (12.0% below list) — sets the bar for market timing.
- Cap rate 14.3% vs local median 5.1% in Stonecrest — top-decile yield for the area; either an underpriced asset or a hidden risk that comps aren't pricing in. Stress-test before assuming the spread holds.
Location & tenants
- Location reads: area grade B — affects rentability + tenant quality, not the cash-flow math above.
- Dekalb County (suburban): math 19% / reading 28% proficiency, ranked #125 of 174 in GA (top 72%) — low school quality limits family demand, transient renter base, plan for 1-2y turnover; 68% free/reduced lunch — lower-income household profile, screen leases tightly.
- Market conditions: Rents rising (+1.2%/yr); 435 active listings in the ZIP; 40 comparable units currently listed for rent nearby; rentals at typical pace (median 25d on market — plan ~3-4 weeks tenant-placement turnaround); 42% of comp listings sitting > 30 days — soft ceiling on asking rent; 1,240 units permitted in DeKalb County in 2024 (385 in 5+ unit buildings).
- This rent runs 35% of the median local income ($62k/yr) — at the standard rent-burdened threshold; future hikes will face affordability resistance.
Forward outlook
- Local home prices are declining (-3.0%/yr); year-one equity from $608 of loan paydown is wiped out by about $3k of value loss. Plan a longer hold.
- DeKalb County population projected at +28% by 2050 — long-run rental-demand tailwind backs the buy-and-hold thesis.
- At projected returns (-3.0% appreciation + 1.2% rent growth), your $25k cash investment doubles in ~5 years — after that, you're playing with house money.
Negotiation context
- It's been on market 147 days — a 12% lower offer ($77k) is reasonable based on typical stale-listing flexibility.
- 4 sale attempts since 8y ago; this cycle's ask has dropped $27k (23%) from the opening price — seller is motivated, your offer sets the floor, not the list.
- Current owner paid $44k; list at $88k implies a 100% gain — meaningful room to come down on a strong offer.
Risks & watch-outs
- Climate carrying-cost: moderate wind risk, 26% chance of damaging wind over 30y; extreme-heat days projected 7→20/yr by 2055 (HVAC capex compounding) — expect insurance premiums to compound above CPI over the hold.
Questions for the listing agent
- It's been on market 147 days. Have you received any prior offers? Is the seller open to a 12% concession, seller financing, or rate buy-down credit?
- Built in 1973 — when were the roof, HVAC, electrical panel, plumbing, and water heater last replaced?
- What does the HOA fee cover, when was the last increase, and are there any pending special assessments or reserve-fund shortfalls?
- Any open or pending special assessments — roof, HVAC, plumbing, elevator, façade? What's the per-unit balance and payoff schedule, and is the seller paying it off at close or rolling it to the buyer?
- Why hasn't it sold? Are there any deal-killer items the seller is aware of (foundation, flood, title, zoning, code violations)?
- Is there a deadline driving the sale (1031 exchange, divorce, estate, relocation)? That informs how much negotiation room exists.
- What's the average days-on-market for RENTAL listings here right now (not sales)? A rising rental-DOM trend means longer vacancies and softer asking-rent achievability than the comps imply.
- What's the recent tenant-quality profile in this submarket — average credit score on applications, eviction rate, late-payment / NSF rate, and stable-employment percentage? A property-management company in the area should have these aggregated.
- How much new apartment / multifamily construction is in the pipeline within 1–3 miles? Heavy new supply (>2% of stock underway) typically softens rents 12–24 months out; light construction supports rent growth.
Investment metrics
- 1% rule
- 2.07% ✓
- Cap rate
- 14.29%
- Cash-on-cash
- 28.56%
- DSCR
- 2.27
- GRM
- 4.0
CMA / ARV
- ARV (median comp)
- $87,884
- List price
- $88,000
- Delta
- 0.13%
- Verdict
- FAIR
- Comps
- 20 within 1.0 mi
Projected returns pro-forma
-3.0% appreciation · 1.18% rent growth · sell at horizon
- IRR
- 20.4%
- Equity multiple
- 1.81×
- Total profit
- $19,989
- Equity at exit
- $13,121
- IRR
- 27.2%
- Equity multiple
- 3.16×
- Total profit
- $53,267
- Equity at exit
- $7,609
Cash invested: $24,640 (down + closing). Projections, not guarantees.
Landlord ↔ Tenant lean methodology
- Overall (STATE)
- 90 Strongly Landlord-Friendly
- State Georgia
- 90 Strongly Landlord-Friendly · R+3
- County
- — inherits STATE
- City
- — inherits STATE
ZIP-level market 30058
- Home prices YoY
- -21.4%
- Rents YoY
- 1.2%
- Active inventory
- 435
- Price-to-rent
- 4.0×
Monthly cashflow live
- Estimated rent
- $1,819 high interval (Pro) →
- Mortgage (P&I)
- −$461
- Tax from tax record
- −$142 /mo · $1,709/yr
- Insurance
- −$37
- HOA
- −$210
- Vacancy / Maint / Mgmt
- −$382
- Net cashflow
- $586
Break-even live
Sensitivity live
| Price | -10% $636 | -5% $611 | +0% $586 | +5% $561 | +10% $537 |
|---|---|---|---|---|---|
| Rent | -10% $443 | -5% $514 | +0% $586 | +5% $658 | +10% $730 |
| Rate | -1.0pp $631 | -0.5pp $609 | base $586 | +0.5pp $564 | +1.0pp $540 |
UW: 25.0% down · 7.5% · 30yr · 1.5% tax · 5.0% vac · 8.0% maint · 8.0% mgmt
Financing live
Cash to close
- Down payment
- $22,000
- Closing costs
- $2,640
- Reserves months
- —
- Total cash needed
- —
Loan-product check · same deal, 3 products live
Conventional
25% down · 7.5% · 30yr
- Down + closing
- —
- Monthly P&I
- —
- Monthly cashflow
- —
- DSCR
- —
- Eligible?
- —
Personal DTI + credit; lowest rate.
DSCR
20% down · 8.5% · 30yr
- Down + closing
- —
- Monthly P&I
- —
- Monthly cashflow
- —
- DSCR
- —
- Eligible?
- —
No personal income docs; deal must DSCR.
Hard money
10% down · 12.0% · 12mo
- Down + closing
- —
- Monthly P&I
- —
- Monthly cashflow
- —
- DSCR
- —
- Eligible?
- —
Short-term bridge; refi at stabilization.
Rent comps 40 comps
| Address | Beds | Baths | Sqft | Rent | $/sqft | DOM | Units | Dist |
|---|---|---|---|---|---|---|---|---|
| 5975 Hillvale Trl Lithonia, GA | 3.0 | 2.0 | 1616 | $1,900 | $1.18 | 44d | 1 | 0.03mi |
| 6012 Regent Mnr Lithonia, GA | 2.0 | 2.0 | 1200 | $1,450 | $1.21 | 44d | 1 | 0.03mi |
| 6067 Regent Mnr Lithonia, GA | 3.0 | 2.5 | 1524 | $1,700 | $1.12 | 44d | 1 | 0.13mi |
| 2770 Field Spring Dr Lithonia, GA | 4.0 | 2.5 | 2242 | $1,995 | $0.89 | 44d | 1 | 0.30mi |
| 2379 Hillvale Cir Lithonia, GA | 3.0 | 2.0 | 1368 | $1,790 | $1.31 | 5d | 1 | 0.32mi |
| 6250 Hillandale Dr Lithonia, GA | 1.0–4.0 | 1.0–2.0 | 1121 | $1,600 | $1.43 | 44d | 1 | 0.39mi |
| 5044 Chupp Way Cir Lithonia, GA | 3.0 | 2.5 | 1212 | $1,395 | $1.15 | 22d | 1 | 0.45mi |
| 5052 Chupp Way Cir Lithonia, GA | 2.0 | 2.5 | 1150 | $1,580 | $1.37 | 44d | 1 | 0.46mi |
| 6256 Hillandale Dr Lithonia, GA | 1.0–3.0 | 1.0–2.0 | 990 | $1,599 | $1.62 | 44d | 1 | 0.46mi |
| 6414 Shalks Crossing Dr Lithonia, GA | 3.0 | 2.5 | 1580 | $2,050 | $1.30 | 5d | 1 | 0.47mi |
| 416 Hillandale Park Dr Lithonia, GA | 3.0 | 2.5 | 1742 | $1,759 | $1.01 | 44d | 1 | 0.52mi |
| 3127 Fields Dr Lithonia, GA | 2.0 | 2.5 | 1206 | $1,800 | $1.49 | 19d | 1 | 0.55mi |
| 5850 Hillandale Dr Lithonia, GA | 1.0–3.0 | 1.0–2.0 | 1119 | $1,733 | $1.55 | 0d | 11 | 0.56mi |
| 564 Hillandale Park Dr Lithonia, GA | 2.0 | 2.0 | 1150 | $2,250 | $1.96 | 44d | 1 | 0.58mi |
| 89 Tiburon Ct Lithonia, GA | 2.0 | 1.5 | 1250 | $1,450 | $1.16 | 13d | 1 | 0.65mi |
| 2940 Parc Lorraine Unit 1 Stonecrest, GA | 2.0 | 2.0 | 1072 | $1,195 | $1.11 | 44d | 1 | 0.65mi |
| 2932 Parc Lorraine Lithonia, GA | 2.0 | 2.0 | 1280 | $1,399 | $1.09 | 25d | 1 | 0.66mi |
| 5873 Keystone Ln Lithonia, GA | 3.0 | 2.5 | 1986 | $2,100 | $1.06 | 19d | 1 | 0.66mi |
| 5873 Keystone Ln Lithonia, GA | 3.0 | 2.5 | 1986 | $2,100 | $1.06 | 44d | 1 | 0.66mi |
| 2928 Parc Lorraine Lithonia, GA | 3.0 | 2.0 | 1788 | $1,425 | $0.80 | 22d | 1 | 0.66mi |
| 3064 Parc Lorraine Unit 1 Stonecrest, GA | 2.0 | 2.0 | 1280 | $1,195 | $0.93 | 4d | 1 | 0.72mi |
| 3024 Parc Lorraine Lithonia, GA | 3.0 | 2.0 | 1628 | $1,550 | $0.95 | 3d | 1 | 0.73mi |
| 2360 Wellington Cir Lithonia, GA | 3.0 | 2.5 | 1404 | $1,900 | $1.35 | 44d | 1 | 0.75mi |
| 3021 Fields Dr Lithonia, GA | 3.0 | 2.5 | 1450 | $1,595 | $1.10 | 25d | 1 | 0.80mi |
| 5946 Crescent Ridge Ct Lithonia, GA | 3.0 | 2.0 | 1278 | $1,725 | $1.35 | 5d | 1 | 0.81mi |
| 5876 Trent Walk Dr Lithonia, GA | 2.0 | 1.5 | 1084 | $1,550 | $1.43 | 5d | 1 | 0.82mi |
| 8202 Fairington Ridge Cir Lithonia, GA | 3.0 | 2.0 | 1300 | $1,900 | $1.46 | 44d | 1 | 0.84mi |
| 7104 Fairington Ridge Cir Lithonia, GA | 3.0 | 2.0 | 1292 | $1,300 | $1.01 | 3d | 1 | 0.86mi |
| 14204 Fairington Ridge Cir Lithonia, GA | 3.0 | 2.0 | 1292 | $1,550 | $1.20 | 44d | 1 | 0.86mi |
| 14302 Fairington Ridge Cir Lithonia, GA | 3.0 | 2.0 | 1292 | $1,650 | $1.28 | 44d | 1 | 0.88mi |
| 6229 Creekford Ln Lithonia, GA | 3.0 | 2.0 | 2086 | $1,860 | $0.89 | 0d | 1 | 0.88mi |
| 100 Walden Brook Dr Stonecrest, GA | 1.0–3.0 | 1.0–2.0 | 1132 | $1,607 | $1.42 | 0d | 14 | 0.89mi |
| 13202 Fairington Ridge Cir Lithonia, GA | 3.0 | 2.0 | 1292 | $1,650 | $1.28 | 17d | 1 | 0.91mi |
| 5926 Trent Jones Way Lithonia, GA | 2.0 | 2.5 | 1122 | $1,200 | $1.07 | 18d | 1 | 0.91mi |
| 6249 Creekford Ln Lithonia, GA | 3.0 | 2.5 | 1352 | $1,586 | $1.17 | 44d | 1 | 0.91mi |
| 6301 Fairington Village Dr Stonecrest, GA | 3.0 | 2.0 | 1300 | $1,900 | $1.46 | 5d | 1 | 0.91mi |
| 2649 Parrish Ct Lithonia, GA | 3.0 | 2.5 | 1588 | $1,800 | $1.13 | 44d | 1 | 0.91mi |
| 13101 Fairington Ridge Cir Unit 101 Stonecrest, GA | 3.0 | 2.0 | 1292 | $1,400 | $1.08 | 25d | 1 | 0.91mi |
| 6272 Creekford Dr Lithonia, GA | 3.0 | 2.0 | 1200 | $1,650 | $1.38 | 5d | 1 | 0.91mi |
| 6012 Wellborn Trl Lithonia, GA | 3.0 | 2.0 | 1510 | $1,760 | $1.17 | 2d | 1 | 0.92mi |
HOA detail condo
- Monthly dues
- $210 · $2,520/yr
- Assessments
- None detected in remarks — confirm with the listing agent.
Listing history 34 events
-
2026-06-18days on market $88,000 Active 147 DOM
-
2026-06-17days on market $88,000 Active 146 DOM
-
2026-06-16days on market $88,000 Active 145 DOM
-
2026-06-15days on market $88,000 Active 144 DOM
-
2026-06-13days on market $88,000 Active 142 DOM
-
2026-06-09days on market $88,000 Active 138 DOM
-
2026-06-08days on market $88,000 Active 137 DOM
-
2026-06-07days on market $88,000 Active 136 DOM
-
2026-06-04days on market $88,000 Active 133 DOM
-
2026-06-03days on market $88,000 Active 132 DOM
-
2026-06-02days on market $88,000 Active 131 DOM
-
2026-06-01days on market $88,000 Active 130 DOM
-
2026-05-31days on market $88,000 Active 129 DOM
-
2026-05-19price $88,000 112-char remark
Show marketing remark (112 chars)
roomy townhome in good condition. walk to bus, shopping. 5 min to. Property is rented. Great find for investors.
-
2026-05-18price $88,000 112-char remark
Show marketing remark (112 chars)
roomy townhome in good condition. walk to bus, shopping. 5 min to. Property is rented. Great find for investors.
-
2026-04-28price $93,000 112-char remark
Show marketing remark (112 chars)
roomy townhome in good condition. walk to bus, shopping. 5 min to. Property is rented. Great find for investors.
-
2026-04-28price $93,000 112-char remark
Show marketing remark (112 chars)
roomy townhome in good condition. walk to bus, shopping. 5 min to. Property is rented. Great find for investors.
-
2026-02-09price $98,000 112-char remark
Show marketing remark (112 chars)
roomy townhome in good condition. walk to bus, shopping. 5 min to. Property is rented. Great find for investors.
-
2026-02-09price $98,000 112-char remark
Show marketing remark (112 chars)
roomy townhome in good condition. walk to bus, shopping. 5 min to. Property is rented. Great find for investors.
-
2026-01-22$115,000 New 112-char remark
Show marketing remark (112 chars)
roomy townhome in good condition. walk to bus, shopping. 5 min to. Property is rented. Great find for investors.
-
2026-01-22$115,000 Active 112-char remark
Show marketing remark (112 chars)
roomy townhome in good condition. walk to bus, shopping. 5 min to. Property is rented. Great find for investors.
-
2020-06-23soldstatus $44,000
-
2020-06-18soldstatus $44,000 Sold
-
2020-05-13status Under Contract
-
2020-03-19$48,000 New
-
2018-12-29historical
-
2018-07-13price $58,900
-
2018-06-27$62,900 New
-
2017-05-17soldstatus $24,200
-
2013-06-28soldstatus $40,000
-
2012-09-25soldstatus $18,500
-
1986-02-04soldstatus $45,000
-
1980-12-19soldstatus $42,100
-
1980-11-10soldstatus $29,600
ⓘ Source: listings_history table (triggers on properties + properties_extension) + one-shot
backfill from property_details.listing_events for pre-trigger history.
Tax reassessment forecast GA · Resets to sale price
- Current annual tax
- $1,709 · $142/mo
- Projected year-2 tax
- $1,709 · $142/mo
- Expected delta
- $0/yr ($0/mo · -0.0%)
ⓘ Screening estimate from a state-policy table — verify with the county assessor before closing.
Climate risk First Street
- Flood 1/10 Low FEMA zone X (unshaded) · 0% chance over 30 yrs
- Wildfire 3/10 Moderate
- Heat 6/10 Major 7 d/yr ≥105°F today · 20 d/yr by 30 yrs out
- Wind 5/10 Major 26% chance of damaging wind over 30 yrs
- Air quality 5/10 Major 7 unhealthy d/yr today · 10 by 30 yrs out
Nearby sold comps map
Loading sold comps map…
Walkable amenities ~0.75 mi
Loading nearby amenities…
Taxation est. · year 1
- Rental income
- $21,827
- − Mortgage interest
- −$4,929
- − Property taxes
- −$1,709
- − Insurance
- −$440
- − Repairs & maintenance
- −$1,746
- − Management
- −$1,746
- − HOA
- −$2,520
- − Depreciation
- −$2,560
- Taxable income
- $6,176
- Est. tax owed @ 24.0%
- −$1,482
- After-tax cash flow
- $5,554/yr
For passive investors: Depreciation is non-cash, so a rental often shows a tax loss while cash-flowing — sheltering income. Rental losses are passive: they offset passive income freely, and up to $25,000/yr can offset ordinary (W-2) income if you actively participate and your MAGI is under $100k (phasing out to $0 by $150k); unused losses carry forward. On sale, claimed depreciation is recaptured at up to 25%, and gains may owe capital-gains tax (a 1031 exchange can defer both). Figures are a year-1 estimate at your 24.0% rate — not tax advice; consult a CPA.
Schools (NCES district)
- District
- Dekalb County
- NCES district ID
- 1301740
- Math proficiency
- 19% ▼ -12.00%
- Reading proficiency
- 28% ▼ -7.00%
- Median HH income
- $51,448
- Composite
- 20.92/100
- National rank
- #8482
- State rank
- #125 of 174 in GA
Livability — Stonecrest
No livability data for this city. (Only ~50 U.S. cities are tracked.)
Census & demographics
- Census place
- Stonecrest, GA
- County
- Dekalb County · 782,738 people
- City population
- 106,165
- Metro
- Atlanta-Sandy Springs-Alpharetta, GA
- Population (ZIP)
- 62,614
- Household income
- $61,684
- Rent vs Own
- Severe rent burden
- 3471.0
Population outlook (DeKalb County) Hauer SSP2
- Today (2025)
- 839,977 people
- By 2030
- 891,768 · +6.2%
- By 2040
- 988,894 · +17.7%
- By 2050
- 1,074,583 · +27.9%
- By 2075
- 1,245,026 · +48.2%
- By 2100
- 1,303,135 · +55.1%
Race, ethnicity, and origin ACS 2023
- Neighborhood character
- Predominantly Black (91%)
- Race & ethnicity
- Black 91% Hispanic / Latino 3% White 3% Two or more races 3%
- Common ancestry
- Hispanic 0%
- Foreign-born
- 12% · Canada, United Kingdom
- Languages at home
- 93% English-only · Spanish 2% French/Haitian/Cajun 1%
Political lean MEDSL · DeKalb
- 2024 margin
- Solid D (+64.8) · D 81.9% · R 17.1% · Other 1.0%
- 2008→2024 swing
- +6.1pp toward D · 2008: 58.6pp · 2024: 64.8pp
- All cycles
- 2024: D+64.8 2020: D+67.4 2016: D+64.8 2012: D+56.8 2008: D+58.6
Not yet ingested
- Civics
- —
Market trends
- HPI YoY
- ▼ -60.90%
- Current HPI
- 224.0366
- Rent YoY
- ▲ 1.18%
- Metro
- Atlanta-Sandy Springs-Alpharetta, GA
- State GDP YoY
- ▲ 2.66%
- F500 in state
- 28
Industry mix (Fortune 500 HQ in GA)
| Industry | F500 HQs | Revenue |
|---|---|---|
| Paper / Packaging | 2 | $29B |
|
||
| Retail | 1 | $160B |
|
||
| Transportation / Logistics | 1 | $91B |
|
||
| Airlines | 1 | $62B |
|
||
| Consumer Goods | 1 | $47B |
|
||
| Utilities | 1 | $25B |
|
||
Price history
+197.3% since first listed21 events — show timeline
- 2026-05-19 Price Changed $88,000 GAMLS
- 2026-05-18 Price Changed $88,000 FMLS
- 2026-04-28 Price Changed $93,000 FMLS
- 2026-04-28 Price Changed $93,000 GAMLS
- 2026-02-09 Price Changed $98,000 GAMLS
- 2026-02-09 Price Changed $98,000 FMLS
- 2026-01-22 Listed $115,000 FMLS
- 2026-01-22 Listed $115,000 GAMLS
- 2020-06-23 Sold (Public Records) $44,000 Public Records
- 2020-06-18 Sold (MLS) $44,000 GAMLS
- 2020-05-13 Pending — GAMLS
- 2020-03-19 Listed $48,000 GAMLS
- 2018-12-29 Listing Removed — GAMLS
- 2018-07-13 Price Changed $58,900 GAMLS
- 2018-06-27 Listed $62,900 GAMLS
- 2017-05-17 Sold (Public Records) $24,200 Public Records
- 2013-06-28 Sold (Public Records) $40,000 Public Records
- 2012-09-25 Sold (Public Records) $18,500 Public Records
- 1986-02-04 Sold (Public Records) $45,000 Public Records
- 1980-12-19 Sold (Public Records) $42,100 Public Records
- 1980-11-10 Sold (Public Records) $29,600 Public Records
Property tax history
+5.0%/yrLatest (2025): $1,709 · -17.4% YoY. Source: county tax records.
Cash-flow waterfall
monthlySold comps — $/sqft
last 12 mo · ≤1 miLoading sold comps…