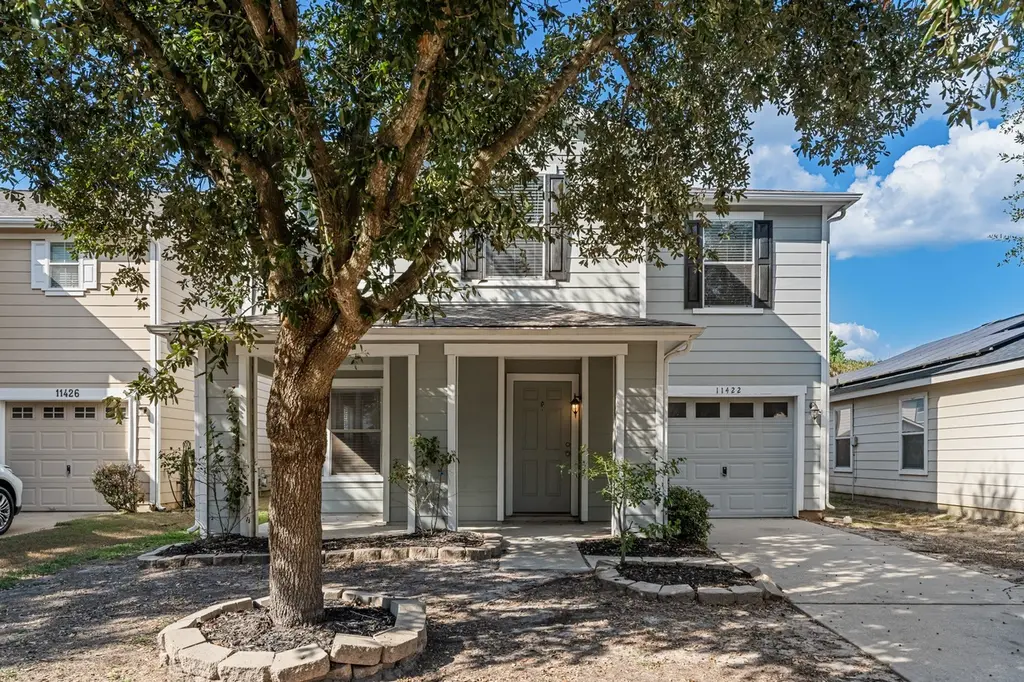
11422 Log Cabin Ln · Houston, TX
Flood risk 1/10 · Minimal
- FEMA flood zone
- X (unshaded)
- Chance of flooding over 30 yrs
- 0.0%
- Est. flood insurance / yr
- $507 – $1,088
Fire risk 4/10 · Minor
- Est. fire insurance / yr
- $1,222 – $2,270
Heat risk 9/10 · Severe
- Hot days now (above 110°F)
- 7 days/yr
- Hot days in 30 yrs
- 23 days/yr
Wind risk 8/10 · Major
- Chance of severe wind over 30 yrs
- 99.0%
Air-quality risk 3/10 · Minor
- Unhealthy air days now
- 2 days/yr
- Unhealthy air days in 30 yrs
- 3 days/yr
Risk factors via First Street. Map © Google.
Why this score? — see what drove the D- grade
The composite is a weighted blend of 9 inputs, each scored 0–100. Each bar is that input's sub-score; the figure is the points it added to the 100-point composite (weight × sub-score).
- ARV discount +9.7/15.0
- Cash flow +9.0/30.0
- Schools +4.1/10.0
- Livability +3.7/5.0
- 1% rule +3.6/10.0
- DSCR +2.5/10.0
- Condition / age +2.5/5.0
- Rent growth +2.4/5.0
- Appreciation +0.0/10.0
$230,000
🖨 Deal sheet 📄 Offer letter ✓ Due diligence
Listing remarks MLS
Welcome to 11422 Log Cabin Lane, a well-maintained 3-bedroom, 2.5-bath home offering nearly 1,950 sq. ft. of living space in the desirable Northern Point community. Built in 2005, this two-story residence features an open and functional layout with bright interiors designed for comfort and convenience. The spacious backyard is perfect for gatherings and outdoor enjoyment. Located in sought-after Klein ISD, this home offers easy access to nearby shopping, dining, and major highways, making it ideal for both commuters and families. With its combination of thoughtful design, solid construction, and prime location, this property is a fantastic opportunity in Tomball. Schedule your showing today!
Key facts
- Spacious backyard
- Klein isd
- 4,399 sq ft lot
Tags
Neighborhood map
What this means for you Summary
Snapshot
- This is a 3-bed/2.5-bath single-family listed at $230k.
Deal economics
- At list price, monthly cash flow is $-181 ($-2k/yr) — negative.
- To cash-flow at today's rent, offer at most $198k (13.9% below list).
- To meet the 1% rule (rent ≥ 1% of price), the offer needs to be $198k (13.7% below list).
- Recommended offer: $198k (13.9% below list) — sets the bar for cash-flow.
- Cap rate 5.4% vs local median 3.2% in Houston — top-decile yield for the area; either an underpriced asset or a hidden risk that comps aren't pricing in. Stress-test before assuming the spread holds.
Location & tenants
- Location reads 74/100 on livability (#184 in TX, #4,771 nationally) — a middle-class / working-renter tenant base. Strengths: amenities A+, cost of living A+, housing A+; Watch: schools D, crime F.
- Klein ISD (suburban): math 41% / reading 48% proficiency, ranked #213 of 826 in TX (top 26%) — families likely to look elsewhere, expect single-tenant / working-renter base with shorter leases.
- Market conditions: Rents soft (-0.5%/yr); 654 active listings in the ZIP; 12 comparable units currently listed for rent nearby; rentals at typical pace (median 17d on market — plan ~3-4 weeks tenant-placement turnaround); solid renter incomes; 29,883 units permitted in Harris County in 2024 (8,621 in 5+ unit buildings).
Forward outlook
- Local home prices are declining (-3.0%/yr); year-one equity from $2k of loan paydown is wiped out by about $7k of value loss. Plan a longer hold.
- Harris County population projected at +47% by 2050 — long-run rental-demand tailwind backs the buy-and-hold thesis.
Negotiation context
- It's been on market 31 days — a 3% lower offer ($223k) is reasonable based on typical stale-listing flexibility.
- 5 sale attempts since 12y ago with the ask held roughly flat each time — persistent listings suggest the price (not the market) is what's stuck; bring a comps-based counter.
Risks & watch-outs
- Climate carrying-cost: severe wind risk, 99% chance of damaging wind over 30y; extreme-heat days projected 7→23/yr by 2055 (HVAC capex compounding) — expect insurance premiums to compound above CPI over the hold.
Questions for the listing agent
- What do current leases actually rent for vs. the listed asking? Can we see a recent rent roll and the last 12 months of T-12 income?
- It's been on market 31 days. Have you received any prior offers? Is the seller open to a 14% concession, seller financing, or rate buy-down credit?
- What does the HOA fee cover, when was the last increase, and are there any pending special assessments or reserve-fund shortfalls?
- Is there a deadline driving the sale (1031 exchange, divorce, estate, relocation)? That informs how much negotiation room exists.
- Schools are D-rated, which usually means shorter tenancies and higher turnover. Who's the typical renter profile here, and what's been the actual vacancy rate?
- Crime grade is F in this area — have there been break-ins, vandalism, or insurance claims at this property in the last 3 years? What carrier currently insures it and at what premium?
- The area grade is low — what's the realistic commute time and amenity access for the typical tenant pool here? Any planned neighborhood developments (good or bad) we should know about?
- What's the average days-on-market for RENTAL listings here right now (not sales)? A rising rental-DOM trend means longer vacancies and softer asking-rent achievability than the comps imply.
- What's the recent tenant-quality profile in this submarket — average credit score on applications, eviction rate, late-payment / NSF rate, and stable-employment percentage? A property-management company in the area should have these aggregated.
- How much new for-sale + rental construction is in the pipeline within 1–3 miles? Heavy new supply typically softens prices + rents 12–24 months out; constrained supply supports both.
Investment metrics
- 1% rule
- 0.86% ✗
- Cap rate
- 5.35%
- Cash-on-cash
- -3.37%
- DSCR
- 0.85
- GRM
- 9.7
CMA / ARV
- ARV (median comp)
- $241,797
- List price
- $230,000
- Delta
- -0.74%
- Verdict
- FAIR
- Comps
- 20 within 1.0 mi
Show comp detail 12 sales within ~0.75 mi
| Address | Dist | Beds/Ba | Sqft | Sold | Price | $/sf | Match |
|---|---|---|---|---|---|---|---|
| 19718 Moose Cove Ct | 0.26mi | 3/2.0 | 1,670 (+2%) | 0mo | $249,900 | $150 | 81 |
| 11338 Log Cabin Ln | 0.06mi | 3/2.5 | 1,480 (-9%) | 2mo | $240,000 | $162 | 80 |
| 19815 Rocky Shores Dr | 0.42mi | 3/2.0 | 1,677 (+3%) | 1mo | $260,000 | $155 | 73 |
| 11714 Sunny Stream Dr | 0.37mi | 4/2.5 (+1) | 1,678 (+3%) | 2mo | $239,900 | $143 | 71 |
| 11202 Log Cabin Ln | 0.13mi | 3/2.0 | 1,440 (-12%) | 2mo | $230,000 | $160 | 71 |
| 19235 Tannach Dr | 0.51mi | 4/2.5 (+1) | 1,628 (-0%) | 0mo | $295,000 | $181 | 71 |
| 11311 Dahlia Dale Dr | 0.17mi | 3/2.0 | 1,804 (+11%) | 2mo | $279,800 | $155 | 70 |
| 19714 Moose Cove Ct | 0.26mi | 4/2.0 (+1) | 1,757 (+8%) | 1mo | $245,000 | $139 | 67 |
| 11214 Kingsnorth Dr | 0.32mi | 3/2.0 | 1,390 (-15%) | 2mo | $275,000 | $198 | 57 |
| 11942 Sonora Springs Dr | 0.63mi | 3/2.0 | 1,745 (+7%) | 1mo | $255,000 | $146 | 56 |
| 19118 Avalon Springs Dr | 0.60mi | 4/2.0 (+1) | 1,775 (+9%) | 2mo | $249,000 | $140 | 48 |
| 19727 Village Ridge Dr | 0.66mi | 3/2.0 | 1,854 (+14%) | 3mo | $271,500 | $146 | 42 |
Match score weights: distance 35% · size 25% · config 20% · recency 20%. Top-matched comps best support the ARV.
Projected returns pro-forma
-3.0% appreciation · 0.0% rent growth · sell at horizon
- IRR
- -25.7%
- Equity multiple
- 0.15×
- Total profit
- $-54,467
- Equity at exit
- $34,294
- IRR
- -37.8%
- Equity multiple
- -0.31×
- Total profit
- $-84,205
- Equity at exit
- $19,886
Cash invested: $64,400 (down + closing). Projections, not guarantees.
Landlord ↔ Tenant lean methodology
- Overall (STATE)
- 87 Strongly Landlord-Friendly
- State Texas
- 87 Strongly Landlord-Friendly · R+5
- County
- — inherits STATE
- City
- — inherits STATE
ZIP-level market 77375
- Home prices YoY
- -33.9%
- Rents YoY
- -0.5%
- Active inventory
- 654
- Price-to-rent
- 9.7×
Monthly cashflow live
- Estimated rent
- $1,985 high interval (Pro) →
- Mortgage (P&I)
- −$1,206
- Tax from tax record
- −$414 /mo · $4,963/yr
- Insurance
- −$96
- HOA
- −$33
- Vacancy / Maint / Mgmt
- −$417
- Net cashflow
- $-181
Break-even live
UW: 25.0% down · 7.5% · 30yr · 1.5% tax · 5.0% vac · 8.0% maint · 8.0% mgmt
Financing live
Cash to close
- Down payment
- $57,500
- Closing costs
- $6,900
- Reserves months
- —
- Total cash needed
- —
Loan-product check · same deal, 3 products live
Conventional
25% down · 7.5% · 30yr
- Down + closing
- —
- Monthly P&I
- —
- Monthly cashflow
- —
- DSCR
- —
- Eligible?
- —
Personal DTI + credit; lowest rate.
DSCR
20% down · 8.5% · 30yr
- Down + closing
- —
- Monthly P&I
- —
- Monthly cashflow
- —
- DSCR
- —
- Eligible?
- —
No personal income docs; deal must DSCR.
Hard money
10% down · 12.0% · 12mo
- Down + closing
- —
- Monthly P&I
- —
- Monthly cashflow
- —
- DSCR
- —
- Eligible?
- —
Short-term bridge; refi at stabilization.
Rent comps 12 comps
| Address | Beds | Baths | Sqft | Rent | $/sqft | DOM | Units | Dist |
|---|---|---|---|---|---|---|---|---|
| 19414 Ambrosia Falls Dr Tomball, TX | 3.0 | 2.0 | 1344 | $1,695 | $1.26 | 24d | 1 | 0.25mi |
| 11114 Kingsnorth Dr Tomball, TX | 3.0 | 2.0 | 1620 | $1,869 | $1.15 | 7d | 1 | 0.31mi |
| 19418 Sandy Woods Dr Tomball, TX | 4.0 | 2.5 | 2000 | $2,000 | $1.00 | 24d | 1 | 0.35mi |
| 11811 Sunny Stream Dr Tomball, TX | 3.0 | 2.5 | 1740 | $1,785 | $1.03 | 43d | 1 | 0.45mi |
| 11706 Sardis Lake Dr Unit 1570350P Tomball, TX | 3.0 | 2.0 | 1194 | $5,540 | $4.64 | 1d | 1 | 0.49mi |
| 11810 Rolling Stream Dr Tomball, TX | 3.0 | 2.5 | 1590 | $1,700 | $1.07 | 16d | 1 | 0.49mi |
| 11411 Edmond Thorpe Ln Tomball, TX | 3.0 | 2.0 | 1347 | $2,750 | $2.04 | 43d | 1 | 0.55mi |
| 10921 Boudreaux Rd Tomball, TX | 1.0–3.0 | 1.0–2.0 | 1088 | $1,980 | $1.82 | 2d | 42 | 0.66mi |
| 11201 Boudreaux Cir Tomball, TX | 1.0–3.0 | 1.0–2.0 | 1069 | $1,799 | $1.68 | 43d | 1 | 0.66mi |
| 11743 Northpointe Blvd Tomball, TX | 1.0–2.0 | 1.0–2.0 | 986 | $1,699 | $1.72 | 1d | 19 | 1.32mi |
| 11740 Northpointe Blvd Tomball, TX | 1.0–3.0 | 1.0–2.0 | 1198 | $2,423 | $2.02 | 1d | 17 | 1.42mi |
| 18315 Westlock St Tomball, TX | 3.0 | 2.0 | 1137 | $1,700 | $1.50 | 16d | 1 | 1.45mi |
HOA detail
- Monthly dues
- $33 · $396/yr
Listing history 31 events
-
2026-06-18days on market $230,000 Active 31 DOM
-
2026-06-17days on market $230,000 Active 30 DOM
-
2026-06-16days on market $230,000 Active 29 DOM
-
2026-06-15days on market $230,000 Active 28 DOM
-
2026-06-13pricedays on market $230,000 Active 26 DOM
-
2026-06-09days on market $235,000 Active 22 DOM
-
2026-06-08days on market $235,000 Active 21 DOM
-
2026-06-07days on market $235,000 Active 20 DOM
-
2026-06-04days on market $235,000 Active 17 DOM
-
2026-06-03days on market $235,000 Active 16 DOM
-
2026-06-02days on market $235,000 Active 15 DOM
-
2026-06-01days on market $235,000 Active 14 DOM
-
2026-05-31days on market $235,000 Active 13 DOM
-
2026-05-18$235,000 Active 700-char remark
Show marketing remark (700 chars)
Welcome to 11422 Log Cabin Lane, a well-maintained 3-bedroom, 2.5-bath home offering nearly 1,950 sq. ft. of living space in the desirable Northern Point community. Built in 2005, this two-story residence features an open and functional layout with bright interiors designed for comfort and convenience. The spacious backyard is perfect for gatherings and outdoor enjoyment. Located in sought-after Klein ISD, this home offers easy access to nearby shopping, dining, and major highways, making it ideal for both commuters and families. With its combination of thoughtful design, solid construction, and prime location, this property is a fantastic opportunity in Tomball. Schedule your showing today!
-
2026-05-18historical
Show marketing remark (700 chars)
Welcome to 11422 Log Cabin Lane, a well-maintained 3-bedroom, 2.5-bath home offering nearly 1,950 sq. ft. of living space in the desirable Northern Point community. Built in 2005, this two-story residence features an open and functional layout with bright interiors designed for comfort and convenience. The spacious backyard is perfect for gatherings and outdoor enjoyment. Located in sought-after Klein ISD, this home offers easy access to nearby shopping, dining, and major highways, making it ideal for both commuters and families. With its combination of thoughtful design, solid construction, and prime location, this property is a fantastic opportunity in Tomball. Schedule your showing today!
-
2026-04-20price $240,000
-
2026-01-19price $245,000
-
2025-12-08price $247,500
-
2025-11-07price $251,800
-
2025-10-17price $255,000
-
2025-10-02$259,900 Active
-
2023-11-07historical $1,695
-
2023-09-24$1,695
-
2014-09-15soldstatus
-
2014-09-12status Pending
-
2014-09-12soldstatus Sold
-
2014-09-09status Pending, Continue to Show
-
2014-08-25status Option Pending
-
2014-08-14$127,000 Active
-
2014-08-06historical
-
2014-06-27$135,000 Active
ⓘ Source: listings_history table (triggers on properties + properties_extension) + one-shot
backfill from property_details.listing_events for pre-trigger history.
Tax reassessment forecast TX · Resets to sale price
- Current annual tax
- $4,963 · $414/mo
- Projected year-2 tax
- $4,963 · $414/mo
- Expected delta
- $0/yr ($0/mo · 0.0%)
ⓘ Screening estimate from a state-policy table — verify with the county assessor before closing.
Climate risk First Street
- Flood 1/10 Low FEMA zone X (unshaded) · 0% chance over 30 yrs
- Wildfire 4/10 Moderate
- Heat 9/10 Extreme 7 d/yr ≥110°F today · 23 d/yr by 30 yrs out
- Wind 8/10 Severe 99% chance of damaging wind over 30 yrs
- Air quality 3/10 Moderate 2 unhealthy d/yr today · 3 by 30 yrs out
Nearby sold comps map
Loading sold comps map…
Walkable amenities ~0.75 mi
Loading nearby amenities…
Taxation est. · year 1
- Rental income
- $23,815
- − Mortgage interest
- −$12,884
- − Property taxes
- −$4,963
- − Insurance
- −$1,150
- − Repairs & maintenance
- −$1,905
- − Management
- −$1,905
- − HOA
- −$396
- − Depreciation
- −$6,691
- Taxable loss
- −$6,078
- Est. tax savings @ 24.0%
- +$1,459
- After-tax cash flow
- $-710/yr
For passive investors: Depreciation is non-cash, so a rental often shows a tax loss while cash-flowing — sheltering income. Rental losses are passive: they offset passive income freely, and up to $25,000/yr can offset ordinary (W-2) income if you actively participate and your MAGI is under $100k (phasing out to $0 by $150k); unused losses carry forward. On sale, claimed depreciation is recaptured at up to 25%, and gains may owe capital-gains tax (a 1031 exchange can defer both). Figures are a year-1 estimate at your 24.0% rate — not tax advice; consult a CPA.
Schools (NCES district)
- District
- Klein ISD
- NCES district ID
- 4825740
- Math proficiency
- 41% ▼ -12.00%
- Reading proficiency
- 48% ▼ -3.00%
- Median HH income
- $78,288
- Composite
- 40.91/100
- National rank
- #3615
- State rank
- #213 of 826 in TX
Livability — Houston
- Score
- 74/100
- State rank
- #184
- US rank
- #4771
Category grades
Schools grade is shown separately in the Schools card above.
Census & demographics
- County
- Harris County · 4,702,590 people
- City population
- 3,226,434
- Metro
- Houston-The Woodlands-Sugar Land, TX
- Population (ZIP)
- 72,311
- Household income
- $102,488
- Rent vs Own
- Severe rent burden
- 1803.0
Population outlook (Harris County) Hauer SSP2
- Today (2025)
- 5,571,493 people
- By 2030
- 6,089,821 · +9.3%
- By 2040
- 7,142,806 · +28.2%
- By 2050
- 8,185,864 · +46.9%
- By 2075
- 10,574,329 · +89.8%
- By 2100
- 12,109,958 · +117.4%
Race, ethnicity, and origin ACS 2023
- Neighborhood character
- Diverse neighborhood (Simpson 0.65)
- Race & ethnicity
- White 48% Hispanic / Latino 33% Two or more races 13% Black 10% Asian 6% Native American 2%
- Hispanic origin (detail)
- Mexican 23%
- Common ancestry
- Italian 2% Lithuanian 2% Slovak 2%
- Foreign-born
- 17% · Canada, Vietnam, Jamaica
- Languages at home
- 72% English-only · Spanish 22% Other Indo-European 2% Vietnamese 2%
Political lean MEDSL · Harris
- 2024 margin
- Lean D (+5.5) · D 52.0% · R 46.4% · Other 1.6%
- 2008→2024 swing
- +3.9pp toward D · 2008: 1.6pp · 2024: 5.5pp
- All cycles
- 2024: D+5.5 2020: D+13.3 2016: D+12.4 2012: D+0.1 2008: D+1.6
Not yet ingested
- Civics
- —
Market trends
- HPI YoY
- ▼ -119.81%
- Current HPI
- 233.6155
- Rent YoY
- ▼ -0.49%
- Metro
- Houston-The Woodlands-Sugar Land, TX
- State GDP YoY
- ▲ 3.95%
- F500 in state
- 110
Industry mix (Fortune 500 HQ in TX)
| Industry | F500 HQs | Revenue |
|---|---|---|
| Energy | 16 | $1,198B |
|
||
| Technology | 5 | $198B |
|
||
| Engineering / Construction | 4 | $72B |
|
||
| Energy Services | 3 | $60B |
|
||
| Utilities | 3 | $41B |
|
||
| Healthcare | 2 | $330B |
|
||
Price history
+74.1% since first listed18 events — show timeline
- 2026-05-18 Listing Removed — HARMLS
- 2026-05-18 Listed $235,000 HARMLS
- 2026-04-20 Price Changed $240,000 HARMLS
- 2026-01-19 Price Changed $245,000 HARMLS
- 2025-12-08 Price Changed $247,500 HARMLS
- 2025-11-07 Price Changed $251,800 HARMLS
- 2025-10-17 Price Changed $255,000 HARMLS
- 2025-10-02 Listed $259,900 HARMLS
- 2023-11-07 Rental Removed $1,695 RENT.
- 2023-09-24 Listed for Rent $1,695 RENT.
- 2014-09-15 Sold (Public Records) — Public Records
- 2014-09-12 Pending — HARMLS
- 2014-09-12 Sold (MLS) — HARMLS
- 2014-09-09 Pending — HARMLS
- 2014-08-25 Pending — HARMLS
- 2014-08-14 Listed $127,000 HARMLS
- 2014-08-06 Listing Removed — HARMLS
- 2014-06-27 Listed $135,000 HARMLS
Property tax history
+6.4%/yrLatest (2025): $4,963 · +2.6% YoY. Source: county tax records.
Cash-flow waterfall
monthlySold comps — $/sqft
last 12 mo · ≤1 miLoading sold comps…