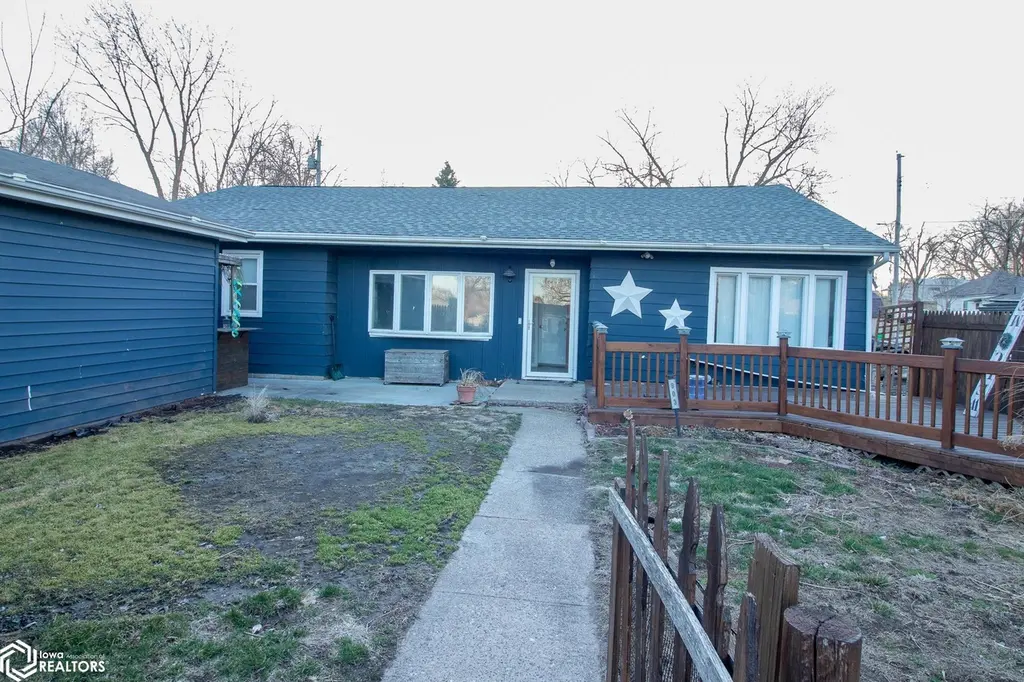
903 S Milner St · Ottumwa, IA
Flood risk 1/10 · Minimal
- FEMA flood zone
- X (unshaded)
- Chance of flooding over 30 yrs
- 0.0%
- Est. flood insurance / yr
- $473 – $860
Fire risk 4/10 · Minor
- Est. fire insurance / yr
- $902 – $1,676
Heat risk 3/10 · Minor
- Hot days now (above 106°F)
- 7 days/yr
- Hot days in 30 yrs
- 15 days/yr
Wind risk 2/10 · Minimal
- Chance of severe wind over 30 yrs
- —
Air-quality risk 2/10 · Minimal
- Unhealthy air days now
- 1 days/yr
- Unhealthy air days in 30 yrs
- 1 days/yr
Risk factors via First Street. Map © Google.
Why this score? — see what drove the B+ grade
The composite is a weighted blend of 9 inputs, each scored 0–100. Each bar is that input's sub-score; the figure is the points it added to the 100-point composite (weight × sub-score).
- Cash flow +30.0/30.0
- ARV discount +15.0/15.0
- DSCR +10.0/10.0
- 1% rule +8.7/10.0
- Schools +4.3/10.0
- Livability +4.0/5.0
- Rent growth +2.5/5.0
- Condition / age +2.5/5.0
- Appreciation +0.0/10.0
$105,000
🖨 Deal sheet (PDF) 📄 Offer letter ✓ Due diligence
Listing remarks MLS
Check out this 3-bedroom ranch on the south side of Ottumwa! Inside you'll find a nice sized living room with plenty of space to gather, plus a newly remodeled bonus living area that could serve as a family room, office, or playroom. The home also features two full bathrooms and a detached garage. A great opportunity to make it your own.
Key facts
- Detached garage
- 1,742 sq ft lot
- Garage
Tags
Neighborhood map
What this means for you Summary
Snapshot
- This is a 3-bed/2.0-bath single-family listed at $105k.
Deal economics
- At list price, monthly cash flow is $439 ($5k/yr) — positive.
- The deal already cash-flows at list — no discount required.
- Meets the 1% rule at list price ($1k rent vs $105k).
- Recommended offer: $96k (9.0% below list) — sets the bar for market timing.
- Cap rate 11.3% vs local median 5.8% in Ottumwa — top-decile yield for the area; either an underpriced asset or a hidden risk that comps aren't pricing in. Stress-test before assuming the spread holds.
Location & tenants
- Location reads 80/100 on livability (#91 in IA, #1,900 nationally) — a professional / high-income tenant draw. Strengths: cost of living A+, housing A+, health & safety A+; Watch: crime D-, employment D-.
- Ottumwa Community School District (town): math 50% / reading 54% proficiency, ranked #277 of 289 in IA (top 96%) — acceptable for families but not a draw, mixed tenant base, ~2y average lease.
- Market conditions: 192 active listings in the ZIP; 44 units permitted in Wapello County in 2024 (0 in 5+ unit buildings).
Forward outlook
- Local home prices are declining (-3.0%/yr); year-one equity from $726 of loan paydown is wiped out by about $3k of value loss. Plan a longer hold.
- Wapello County population projected at +5% by 2050 — modest demand growth; plan on rents tracking national, not racing it.
- At projected returns (-3.0% appreciation + 3.0% rent growth), your $29k cash investment doubles in ~7 years — after that, you're playing with house money.
Negotiation context
- It's been on market 99 days — a 9% lower offer ($96k) is reasonable based on typical stale-listing flexibility.
Risks & watch-outs
- Watch-outs: built in 1939 — expect roof / HVAC / electrical / plumbing capex.
Questions for the listing agent
- It's been on market 99 days. Have you received any prior offers? Is the seller open to a 9% concession, seller financing, or rate buy-down credit?
- Built in 1939 — when were the roof, HVAC, electrical panel, plumbing, and water heater last replaced?
- Why hasn't it sold? Are there any deal-killer items the seller is aware of (foundation, flood, title, zoning, code violations)?
- Is there a deadline driving the sale (1031 exchange, divorce, estate, relocation)? That informs how much negotiation room exists.
- Crime grade is D in this area — have there been break-ins, vandalism, or insurance claims at this property in the last 3 years? What carrier currently insures it and at what premium?
- What's the average days-on-market for RENTAL listings here right now (not sales)? A rising rental-DOM trend means longer vacancies and softer asking-rent achievability than the comps imply.
- What's the recent tenant-quality profile in this submarket — average credit score on applications, eviction rate, late-payment / NSF rate, and stable-employment percentage? A property-management company in the area should have these aggregated.
- How much new for-sale + rental construction is in the pipeline within 1–3 miles? Heavy new supply typically softens prices + rents 12–24 months out; constrained supply supports both.
Investment metrics
- 1% rule
- 1.37% ✓
- Cap rate
- 11.31%
- Cash-on-cash
- 17.92%
- DSCR
- 1.80
- GRM
- 6.1
CMA / ARV
- ARV (median comp)
- $160,151
- List price
- $105,000
- Delta
- -34.44%
- Verdict
- UNDERPRICED
- Comps
- 20 within 1.0 mi
Show comp detail 10 sales within ~0.75 mi
| Address | Dist | Beds/Ba | Sqft | Sold | Price | $/sf | Match |
|---|---|---|---|---|---|---|---|
| 534 S Ferry St | 0.41mi | 3/2.0 | 1,514 (-10%) | 9mo | $160,000 | $106 | 56 |
| 502 Lewis St | 0.24mi | 3/2.0 | 1,875 (+11%) | 21mo | $190,000 | $101 | 54 |
| 426 W Wilson St | 0.67mi | 3/2.0 | 1,680 (-1%) | 17mo | $122,000 | $73 | 53 |
| 421 & 433 S Ferry | 0.54mi | 3/2.0 | 1,765 (+4%) | 18mo | $247,000 | $140 | 52 |
| 227 W Williams St | 0.57mi | 4/2.0 (+1) | 1,714 (+1%) | 19mo | $135,000 | $79 | 51 |
| 513 S Ransom St | 0.43mi | 2/1.0 (-1) | 1,568 (-7%) | 11mo | $125,000 | $80 | 50 |
| 221 S Ward St | 0.70mi | 4/1.0 (+1) | 1,745 (+3%) | 13mo | $110,000 | $63 | 43 |
| 203 S Milner St | 0.65mi | 4/3.5 (+1) | 1,732 (+2%) | 20mo | $128,750 | $74 | 38 |
| 945 W Williams St | 0.66mi | 2/1.0 (-1) | 1,475 (-13%) | 10mo | $140,000 | $95 | 31 |
| 406 S Willard St | 0.49mi | 4/1.0 (+1) | 1,463 (-14%) | 19mo | $101,000 | $69 | 30 |
Match score weights: distance 35% · size 25% · config 20% · recency 20%. Top-matched comps best support the ARV.
Projected returns pro-forma
-3.0% appreciation · 3.0% rent growth · sell at horizon
- IRR
- 9.5%
- Equity multiple
- 1.37×
- Total profit
- $10,959
- Equity at exit
- $15,656
- IRR
- 18.6%
- Equity multiple
- 2.55×
- Total profit
- $45,582
- Equity at exit
- $9,078
Cash invested: $29,400 (down + closing). Projections, not guarantees.
Landlord ↔ Tenant lean methodology
- Overall (STATE)
- 83 Strongly Landlord-Friendly
- State Iowa
- 83 Strongly Landlord-Friendly · R+6
- County
- — inherits STATE
- City
- — inherits STATE
ZIP-level market 52501
- Active inventory
- 192
- Price-to-rent
- 6.1×
Monthly cashflow live
- Estimated rent
- $1,443 medium interval (Pro) →
- Mortgage (P&I)
- −$551
- Tax from tax record
- −$107 /mo · $1,280/yr
- Insurance
- −$44
- HOA
- −$0
- Vacancy / Maint / Mgmt
- −$303
- Net cashflow
- $439
Break-even live
Sensitivity live
| Price | -10% $499 | -5% $469 | +0% $439 | +5% $409 | +10% $380 |
|---|---|---|---|---|---|
| Rent | -10% $325 | -5% $382 | +0% $439 | +5% $496 | +10% $553 |
| Rate | -1.0pp $492 | -0.5pp $466 | base $439 | +0.5pp $412 | +1.0pp $384 |
UW: 25.0% down · 7.5% · 30yr · 1.5% tax · 5.0% vac · 8.0% maint · 8.0% mgmt
Financing live
Cash to close
- Down payment
- $26,250
- Closing costs
- $3,150
- Reserves months
- —
- Total cash needed
- —
Loan-product check · same deal, 3 products live
Conventional
25% down · 7.5% · 30yr
- Down + closing
- —
- Monthly P&I
- —
- Monthly cashflow
- —
- DSCR
- —
- Eligible?
- —
Personal DTI + credit; lowest rate.
DSCR
20% down · 8.5% · 30yr
- Down + closing
- —
- Monthly P&I
- —
- Monthly cashflow
- —
- DSCR
- —
- Eligible?
- —
No personal income docs; deal must DSCR.
Hard money
10% down · 12.0% · 12mo
- Down + closing
- —
- Monthly P&I
- —
- Monthly cashflow
- —
- DSCR
- —
- Eligible?
- —
Short-term bridge; refi at stabilization.
Listing history 18 events
-
2026-06-21days on market $105,000 Active 99 DOM
-
2026-06-18days on market $105,000 Active 97 DOM
-
2026-06-17days on market $105,000 Active 96 DOM
-
2026-06-16days on market $105,000 Active 95 DOM
-
2026-06-15days on market $105,000 Active 94 DOM
-
2026-06-13days on market $105,000 Active 92 DOM
-
2026-06-12pricedays on market $105,000 Active 91 DOM
-
2026-06-09days on market $110,000 Active 88 DOM
-
2026-06-08days on market $110,000 Active 87 DOM
-
2026-06-07days on market $110,000 Active 86 DOM
-
2026-06-07days on market $110,000 Active 85 DOM
-
2026-06-04days on market $110,000 Active 82 DOM
-
2026-06-02days on market $110,000 Active 81 DOM
-
2026-06-01days on market $110,000 Active 80 DOM
-
2026-05-31days on market $110,000 Active 79 DOM
-
2026-05-31days on market $110,000 Active 78 DOM
-
2026-04-18price $115,000 339-char remark
Show marketing remark (339 chars)
Check out this 3-bedroom ranch on the south side of Ottumwa! Inside you'll find a nice sized living room with plenty of space to gather, plus a newly remodeled bonus living area that could serve as a family room, office, or playroom. The home also features two full bathrooms and a detached garage. A great opportunity to make it your own.
-
2026-03-13$135,000 Active 339-char remark
Show marketing remark (339 chars)
Check out this 3-bedroom ranch on the south side of Ottumwa! Inside you'll find a nice sized living room with plenty of space to gather, plus a newly remodeled bonus living area that could serve as a family room, office, or playroom. The home also features two full bathrooms and a detached garage. A great opportunity to make it your own.
ⓘ Source: listings_history table (triggers on properties + properties_extension) + one-shot
backfill from property_details.listing_events for pre-trigger history.
Tax reassessment forecast IA · Partial reset (capped growth)
- Current annual tax
- $1,280 · $107/mo
- Projected year-2 tax
- $1,464 · $122/mo
- Expected delta
- +$184/yr (+$15/mo · 14.4%)
ⓘ Screening estimate from a state-policy table — verify with the county assessor before closing.
Climate risk First Street
- Flood 1/10 Low FEMA zone X (unshaded) · 0% chance over 30 yrs
- Wildfire 4/10 Moderate
- Heat 3/10 Moderate 7 d/yr ≥106°F today · 15 d/yr by 30 yrs out
- Wind 2/10 Low
- Air quality 2/10 Low 1 unhealthy d/yr today · 1 by 30 yrs out
Nearby sold comps map
Loading sold comps map…
Walkable amenities ~0.75 mi
Loading nearby amenities…
Taxation est. · year 1
- Rental income
- $17,319
- − Mortgage interest
- −$5,882
- − Property taxes
- −$1,280
- − Insurance
- −$525
- − Repairs & maintenance
- −$1,386
- − Management
- −$1,386
- − Depreciation
- −$3,055
- Taxable income
- $3,807
- Est. tax owed @ 24.0%
- −$914
- After-tax cash flow
- $4,356/yr
For passive investors: Depreciation is non-cash, so a rental often shows a tax loss while cash-flowing — sheltering income. Rental losses are passive: they offset passive income freely, and up to $25,000/yr can offset ordinary (W-2) income if you actively participate and your MAGI is under $100k (phasing out to $0 by $150k); unused losses carry forward. On sale, claimed depreciation is recaptured at up to 25%, and gains may owe capital-gains tax (a 1031 exchange can defer both). Figures are a year-1 estimate at your 24.0% rate — not tax advice; consult a CPA.
Schools (NCES district)
- District
- Ottumwa Community School District
- NCES district ID
- 1922110
- Math proficiency
- 50% ▼ -9.00%
- Reading proficiency
- 54% ▲ 1.00%
- Median HH income
- $39,864
- Composite
- 43.46/100
- National rank
- #3004
- State rank
- #277 of 289 in IA
Livability — Ottumwa
- Score
- 80/100
- State rank
- #91
- US rank
- #1900
Category grades
Schools grade is shown separately in the Schools card above.
Census & demographics
- Census place
- Ottumwa, IA
- Population (ZIP)
- 30,341
Population outlook (Wapello County) Hauer SSP2
- Today (2025)
- 35,472 people
- By 2030
- 35,563 · +0.3%
- By 2040
- 36,083 · +1.7%
- By 2050
- 37,287 · +5.1%
- By 2075
- 43,898 · +23.8%
- By 2100
- 52,973 · +49.3%
Race, ethnicity, and origin ACS 2023
- Neighborhood character
- Predominantly White (74%)
- Race & ethnicity
- White 74% Hispanic / Latino 14% Two or more races 7% Black 4% Pacific Islander 2% Asian 2%
- Hispanic origin (detail)
- Mexican 9%
- Common ancestry
- Iranian 4% Italian 1% Slovak 1%
- Foreign-born
- 11% · Canada
- Languages at home
- 84% English-only · Spanish 10% Other Asian/Pacific 3% Tagalog/Filipino 1%
Political lean MEDSL · Wapello
- 2024 margin
- Solid R (+31.4) · D 33.6% · R 65.0% · Other 1.4%
- 2008→2024 swing
- -45.0pp toward R · 2008: 13.5pp · 2024: -31.4pp
- All cycles
- 2024: R+31.4 2020: R+23.6 2016: R+20.8 2012: D+11.8 2008: D+13.5
Not yet ingested
- Civics
- —
Market trends
- HPI YoY
- ▼ -94.66%
- Current HPI
- 174.6021
- Rent YoY
- —
- Metro
- —
- State GDP YoY
- ▲ 2.48%
- F500 in state
- 4
Industry mix (Fortune 500 HQ in IA)
| Industry | F500 HQs | Revenue |
|---|---|---|
| Financial Services | 1 | $16B |
|
||
| Retail / Convenience | 1 | $15B |
|
||
Price history
-14.8% since first listed2 events — show timeline
- 2026-04-18 Price Changed $115,000 IAR
- 2026-03-13 Listed $135,000 IAR
Property tax history
-2.3%/yrLatest (2025): $1,280 · +5.8% YoY. Source: county tax records.
Cash-flow waterfall
monthlySold comps — $/sqft
last 12 mo · ≤1 miLoading sold comps…