 Duplex
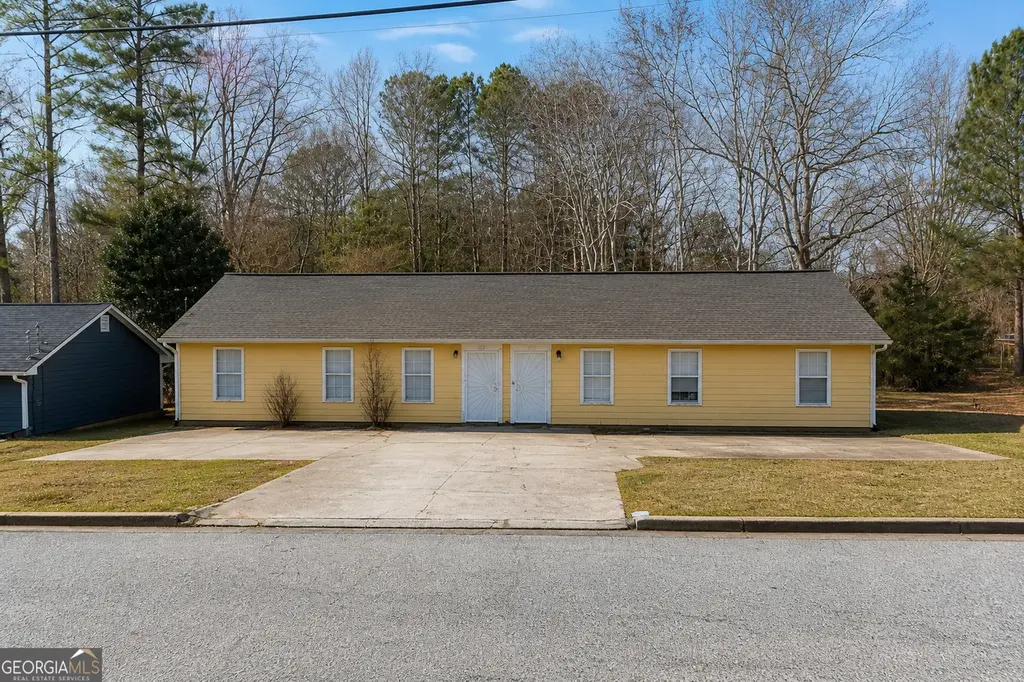
6112 Green Acres Dr · Covington, GA
Flood risk 1/10 · Minimal
- FEMA flood zone
- X (unshaded)
- Chance of flooding over 30 yrs
- 0.0%
- Est. flood insurance / yr
- $507 – $1,088
Fire risk 1/10 · Minimal
- Est. fire insurance / yr
- $963 – $1,789
Heat risk 6/10 · Moderate
- Hot days now (above 106°F)
- 7 days/yr
- Hot days in 30 yrs
- 18 days/yr
Wind risk 5/10 · Moderate
- Chance of severe wind over 30 yrs
- 26.0%
Air-quality risk 4/10 · Minor
- Unhealthy air days now
- 5 days/yr
- Unhealthy air days in 30 yrs
- 6 days/yr
Risk factors via First Street. Map © Google.
Why this score? — see what drove the B- grade
The composite is a weighted blend of 9 inputs, each scored 0–100. Each bar is that input's sub-score; the figure is the points it added to the 100-point composite (weight × sub-score).
- Cash flow +30.0/30.0
- 1% rule +10.0/10.0
- DSCR +10.0/10.0
- ARV discount +7.5/15.0
- Livability +3.0/5.0
- Rent growth +2.6/5.0
- Condition / age +2.5/5.0
- Schools +1.9/10.0
- Appreciation +0.0/10.0
$235,000
🖨 Deal sheet 📄 Offer letter ✓ Due diligence
Multi-family units
County records classify this as Multi-Family (2-4 Unit). Listing-text estimate: 2 units. confirmed
Listing remarks MLS
Calling all investors! This home boasts tile floors, gas and electric availability, private back yard. Property is located walking distance from downtown Covington city with great shopping and fun activities. Sleak upgrades make this place a MUST SEE.
Key facts
- 0.4 acre lot
- Built 1999
- Listed 15 days
Property features AI
Finance
- Financial info: Reported gross income: $26,100
- HOA & community: No homeowners association
Exterior
- Parking: Assigned parking; Parking pad; Open parking available
- Utilities: Public water; Public sewer; Electricity on individual meters; Gas on individual meters; Water on individual meters; Sewer connected
- Home design: Residential income property (duplex); Resale condition; Built in 1999
- Construction: Slab foundation
- Exterior features: Concrete and wood siding exterior; 17424 sq ft lot (0.4 acre)
Interior
- Heating & cooling: Central heating; Central air conditioning
- Interior features: One-level layout; No basement; Two-unit building (duplex)
- Laundry & utility: In-unit laundry
Neighborhood map
What this means for you Summary
Snapshot
- This is a 2 × 3-bed/1-bath units multifamily listed at $235k.
Deal economics
- At list price, monthly cash flow is $1k ($17k/yr) — positive. Per door: $709/mo.
- The deal already cash-flows at list — no discount required.
- Meets the 1% rule at list price ($4k rent vs $235k).
- Recommended offer: $231k (1.5% below list) — sets the bar for market timing.
- Cap rate 13.5% vs local median 3.8% in Covington — top-decile yield for the area; either an underpriced asset or a hidden risk that comps aren't pricing in. Stress-test before assuming the spread holds.
Location & tenants
- Location reads 59/100 on livability (#396 in GA) — a working-class tenant base; expect higher turnover. Strengths: cost of living A+, housing A+, health & safety B+; Watch: crime F, amenities F, commute F.
- Newton County (suburban): math 17% / reading 26% proficiency, ranked #137 of 174 in GA (top 79%) — low school quality limits family demand, transient renter base, plan for 1-2y turnover.
- Zoned schools: Middle Ridge Elementary School (math 17% / reading 17%, grade F, #936 of 1,228 statewide, top 79%, 577 students, 85% FRL); Liberty Middle School (math 7% / reading 15%, grade F, #426 of 470 statewide, top 91%, 944 students, 85% FRL); Eastside High School (math 7% / reading 17%, grade F, #342 of 424 statewide, top 81%, 1,621 students, 46% FRL).
- Market conditions: Rents flat; 479 active listings in the ZIP; 1 comparable units currently listed for rent nearby; 1,480 units permitted in Newton County in 2024 (702 in 5+ unit buildings).
- At $3,725/mo this rent would consume 62% of the median local household income ($72k/yr) (locally 1934% of renters already pay >50% of income on rent) — very limited rent-growth headroom before tenants either downsize or default.
Forward outlook
- Local home prices are declining (-3.0%/yr); year-one equity from $2k of loan paydown is wiped out by about $7k of value loss. Plan a longer hold.
- Newton County population projected at +23% by 2050 — long-run rental-demand tailwind backs the buy-and-hold thesis.
- At projected returns (-3.0% appreciation + 0.5% rent growth), your $66k cash investment doubles in ~6 years — after that, you're playing with house money.
Negotiation context
- It's been on market 16 days — a 2% lower offer ($231k) is reasonable based on typical stale-listing flexibility.
- 5 sale attempts since 4y ago; this cycle's ask is 21760% above the opening price — seller raised mid-cycle; expect resistance to lowballs.
Risks & watch-outs
- Climate carrying-cost: moderate wind risk, 26% chance of damaging wind over 30y; extreme-heat days projected 7→18/yr by 2055 (HVAC capex compounding) — expect insurance premiums to compound above CPI over the hold.
Questions for the listing agent
- Can we see the unit-by-unit rent roll, current vacancy, and any below-market leases? What's the average tenancy length?
- What capital expenditures (roof, boiler, parking lot, exteriors) have been made in the last 5 years, and what's planned in the next 2?
- Is there a deadline driving the sale (1031 exchange, divorce, estate, relocation)? That informs how much negotiation room exists.
- Schools are F-rated, which usually means shorter tenancies and higher turnover. Who's the typical renter profile here, and what's been the actual vacancy rate?
- Crime grade is F in this area — have there been break-ins, vandalism, or insurance claims at this property in the last 3 years? What carrier currently insures it and at what premium?
- What's the average days-on-market for RENTAL listings here right now (not sales)? A rising rental-DOM trend means longer vacancies and softer asking-rent achievability than the comps imply.
- What's the recent tenant-quality profile in this submarket — average credit score on applications, eviction rate, late-payment / NSF rate, and stable-employment percentage? A property-management company in the area should have these aggregated.
- How much new apartment / multifamily construction is in the pipeline within 1–3 miles? Heavy new supply (>2% of stock underway) typically softens rents 12–24 months out; light construction supports rent growth.
Investment metrics
- 1% rule
- 1.59% ✓
- Cap rate
- 13.54%
- Cash-on-cash
- 25.87%
- DSCR
- 2.15
- GRM
- 5.3
CMA / ARV
No comps found within radius.
Projected returns pro-forma
-3.0% appreciation · 0.52% rent growth · sell at horizon
- IRR
- 16.8%
- Equity multiple
- 1.66×
- Total profit
- $43,177
- Equity at exit
- $35,039
- IRR
- 23.5%
- Equity multiple
- 2.80×
- Total profit
- $118,480
- Equity at exit
- $20,319
Cash invested: $65,800 (down + closing). Projections, not guarantees.
Landlord ↔ Tenant lean methodology
- Overall (STATE)
- 90 Strongly Landlord-Friendly
- State Georgia
- 90 Strongly Landlord-Friendly · R+3
- County
- — inherits STATE
- City
- — inherits STATE
ZIP-level market 30014
- Home prices YoY
- -19.2%
- Rents YoY
- 0.5%
- Active inventory
- 479
- Price-to-rent
- 10.5×
Monthly cashflow live
- Estimated rent
- $3,725 high interval (Pro) →
- Mortgage (P&I)
- −$1,232
- Tax from tax record
- −$194 /mo · $2,330/yr
- Insurance
- −$98
- HOA
- −$0
- Vacancy / Maint / Mgmt
- −$782
- Net cashflow
- $1,418
Break-even live
2-unit breakdown (identical units grouped — click to expand)
| Units | Beds | Baths | Est. rent |
|---|---|---|---|
| 2× units | 3 | 1 | $3,726 |
| #1 | 3 | 1 | $1,863 |
| #2 | 3 | 1 | $1,863 |
| Total (2 units) | $3,725 | ||
UW: 25.0% down · 7.5% · 30yr · 1.5% tax · 5.0% vac · 8.0% maint · 8.0% mgmt
Financing live
Cash to close
- Down payment
- $58,750
- Closing costs
- $7,050
- Reserves months
- —
- Total cash needed
- —
Loan-product check · same deal, 3 products live
Conventional
25% down · 7.5% · 30yr
- Down + closing
- —
- Monthly P&I
- —
- Monthly cashflow
- —
- DSCR
- —
- Eligible?
- —
Personal DTI + credit; lowest rate.
DSCR
20% down · 8.5% · 30yr
- Down + closing
- —
- Monthly P&I
- —
- Monthly cashflow
- —
- DSCR
- —
- Eligible?
- —
No personal income docs; deal must DSCR.
Hard money
10% down · 12.0% · 12mo
- Down + closing
- —
- Monthly P&I
- —
- Monthly cashflow
- —
- DSCR
- —
- Eligible?
- —
Short-term bridge; refi at stabilization.
Rent comps 1 comps
| Address | Beds | Baths | Sqft | Rent | $/sqft | DOM | Units | Dist |
|---|---|---|---|---|---|---|---|---|
| 4112 Dorchester Dr SE Covington, GA | 3.0–5.0 | 2.5–4.0 | 2299 | $3,424 | $1.49 | 1d | 1 | 0.62mi |
Listing history 15 events
-
2026-06-18days on market $235,000 Active 16 DOM
-
2026-06-17statusdays on market $235,000 Active 15 DOM
-
2026-06-16days on market $235,000 New 14 DOM
-
2026-06-15days on market $235,000 New 13 DOM
-
2026-06-13days on market $235,000 New 11 DOM
-
2026-06-13days on market $235,000 New 10 DOM
-
2026-06-09days on market $235,000 New 7 DOM
-
2026-06-08days on market $235,000 New 6 DOM
-
2026-06-07days on market $235,000 New 5 DOM
-
2026-06-04days on market $235,000 New 2 DOM
-
2026-06-03statusdays on market $235,000 New 1 DOM
-
2026-06-02days on market $235,000 Coming Soon 3 DOM
-
2026-06-01days on market $235,000 Coming Soon 2 DOM
-
2026-05-31remarks 699-char remark
-
2026-05-31$235,000 Coming Soon 1 DOM
ⓘ Source: listings_history table (triggers on properties + properties_extension) + one-shot
backfill from property_details.listing_events for pre-trigger history.
Tax reassessment forecast GA · Resets to sale price
- Current annual tax
- $2,330 · $194/mo
- Projected year-2 tax
- $2,330 · $194/mo
- Expected delta
- $0/yr ($0/mo · 0.0%)
ⓘ Screening estimate from a state-policy table — verify with the county assessor before closing.
Climate risk First Street
- Flood 1/10 Low FEMA zone X (unshaded) · 0% chance over 30 yrs
- Wildfire 1/10 Low
- Heat 6/10 Major 7 d/yr ≥106°F today · 18 d/yr by 30 yrs out
- Wind 5/10 Major 26% chance of damaging wind over 30 yrs
- Air quality 4/10 Moderate 5 unhealthy d/yr today · 6 by 30 yrs out
Nearby sold comps map
Loading sold comps map…
Walkable amenities ~0.75 mi
Loading nearby amenities…
Taxation est. · year 1
- Rental income
- $44,700
- − Mortgage interest
- −$13,164
- − Property taxes
- −$2,330
- − Insurance
- −$1,175
- − Repairs & maintenance
- −$3,576
- − Management
- −$3,576
- − Depreciation
- −$6,836
- Taxable income
- $14,043
- Est. tax owed @ 24.0%
- −$3,370
- After-tax cash flow
- $13,649/yr
For passive investors: Depreciation is non-cash, so a rental often shows a tax loss while cash-flowing — sheltering income. Rental losses are passive: they offset passive income freely, and up to $25,000/yr can offset ordinary (W-2) income if you actively participate and your MAGI is under $100k (phasing out to $0 by $150k); unused losses carry forward. On sale, claimed depreciation is recaptured at up to 25%, and gains may owe capital-gains tax (a 1031 exchange can defer both). Figures are a year-1 estimate at your 24.0% rate — not tax advice; consult a CPA.
Schools (NCES district)
- District
- Newton County
- NCES district ID
- 1303930
- Math proficiency
- 17% ▼ -13.00%
- Reading proficiency
- 26% ▼ -8.00%
- Median HH income
- $50,768
- Composite
- 19.2/100
- National rank
- #8816
- State rank
- #137 of 174 in GA
Livability — Covington
- Score
- 59/100
- State rank
- #396
- US rank
- #19602
Category grades
Schools grade is shown separately in the Schools card above.
Census & demographics
- Census place
- Covington, GA
- County
- Newton County · 104,393 people
- City population
- 104,393
- Metro
- Atlanta-Sandy Springs-Alpharetta, GA
- Population (ZIP)
- 41,425
- Household income
- $72,254
- Rent vs Own
- Severe rent burden
- 1934.0
Population outlook (Newton County) Hauer SSP2
- Today (2025)
- 118,372 people
- By 2030
- 124,234 · +5.0%
- By 2040
- 135,550 · +14.5%
- By 2050
- 145,309 · +22.8%
- By 2075
- 166,843 · +40.9%
- By 2100
- 175,800 · +48.5%
Race, ethnicity, and origin ACS 2023
- Neighborhood character
- Diverse neighborhood (Simpson 0.59)
- Race & ethnicity
- White 53% Black 35% Hispanic / Latino 7% Two or more races 6% Asian 2%
- Hispanic origin (detail)
- Mexican 3%
- Common ancestry
- Italian 2% Slovak 2% Serbian 1%
- Foreign-born
- 7% · Canada
- Languages at home
- 93% English-only · Spanish 5% Other Indo-European 1%
Political lean MEDSL · Newton
- 2024 margin
- D (+15.1) · D 57.3% · R 42.2%
- 2008→2024 swing
- +14.0pp toward D · 2008: 1.2pp · 2024: 15.1pp
- All cycles
- 2024: D+15.1 2020: D+10.9 2016: D+2.4 2012: D+2.0 2008: D+1.2
Not yet ingested
- Civics
- —
Market trends
- HPI YoY
- ▼ -64.50%
- Current HPI
- 270.9868
- Rent YoY
- ▲ 0.52%
- Metro
- Atlanta-Sandy Springs-Alpharetta, GA
- State GDP YoY
- ▲ 2.66%
- F500 in state
- 28
Industry mix (Fortune 500 HQ in GA)
| Industry | F500 HQs | Revenue |
|---|---|---|
| Paper / Packaging | 2 | $29B |
|
||
| Retail | 1 | $160B |
|
||
| Transportation / Logistics | 1 | $91B |
|
||
| Airlines | 1 | $62B |
|
||
| Consumer Goods | 1 | $47B |
|
||
| Utilities | 1 | $25B |
|
||
Price history
+191.7% since first listed18 events — show timeline
- 2026-05-31 Coming Soon $235,000 GAMLS
- 2023-11-10 Rental Removed $1,075 FMLS
- 2023-10-27 Listed for Rent $1,075 FMLS
- 2022-06-23 Sold (Public Records) $233,000 Public Records
- 2022-06-17 Sold (MLS) $233,000 GAMLS
- 2022-06-17 Sold (MLS) $233,000 FMLS
- 2022-05-14 Contingent — FMLS
- 2022-05-14 Pending — GAMLS
- 2022-05-04 Relisted — FMLS
- 2022-05-04 Relisted — GAMLS
- 2022-05-02 Pending — GAMLS
- 2022-05-02 Contingent — FMLS
- 2022-04-25 Listed $250,000 GAMLS
- 2022-04-25 Listed $250,000 FMLS
- 2006-07-13 Sold (Public Records) $132,700 Public Records
- 2004-10-29 Sold (Public Records) $113,000 Public Records
- 2003-04-29 Sold (Public Records) $121,000 Public Records
- 1999-12-30 Sold (Public Records) $80,560 Public Records
Property tax history
+1.7%/yrLatest (2024): $2,330 · +14.7% YoY. Source: county tax records.
Cash-flow waterfall
monthlySold comps — $/sqft
last 12 mo · ≤1 miLoading sold comps…