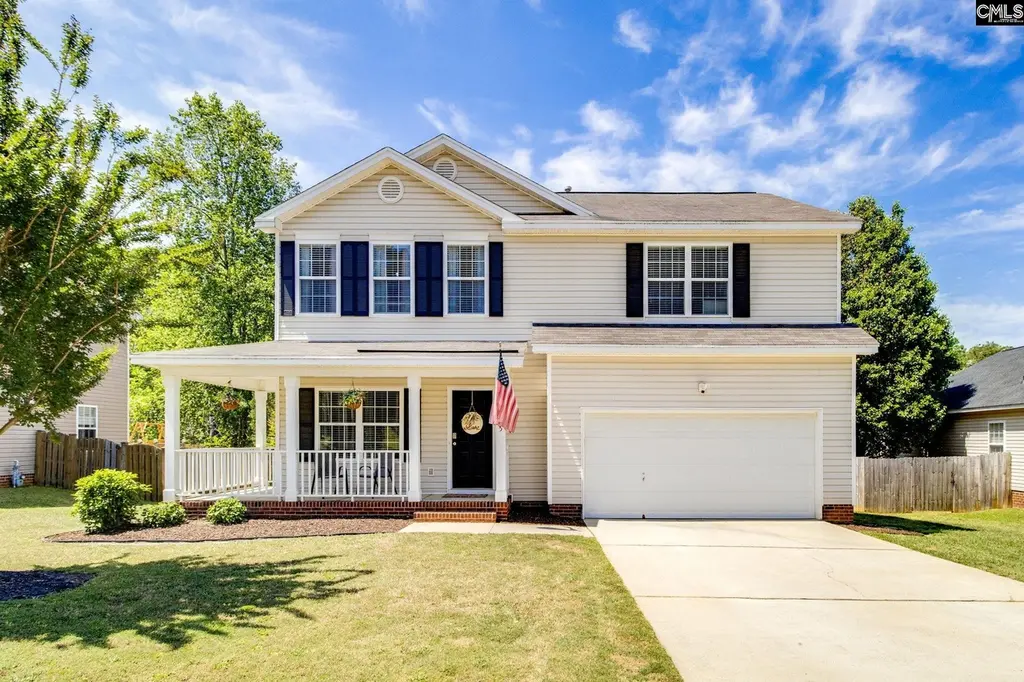
265 Farming Creek Way · Lexington, SC
Flood risk 1/10 · Minimal
- FEMA flood zone
- X (unshaded)
- Chance of flooding over 30 yrs
- 0.0%
- Est. flood insurance / yr
- $507 – $1,088
Fire risk 3/10 · Minor
- Est. fire insurance / yr
- $783 – $1,453
Heat risk 7/10 · Major
- Hot days now (above 106°F)
- 7 days/yr
- Hot days in 30 yrs
- 16 days/yr
Wind risk 6/10 · Moderate
- Chance of severe wind over 30 yrs
- 62.0%
Air-quality risk 3/10 · Minor
- Unhealthy air days now
- 2 days/yr
- Unhealthy air days in 30 yrs
- 2 days/yr
Risk factors via First Street. Map © Google.
Why this score? — see what drove the D- grade
The composite is a weighted blend of 9 inputs, each scored 0–100. Each bar is that input's sub-score; the figure is the points it added to the 100-point composite (weight × sub-score).
- ARV discount +11.7/15.0
- Cash flow +9.1/30.0
- Schools +4.2/10.0
- Livability +4.0/5.0
- Rent growth +3.3/5.0
- DSCR +2.5/10.0
- Condition / age +2.5/5.0
- 1% rule +2.0/10.0
- Appreciation +0.0/10.0
$299,900
🖨 Deal sheet (PDF) 📄 Offer letter ✓ Due diligence
Listing remarks
Welcome to your dream home in the heart of Lexington! This beautiful, turn-key resale features 4 spacious bedrooms and 2.5 bathrooms spread across an open and inviting 2,161 heated square feet. Enjoy a seamless flow between the formal dining room, a cozy living room complete with a warm fireplace, and a spacious kitchen designed for effortless meal prep and entertaining. This home is one of only four properties on the water, perfectly situated on a manicured 0.21-acre lot within the highly desirable Farming Creek subdivision. This two-story home is equipped with a new AC unit and water heater, with the ideal blend of comfort and style. Zoned for Award-Winning Lexington 1 schools! The neighb
Key facts
- Community pool
- Turn-key resale
- Waterfront property
Tags
Property features AI
Finance
- HOA & community: Community has an association
Exterior
- Parking: Attached 2-car garage (main level); Total 2 parking spaces
- Utilities: Public sewer; Public water
- Home design: Two-story home; Main-level garage entry
- Construction: Crawlspace foundation
- Exterior features: Vinyl exterior finish; Paved road access; Public water
Interior
- Kitchen: Wood cabinets; Pantry; Granite and Formica countertops; Luxury vinyl plank flooring in kitchen; Dishwasher; Refrigerator; Microwave (above stove and built-in); Free‑standing smooth surface range
- Bedrooms: Primary suite on second floor with garden tub, private bath, separate shower and walk-in closet; Additional bedrooms on second floor with private closets and carpeted floors
- Flooring: Carpet in bedrooms; Hardwood floors in living and formal dining areas; Luxury vinyl plank in kitchen
- Bathrooms: Two full bathrooms; One half bathroom; Two secondary full bathrooms
- Heating & cooling: Central heat; Central air
- Interior features: Fireplace; Heated space laundry / mud room; One fireplace
- Laundry & utility: Washer included; Laundry located on second floor; Mud room
Neighborhood map
What this means for you Summary
Snapshot
- This is a 4-bed/2.5-bath single-family listed at $300k.
Deal economics
- At list price, monthly cash flow is $-229 ($-3k/yr) — negative.
- To cash-flow at today's rent, offer at most $259k (13.5% below list).
- To meet the 1% rule (rent ≥ 1% of price), the offer needs to be $208k (30.5% below list).
- Recommended offer: $208k (30.5% below list) — sets the bar for 1% rule.
Location & tenants
- Location reads 81/100 on livability (#8 in SC, #1,502 nationally) — a professional / high-income tenant draw. Strengths: housing A+, health & safety A+, employment A; Watch: commute F.
- Lexington 01 (suburban): math 42% / reading 53% proficiency, ranked #11 of 80 in SC (top 14%) — families likely to look elsewhere, expect single-tenant / working-renter base with shorter leases.
- Zoned schools: Lake Murray Elementary (math 73% / reading 70%, grade A-, #32 of 597 statewide, top 5%, 901 students, 12% FRL); Pleasant Hill Middle (math 50% / reading 58%, grade B-, #27 of 229 statewide, top 12%, 748 students, 21% FRL); Lexington High (math 69% / reading 92%, grade A, #23 of 196 statewide, top 11%, 2,410 students, 17% FRL).
- Zoned-school proficiency averages 69% at this address vs 48% district-wide (+21 pts) — the actual schools serving this property are materially stronger than the Lexington 01 average implies; a family-tenant draw the district grade alone would hide.
- Market conditions: Rents rising (+3.2%/yr); 714 active listings in the ZIP; solid renter incomes; 1,712 units permitted in Lexington County in 2024 (0 in 5+ unit buildings).
Forward outlook
- Local home prices are declining (-3.0%/yr); year-one equity from $2k of loan paydown is wiped out by about $9k of value loss. Plan a longer hold.
- Lexington County population projected at +26% by 2050 — long-run rental-demand tailwind backs the buy-and-hold thesis.
Negotiation context
- It's been on market 31 days — a 3% lower offer ($291k) is reasonable based on typical stale-listing flexibility.
- 2 sale attempts since 3y ago with the ask held roughly flat each time — persistent listings suggest the price (not the market) is what's stuck; bring a comps-based counter.
Risks & watch-outs
- Climate carrying-cost: major wind risk, 62% chance of damaging wind over 30y; extreme-heat days projected 7→16/yr by 2055 (HVAC capex compounding) — expect insurance premiums to compound above CPI over the hold.
Questions for the listing agent
- What do current leases actually rent for vs. the listed asking? Can we see a recent rent roll and the last 12 months of T-12 income?
- It's been on market 31 days. Have you received any prior offers? Is the seller open to a 30% concession, seller financing, or rate buy-down credit?
- What does the HOA fee cover, when was the last increase, and are there any pending special assessments or reserve-fund shortfalls?
- Is there a deadline driving the sale (1031 exchange, divorce, estate, relocation)? That informs how much negotiation room exists.
- Schools are B-rated — typically a magnet for longer-tenancy family renters. What's the average tenant stay here, and is there a school-zone premium baked into asking?
- The area grade is low — what's the realistic commute time and amenity access for the typical tenant pool here? Any planned neighborhood developments (good or bad) we should know about?
- What's the average days-on-market for RENTAL listings here right now (not sales)? A rising rental-DOM trend means longer vacancies and softer asking-rent achievability than the comps imply.
- What's the recent tenant-quality profile in this submarket — average credit score on applications, eviction rate, late-payment / NSF rate, and stable-employment percentage? A property-management company in the area should have these aggregated.
- How much new for-sale + rental construction is in the pipeline within 1–3 miles? Heavy new supply typically softens prices + rents 12–24 months out; constrained supply supports both.
Investment metrics
- 1% rule
- 0.70% ✗
- Cap rate
- 5.38%
- Cash-on-cash
- -3.28%
- DSCR
- 0.85
- GRM
- 12.0
CMA / ARV
- ARV (on-the-fly)
- $330,633
- Comps found
- 2
Show comp detail 2 sales within ~0.75 mi
| Address | Dist | Beds/Ba | Sqft | Sold | Price | $/sf | Match |
|---|---|---|---|---|---|---|---|
| 508 Barn Plank Ct | 0.15mi | 4/2.5 | 2,066 (-4%) | 5mo | $315,900 | $153 | 82 |
| 112 Cregar Ct | 0.20mi | 4/2.5 | 2,160 (-0%) | 19mo | $290,000 | $134 | 75 |
Match score weights: distance 35% · size 25% · config 20% · recency 20%. Top-matched comps best support the ARV.
Projected returns pro-forma
-3.0% appreciation · 3.23% rent growth · sell at horizon
- IRR
- -21.6%
- Equity multiple
- 0.25×
- Total profit
- $-62,807
- Equity at exit
- $44,716
- IRR
- -14.9%
- Equity multiple
- 0.14×
- Total profit
- $-71,866
- Equity at exit
- $25,930
Cash invested: $83,972 (down + closing). Projections, not guarantees.
Landlord ↔ Tenant lean methodology
- Overall (STATE)
- 90 Strongly Landlord-Friendly
- State South Carolina
- 90 Strongly Landlord-Friendly · R+6
- County
- — inherits STATE
- City
- — inherits STATE
ZIP-level market 29072
- Rents YoY
- 3.2%
- Active inventory
- 714
- Price-to-rent
- 12.0×
Monthly cashflow live
- Estimated rent
- $2,084 medium interval (Pro) →
- Mortgage (P&I)
- −$1,573
- Tax from tax record
- −$144 /mo · $1,732/yr
- Insurance
- −$125
- HOA
- −$34
- Vacancy / Maint / Mgmt
- −$438
- Net cashflow
- $-229
Break-even live
Sensitivity live
| Price | -10% $-60 | -5% $-144 | +0% $-229 | +5% $-314 | +10% $-399 |
|---|---|---|---|---|---|
| Rent | -10% $-394 | -5% $-312 | +0% $-229 | +5% $-147 | +10% $-65 |
| Rate | -1.0pp $-78 | -0.5pp $-153 | base $-229 | +0.5pp $-307 | +1.0pp $-386 |
UW: 25.0% down · 7.5% · 30yr · 1.5% tax · 5.0% vac · 8.0% maint · 8.0% mgmt
Financing live
Cash to close
- Down payment
- $74,975
- Closing costs
- $8,997
- Reserves months
- —
- Total cash needed
- —
Loan-product check · same deal, 3 products live
Conventional
25% down · 7.5% · 30yr
- Down + closing
- —
- Monthly P&I
- —
- Monthly cashflow
- —
- DSCR
- —
- Eligible?
- —
Personal DTI + credit; lowest rate.
DSCR
20% down · 8.5% · 30yr
- Down + closing
- —
- Monthly P&I
- —
- Monthly cashflow
- —
- DSCR
- —
- Eligible?
- —
No personal income docs; deal must DSCR.
Hard money
10% down · 12.0% · 12mo
- Down + closing
- —
- Monthly P&I
- —
- Monthly cashflow
- —
- DSCR
- —
- Eligible?
- —
Short-term bridge; refi at stabilization.
HOA detail
- Monthly dues
- $34 · $408/yr
- Likely covers
- water
Listing history 21 events
-
2026-06-22days on market $299,900 Active 31 DOM
-
2026-06-18price $299,900 Active 28 DOM
-
2026-06-18days on market $305,000 Active 28 DOM
-
2026-06-17days on market $305,000 Active 27 DOM
-
2026-06-16days on market $305,000 Active 26 DOM
-
2026-06-15days on market $305,000 Active 25 DOM
-
2026-06-14days on market $305,000 Active 23 DOM
-
2026-06-10days on market $305,000 Active 20 DOM
-
2026-06-09days on market $305,000 Active 19 DOM
-
2026-06-08days on market $305,000 Active 18 DOM
-
2026-06-07pricedays on market $305,000 Active 17 DOM
-
2026-06-03days on market $310,000 Active 13 DOM
-
2026-06-03days on market $310,000 Active 12 DOM
-
2026-06-02days on market $310,000 Active 11 DOM
-
2026-05-31days on market $310,000 Active 10 DOM
-
2026-05-21$310,000 Active
-
2023-06-05soldstatus $290,000
-
2023-05-19status Pending
-
2023-05-05historical Active - Contingent
-
2023-04-04$285,000 Active
-
2001-07-19soldstatus $152,000
ⓘ Source: listings_history table (triggers on properties + properties_extension) + one-shot
backfill from property_details.listing_events for pre-trigger history.
Tax reassessment forecast SC · Resets to sale price
- Current annual tax
- $1,732 · $144/mo
- Projected year-2 tax
- $1,732 · $144/mo
- Expected delta
- $0/yr ($0/mo · 0.0%)
ⓘ Screening estimate from a state-policy table — verify with the county assessor before closing.
Climate risk First Street
- Flood 1/10 Low FEMA zone X (unshaded) · 0% chance over 30 yrs
- Wildfire 3/10 Moderate
- Heat 7/10 Severe 7 d/yr ≥106°F today · 16 d/yr by 30 yrs out
- Wind 6/10 Major 62% chance of damaging wind over 30 yrs
- Air quality 3/10 Moderate 2 unhealthy d/yr today · 2 by 30 yrs out
Nearby sold comps map
Loading sold comps map…
Walkable amenities ~0.75 mi
Loading nearby amenities…
Taxation est. · year 1
- Rental income
- $25,013
- − Mortgage interest
- −$16,799
- − Property taxes
- −$1,732
- − Insurance
- −$1,500
- − Repairs & maintenance
- −$2,001
- − Management
- −$2,001
- − HOA
- −$408
- − Depreciation
- −$8,724
- Taxable loss
- −$8,152
- Est. tax savings @ 24.0%
- +$1,956
- After-tax cash flow
- $-795/yr
For passive investors: Depreciation is non-cash, so a rental often shows a tax loss while cash-flowing — sheltering income. Rental losses are passive: they offset passive income freely, and up to $25,000/yr can offset ordinary (W-2) income if you actively participate and your MAGI is under $100k (phasing out to $0 by $150k); unused losses carry forward. On sale, claimed depreciation is recaptured at up to 25%, and gains may owe capital-gains tax (a 1031 exchange can defer both). Figures are a year-1 estimate at your 24.0% rate — not tax advice; consult a CPA.
Schools (NCES district)
- District
- Lexington 01
- NCES district ID
- 4502700
- Math proficiency
- 42% ▼ -12.00%
- Reading proficiency
- 53% ▼ -2.00%
- Median HH income
- $61,298
- Composite
- 41.75/100
- National rank
- #3399
- State rank
- #11 of 80 in SC
Livability — Lexington
- Score
- 81/100
- State rank
- #8
- US rank
- #1502
Category grades
Schools grade is shown separately in the Schools card above.
Census & demographics
- County
- Lexington County · 232,571 people
- City population
- 122,563
- Metro
- Columbia, SC
- Population (ZIP)
- 69,407
- Household income
- $106,382
- Rent vs Own
- Severe rent burden
- 858.0
Population outlook (Lexington County) Hauer SSP2
- Today (2025)
- 322,999 people
- By 2030
- 342,356 · +6.0%
- By 2040
- 377,715 · +16.9%
- By 2050
- 406,984 · +26.0%
- By 2075
- 465,447 · +44.1%
- By 2100
- 485,674 · +50.4%
Race, ethnicity, and origin ACS 2023
- Neighborhood character
- Predominantly White (80%)
- Race & ethnicity
- White 80% Black 7% Hispanic / Latino 5% Two or more races 5% Asian 4%
- Hispanic origin (detail)
- Mexican 1%
- Common ancestry
- Italian 4% Serbian 3% Romanian 3%
- Foreign-born
- 7% · Canada, Jamaica, China
- Languages at home
- 91% English-only · Spanish 4% Other Indo-European 1% Other Asian/Pacific 1%
Political lean MEDSL · Lexington
- 2024 margin
- Solid R (+33.5) · D 32.5% · R 66.0% · Other 1.4%
- 2008→2024 swing
- +4.6pp toward D · 2008: -38.0pp · 2024: -33.5pp
- All cycles
- 2024: R+33.5 2020: R+30.1 2016: R+36.7 2012: R+37.8 2008: R+38.0
Not yet ingested
- Civics
- —
Market trends
- HPI YoY
- ▼ -197.53%
- Current HPI
- 212.3235
- Rent YoY
- ▲ 3.23%
- Metro
- Columbia, SC
- State GDP YoY
- ▲ 4.51%
- F500 in state
- 2
Industry mix (Fortune 500 HQ in SC)
| Industry | F500 HQs | Revenue |
|---|---|---|
| Packaging | 1 | $7B |
|
||
Price history
+103.9% since first listed6 events — show timeline
- 2026-05-21 Listed $310,000 Consolidated MLS
- 2023-06-05 Sold (Public Records) $290,000 Public Records
- 2023-05-19 Pending — Consolidated MLS
- 2023-05-05 Contingent — Consolidated MLS
- 2023-04-04 Listed $285,000 Consolidated MLS
- 2001-07-19 Sold (Public Records) $152,000 Public Records
Property tax history
-5.7%/yrLatest (2024): $1,732 · +63.7% YoY. Source: county tax records.
Cash-flow waterfall
monthlySold comps — $/sqft
last 12 mo · ≤1 miLoading sold comps…