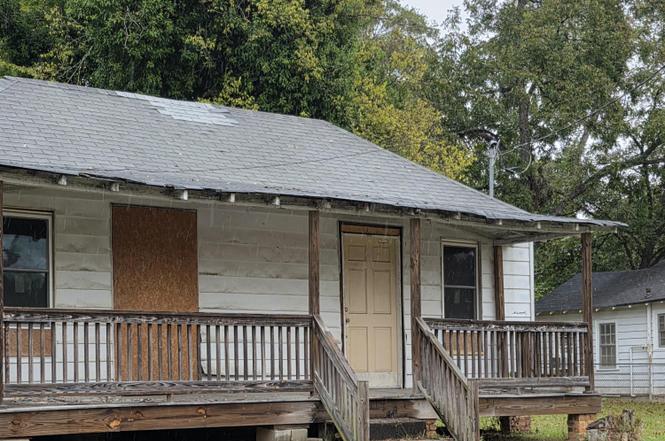
668 Maple St · Orangeburg, SC
Flood risk 1/10 · Minimal
- FEMA flood zone
- X (unshaded)
- Chance of flooding over 30 yrs
- 0.0%
- Est. flood insurance / yr
- $507 – $1,088
Fire risk 4/10 · Minor
- Est. fire insurance / yr
- $783 – $1,453
Heat risk 7/10 · Major
- Hot days now (above 107°F)
- 7 days/yr
- Hot days in 30 yrs
- 17 days/yr
Wind risk 8/10 · Major
- Chance of severe wind over 30 yrs
- 80.0%
Air-quality risk 3/10 · Minor
- Unhealthy air days now
- 3 days/yr
- Unhealthy air days in 30 yrs
- 3 days/yr
Risk factors via First Street. Map © Google.
Why this score? — see what drove the D+ grade
The composite is a weighted blend of 9 inputs, each scored 0–100. Each bar is that input's sub-score; the figure is the points it added to the 100-point composite (weight × sub-score).
- Cash flow +15.0/30.0
- ARV discount +7.5/15.0
- 1% rule +5.0/10.0
- DSCR +5.0/10.0
- Schools +5.0/10.0
- Livability +2.7/5.0
- Rent growth +2.5/5.0
- Condition / age +2.5/5.0
- Appreciation +0.0/10.0
$25,000
🖨 Deal sheet 📄 Offer letter ✓ Due diligence
Listing remarks MLS
Investors - This home is ready for your vision. Home has been re-wired and most new windows. Orangeburg's new growth is looking for nice rentals and this would be ideal location. 10 minutes to I-26 , Amazon and hospital.
Key facts
- 5,227 sq ft lot
- Built 1930
- Listed 222 days
Property features AI
Exterior
- Parking: Off-street parking
- Utilities: Public sewer; Department of Public Utilities service
- Home design: Single-family detached; Residential property; One story; Ground-level entry
- Exterior features: Level lot; Lot size under 0.5 acre; No other structures on property; Fee simple ownership
Interior
- Bedrooms: 1 bedroom
- Bathrooms: 1 bathroom
- Interior features: Ground-level entry; One-level living
Neighborhood map
What this means for you Summary
Snapshot
- This is a 1-bed/1.0-bath single-family listed at $25k.
Deal economics
- At list price, monthly cash flow is $663 ($8k/yr) — positive.
- The deal already cash-flows at list — no discount required.
- Meets the 1% rule at list price ($1k rent vs $25k).
- Recommended offer: $22k (12.0% below list) — sets the bar for market timing.
- Cap rate 38.1% vs local median 4.2% in Orangeburg — top-decile yield for the area; either an underpriced asset or a hidden risk that comps aren't pricing in. Stress-test before assuming the spread holds.
Location & tenants
- Location reads 54/100 on livability (#324 in SC) — a working-class tenant base; expect higher turnover. Strengths: cost of living A+, health & safety B; Watch: housing C-, crime F, amenities D-.
- Zoned schools: Mellichamp Elementary (math 34%, 204 students, 100% FRL); William J. Clark Middle (math 12%, 687 students, 100% FRL); Orangeburg Wilkinson High (math 22%, 1,073 students, 100% FRL).
- Market conditions: 226 active listings in the ZIP; 1 comparable units currently listed for rent nearby; 87 units permitted in Orangeburg County in 2024 (0 in 5+ unit buildings).
Forward outlook
- Local home prices are declining (-3.0%/yr); year-one equity from $173 of loan paydown is wiped out by about $750 of value loss. Plan a longer hold.
- Orangeburg County population projected at -27% by 2050 — secular population decline; favor cash flow + early exit over multi-decade hold.
- At projected returns (-3.0% appreciation + 3.0% rent growth), your $7k cash investment doubles in ~1 year — after that, you're playing with house money.
Negotiation context
- It's been on market 223 days — a 12% lower offer ($22k) is reasonable based on typical stale-listing flexibility.
- 5 sale attempts since 4y ago; this cycle's ask has dropped $3k (11%) from the opening price — seller is motivated, your offer sets the floor, not the list.
Risks & watch-outs
- Watch-outs: property tax is 2.9% of price; built in 1930 — expect roof / HVAC / electrical / plumbing capex.
- Climate carrying-cost: severe wind risk, 80% chance of damaging wind over 30y; extreme-heat days projected 7→17/yr by 2055 (HVAC capex compounding) — expect insurance premiums to compound above CPI over the hold.
Questions for the listing agent
- It's been on market 223 days. Have you received any prior offers? Is the seller open to a 12% concession, seller financing, or rate buy-down credit?
- Built in 1930 — when were the roof, HVAC, electrical panel, plumbing, and water heater last replaced?
- Property tax is high relative to price — has the assessment been appealed recently, and will the sale trigger a re-assessment?
- Why hasn't it sold? Are there any deal-killer items the seller is aware of (foundation, flood, title, zoning, code violations)?
- Is there a deadline driving the sale (1031 exchange, divorce, estate, relocation)? That informs how much negotiation room exists.
- Schools are F-rated, which usually means shorter tenancies and higher turnover. Who's the typical renter profile here, and what's been the actual vacancy rate?
- Crime grade is F in this area — have there been break-ins, vandalism, or insurance claims at this property in the last 3 years? What carrier currently insures it and at what premium?
- The area grade is low — what's the realistic commute time and amenity access for the typical tenant pool here? Any planned neighborhood developments (good or bad) we should know about?
- What's the average days-on-market for RENTAL listings here right now (not sales)? A rising rental-DOM trend means longer vacancies and softer asking-rent achievability than the comps imply.
- What's the recent tenant-quality profile in this submarket — average credit score on applications, eviction rate, late-payment / NSF rate, and stable-employment percentage? A property-management company in the area should have these aggregated.
- How much new for-sale + rental construction is in the pipeline within 1–3 miles? Heavy new supply typically softens prices + rents 12–24 months out; constrained supply supports both.
Investment metrics
- 1% rule
- 4.38% ✓
- Cap rate
- 38.13%
- Cash-on-cash
- 113.69%
- DSCR
- 6.06
- GRM
- 1.9
CMA / ARV
No comps found within radius.
Projected returns pro-forma
-3.0% appreciation · 3.0% rent growth · sell at horizon
- IRR
- —
- Equity multiple
- 6.46×
- Total profit
- $38,223
- Equity at exit
- $3,728
- IRR
- —
- Equity multiple
- 13.54×
- Total profit
- $87,813
- Equity at exit
- $2,162
Cash invested: $7,000 (down + closing). Projections, not guarantees.
Landlord ↔ Tenant lean methodology
- Overall (STATE)
- 90 Strongly Landlord-Friendly
- State South Carolina
- 90 Strongly Landlord-Friendly · R+6
- County
- — inherits STATE
- City
- — inherits STATE
ZIP-level market 29115
- Home prices YoY
- -27.3%
- Active inventory
- 226
- Price-to-rent
- 1.9×
Monthly cashflow live
- Estimated rent
- $1,095 medium interval (Pro) →
- Mortgage (P&I)
- −$131
- Tax from tax record
- −$60 /mo · $724/yr
- Insurance
- −$10
- HOA
- −$0
- Vacancy / Maint / Mgmt
- −$230
- Net cashflow
- $663
Break-even live
UW: 25.0% down · 7.5% · 30yr · 1.5% tax · 5.0% vac · 8.0% maint · 8.0% mgmt
Financing live
Cash to close
- Down payment
- $6,250
- Closing costs
- $750
- Reserves months
- —
- Total cash needed
- —
Loan-product check · same deal, 3 products live
Conventional
25% down · 7.5% · 30yr
- Down + closing
- —
- Monthly P&I
- —
- Monthly cashflow
- —
- DSCR
- —
- Eligible?
- —
Personal DTI + credit; lowest rate.
DSCR
20% down · 8.5% · 30yr
- Down + closing
- —
- Monthly P&I
- —
- Monthly cashflow
- —
- DSCR
- —
- Eligible?
- —
No personal income docs; deal must DSCR.
Hard money
10% down · 12.0% · 12mo
- Down + closing
- —
- Monthly P&I
- —
- Monthly cashflow
- —
- DSCR
- —
- Eligible?
- —
Short-term bridge; refi at stabilization.
Rent comps 1 comps
| Address | Beds | Baths | Sqft | Rent | $/sqft | DOM | Units | Dist |
|---|---|---|---|---|---|---|---|---|
| 236 State Road S-38-244 Orangeburg, SC | 1.0–2.0 | 1.0–2.0 | 786 | $1,095 | $1.39 | 23d | 1 | 1.06mi |
Listing history 28 events
-
2026-06-19days on market $25,000 Active 223 DOM
-
2026-06-18days on market $25,000 Active 222 DOM
-
2026-06-17days on market $25,000 Active 221 DOM
-
2026-06-16days on market $25,000 Active 220 DOM
-
2026-06-15days on market $25,000 Active 219 DOM
-
2026-06-14days on market $25,000 Active 217 DOM
-
2026-06-12days on market $25,000 Active 216 DOM
-
2026-06-09days on market $25,000 Active 213 DOM
-
2026-06-08days on market $25,000 Active 212 DOM
-
2026-06-07days on market $25,000 Active 211 DOM
-
2026-06-07days on market $25,000 Active 210 DOM
-
2026-06-04days on market $25,000 Active 207 DOM
-
2026-06-02days on market $25,000 Active 206 DOM
-
2026-06-01days on market $25,000 Active 205 DOM
-
2026-05-31days on market $25,000 Active 204 DOM
-
2026-05-31days on market $25,000 Active 203 DOM
-
2026-03-16price $25,000 222-char remark
Show marketing remark (222 chars)
Investors - This home is ready for your vision. Home has been re-wired and most new windows. Orangeburg's new growth is looking for nice rentals and this would be ideal location. 10 minutes to I-26 , Amazon and hospital.
-
2026-03-16price $25,000
Show marketing remark (222 chars)
Investors - This home is ready for your vision. Home has been re-wired and most new windows. Orangeburg's new growth is looking for nice rentals and this would be ideal location. 10 minutes to I-26 , Amazon and hospital.
-
2025-11-08$28,000 Active 222-char remark
Show marketing remark (222 chars)
Investors - This home is ready for your vision. Home has been re-wired and most new windows. Orangeburg's new growth is looking for nice rentals and this would be ideal location. 10 minutes to I-26 , Amazon and hospital.
-
2025-11-08$28,000 Active
Show marketing remark (222 chars)
Investors - This home is ready for your vision. Home has been re-wired and most new windows. Orangeburg's new growth is looking for nice rentals and this would be ideal location. 10 minutes to I-26 , Amazon and hospital.
-
2023-09-26historical
-
2023-05-10historical Active Under Contract
-
2023-04-18status Active
-
2023-02-27status Pending
-
2023-02-09price $22,000
-
2023-02-01status Active
-
2022-12-24historical Active Under Contract
-
2022-12-14$27,000 Active
ⓘ Source: listings_history table (triggers on properties + properties_extension) + one-shot
backfill from property_details.listing_events for pre-trigger history.
Tax reassessment forecast SC · Resets to sale price
- Current annual tax
- $724 · $60/mo
- Projected year-2 tax
- $724 · $60/mo
- Expected delta
- $0/yr ($0/mo · 0.0%)
ⓘ Screening estimate from a state-policy table — verify with the county assessor before closing.
Climate risk First Street
- Flood 1/10 Low FEMA zone X (unshaded) · 0% chance over 30 yrs
- Wildfire 4/10 Moderate
- Heat 7/10 Severe 7 d/yr ≥107°F today · 17 d/yr by 30 yrs out
- Wind 8/10 Severe 80% chance of damaging wind over 30 yrs
- Air quality 3/10 Moderate 3 unhealthy d/yr today · 3 by 30 yrs out
Nearby sold comps map
Loading sold comps map…
Walkable amenities ~0.75 mi
Loading nearby amenities…
Taxation est. · year 1
- Rental income
- $13,140
- − Mortgage interest
- −$1,400
- − Property taxes
- −$724
- − Insurance
- −$125
- − Repairs & maintenance
- −$1,051
- − Management
- −$1,051
- − Depreciation
- −$727
- Taxable income
- $8,061
- Est. tax owed @ 24.0%
- −$1,935
- After-tax cash flow
- $6,024/yr
For passive investors: Depreciation is non-cash, so a rental often shows a tax loss while cash-flowing — sheltering income. Rental losses are passive: they offset passive income freely, and up to $25,000/yr can offset ordinary (W-2) income if you actively participate and your MAGI is under $100k (phasing out to $0 by $150k); unused losses carry forward. On sale, claimed depreciation is recaptured at up to 25%, and gains may owe capital-gains tax (a 1031 exchange can defer both). Figures are a year-1 estimate at your 24.0% rate — not tax advice; consult a CPA.
Schools (NCES district)
No district data.
Livability — Orangeburg
- Score
- 54/100
- State rank
- #324
- US rank
- #23942
Category grades
Schools grade is shown separately in the Schools card above.
Census & demographics
- Census place
- Orangeburg, SC
- City population
- 15,135
- Population (ZIP)
- 27,179
Population outlook (Orangeburg County) Hauer SSP2
- Today (2025)
- 82,698 people
- By 2030
- 78,615 · -4.9%
- By 2040
- 69,308 · -16.2%
- By 2050
- 60,629 · -26.7%
- By 2075
- 42,678 · -48.4%
- By 2100
- 28,136 · -66.0%
Race, ethnicity, and origin ACS 2023
- Neighborhood character
- Predominantly Black (76%)
- Race & ethnicity
- Black 76% White 20% Hispanic / Latino 2% Two or more races 2%
- Foreign-born
- 2% · Canada
- Languages at home
- 97% English-only · Spanish 2%
Political lean MEDSL · Orangeburg
- 2024 margin
- Strong D (+24.6) · D 61.8% · R 37.2% · Other 1.1%
- 2008→2024 swing
- -13.5pp toward R · 2008: 38.1pp · 2024: 24.6pp
- All cycles
- 2024: D+24.6 2020: D+33.2 2016: D+37.0 2012: D+43.5 2008: D+38.1
Not yet ingested
- Civics
- —
Market trends
- HPI YoY
- ▼ -56.65%
- Current HPI
- 150.823
- Rent YoY
- —
- Metro
- —
- State GDP YoY
- ▲ 4.51%
- F500 in state
- 2
Industry mix (Fortune 500 HQ in SC)
| Industry | F500 HQs | Revenue |
|---|---|---|
| Packaging | 1 | $7B |
|
||
Price history
-7.4% since first listed12 events — show timeline
- 2026-03-16 Price Changed $25,000 SBOR
- 2026-03-16 Price Changed $25,000 Charleston Trident MLS
- 2025-11-08 Listed $28,000 Charleston Trident MLS
- 2025-11-08 Listed $28,000 SBOR
- 2023-09-26 Listing Removed — Charleston Trident MLS
- 2023-05-10 Contingent — Charleston Trident MLS
- 2023-04-18 Relisted — Charleston Trident MLS
- 2023-02-27 Pending — Charleston Trident MLS
- 2023-02-09 Price Changed $22,000 Charleston Trident MLS
- 2023-02-01 Relisted — Charleston Trident MLS
- 2022-12-24 Contingent — Charleston Trident MLS
- 2022-12-14 Listed $27,000 Charleston Trident MLS
Property tax history
+4.6%/yrLatest (2024): $724 · +6.6% YoY. Source: county tax records.
Cash-flow waterfall
monthlySold comps — $/sqft
last 12 mo · ≤1 miLoading sold comps…