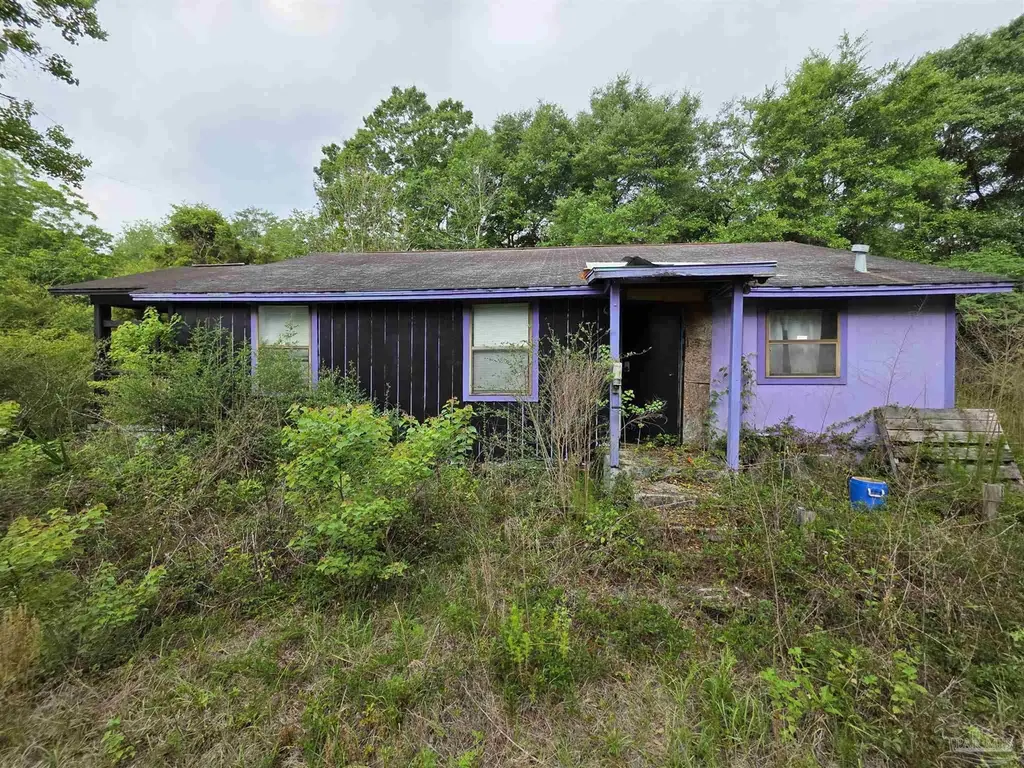
5607 Osceola St · Milton, FL
Flood risk 1/10 · Minimal
- FEMA flood zone
- X (unshaded)
- Chance of flooding over 30 yrs
- 0.0%
- Est. flood insurance / yr
- $507 – $1,088
Fire risk 4/10 · Minor
- Est. fire insurance / yr
- $947 – $1,759
Heat risk 10/10 · Severe
- Hot days now (above 104°F)
- 7 days/yr
- Hot days in 30 yrs
- 21 days/yr
Wind risk 9/10 · Severe
- Chance of severe wind over 30 yrs
- 99.0%
Air-quality risk 2/10 · Minimal
- Unhealthy air days now
- 0 days/yr
- Unhealthy air days in 30 yrs
- 1 days/yr
Risk factors via First Street. Map © Google.
Why this score? — see what drove the B+ grade
The composite is a weighted blend of 9 inputs, each scored 0–100. Each bar is that input's sub-score; the figure is the points it added to the 100-point composite (weight × sub-score).
- Cash flow +29.0/30.0
- ARV discount +15.0/15.0
- DSCR +10.0/10.0
- 1% rule +8.1/10.0
- Schools +5.3/10.0
- Livability +3.9/5.0
- Rent growth +3.2/5.0
- Condition / age +1.0/5.0
- Appreciation +0.0/10.0
$110,000
🖨 Deal sheet 📄 Offer letter ✓ Due diligence
Listing remarks
Great investment opportunity! 1.69 Acre Parcel Zoned R1M. Leaves room to renovate current home and add mobile home on divided lot if desired. Central to Downtown Milton and close to Blackwater river recreational parks. The Home requires significant repairs to finance, but seller may consider FHA 203k loan. 2 Bedrooms 1 Bath with spacious kitchen and dining room. Cash only otherwise. Call your agent today for info.
Key facts
- 1.69 acre parcel
- Zoned r1m
- 1.69 acre lot
Tags
Property features AI
Finance
- Other: Lot size approximately 1.69 acres; Building area approximately 1,080 square feet; Directions: From Stewart St and Munson Hwy head east, then north on Osceola
- Financial info: None listed
- HOA & community: No homeowners association
Exterior
- Parking: Driveway with open parking
- Security: None listed
- Utilities: Public water; Septic tank sewer; Electric with circuit breakers
- Home design: One-story frame home; Resale property; Not attached to another property; Composition roof; County-maintained road access
- Construction: Frame construction; Off-grade foundation; One level
- Exterior features: Corner lot
Interior
- Kitchen: Electric water heater (listed under appliances)
- Bedrooms: Main-level bedroom (approximately 12' x 15')
- Flooring: Hardwood
- Bathrooms: 1 full bathroom
- Heating & cooling: Wall/window heating units; Wall/window cooling units
- Interior features: Hardwood floors; Double-pane windows
- Laundry & utility: None listed
Neighborhood map
What this means for you Summary
Snapshot
- This is a 2-bed/1.0-bath single-family listed at $110k. Condition is rated poor.
Deal economics
- At list price, monthly cash flow is $377 ($5k/yr) — positive.
- The deal already cash-flows at list — no discount required.
- Meets the 1% rule at list price ($1k rent vs $110k).
- Recommended offer: $107k (3.0% below list) — sets the bar for market timing.
- Cap rate 10.4% vs local median 4.6% in Milton — top-decile yield for the area; either an underpriced asset or a hidden risk that comps aren't pricing in. Stress-test before assuming the spread holds.
Location & tenants
- Location reads 78/100 on livability (#166 in FL, #2,480 nationally) — a middle-class / working-renter tenant base. Strengths: cost of living A+, housing A+, health & safety A+; Watch: amenities D-, commute F.
- Santa Rosa (suburban): math 63% / reading 60% proficiency, ranked #8 of 73 in FL (top 11%) — acceptable for families but not a draw, mixed tenant base, ~2y average lease.
- Market conditions: Rents rising (+2.7%/yr); 360 active listings in the ZIP; 6 comparable units currently listed for rent nearby; rentals at typical pace (median 21d on market — plan ~3-4 weeks tenant-placement turnaround); solid renter incomes; 1,983 units permitted in Santa Rosa County in 2024 (128 in 5+ unit buildings).
Forward outlook
- Local home prices are declining (-3.0%/yr); year-one equity from $761 of loan paydown is wiped out by about $3k of value loss. Plan a longer hold.
- Santa Rosa County population projected at +31% by 2050 — long-run rental-demand tailwind backs the buy-and-hold thesis.
- At projected returns (-3.0% appreciation + 2.7% rent growth), your $31k cash investment doubles in ~9 years — after that, you're playing with house money.
Negotiation context
- It's been on market 31 days — a 3% lower offer ($107k) is reasonable based on typical stale-listing flexibility.
Risks & watch-outs
- Climate carrying-cost: severe wind risk, 99% chance of damaging wind over 30y; extreme-heat days projected 7→21/yr by 2055 (HVAC capex compounding) — expect insurance premiums to compound above CPI over the hold.
Questions for the listing agent
- It's been on market 31 days. Have you received any prior offers? Is the seller open to a 3% concession, seller financing, or rate buy-down credit?
- Have any recent inspections been done? Can we get a copy of the seller's disclosures and any deferred-maintenance estimates?
- Built in 1960 — when were the roof, HVAC, electrical panel, plumbing, and water heater last replaced?
- Is there a deadline driving the sale (1031 exchange, divorce, estate, relocation)? That informs how much negotiation room exists.
- Schools are B-rated — typically a magnet for longer-tenancy family renters. What's the average tenant stay here, and is there a school-zone premium baked into asking?
- What's the average days-on-market for RENTAL listings here right now (not sales)? A rising rental-DOM trend means longer vacancies and softer asking-rent achievability than the comps imply.
- What's the recent tenant-quality profile in this submarket — average credit score on applications, eviction rate, late-payment / NSF rate, and stable-employment percentage? A property-management company in the area should have these aggregated.
- How much new for-sale + rental construction is in the pipeline within 1–3 miles? Heavy new supply typically softens prices + rents 12–24 months out; constrained supply supports both.
Investment metrics
- 1% rule
- 1.31% ✓
- Cap rate
- 10.41%
- Cash-on-cash
- 14.70%
- DSCR
- 1.65
- GRM
- 6.4
CMA / ARV
- ARV (on-the-fly)
- $187,920
- Comps found
- 9
Show comp detail 9 sales within ~0.75 mi
| Address | Dist | Beds/Ba | Sqft | Sold | Price | $/sf | Match |
|---|---|---|---|---|---|---|---|
| 6844 Ferris Hill St | 0.19mi | 3/2.0 (+1) | 1,150 (+6%) | 2mo | $240,000 | $209 | 70 |
| 5544 Hill St | 0.19mi | 3/2.0 (+1) | 1,120 (+4%) | 7mo | $189,900 | $170 | 70 |
| 5540 Hill St | 0.21mi | 3/2.0 (+1) | 1,120 (+4%) | 7mo | $195,000 | $174 | 70 |
| 6760 North Ave | 0.37mi | 3/2.0 (+1) | 1,173 (+9%) | 12mo | $222,000 | $189 | 50 |
| 6756 North Ave | 0.41mi | 3/2.0 (+1) | 1,173 (+9%) | 11mo | $219,000 | $187 | 48 |
| 6804 Dixon St | 0.48mi | 3/2.0 (+1) | 1,220 (+13%) | 4mo | $200,000 | $164 | 44 |
| 5628 Juniper St | 0.26mi | 3/1.0 (+1) | 920 (-15%) | 22mo | $159,900 | $174 | 39 |
| 5796 Washington St | 0.69mi | 3/2.0 (+1) | 1,200 (+11%) | 4mo | $199,900 | $167 | 38 |
| 6740 Cotter Dr | 0.67mi | 3/2.0 (+1) | 1,218 (+13%) | 6mo | $225,000 | $185 | 33 |
Match score weights: distance 35% · size 25% · config 20% · recency 20%. Top-matched comps best support the ARV.
Projected returns pro-forma
-3.0% appreciation · 2.7% rent growth · sell at horizon
- IRR
- 4.9%
- Equity multiple
- 1.19×
- Total profit
- $5,788
- Equity at exit
- $16,401
- IRR
- 14.1%
- Equity multiple
- 2.11×
- Total profit
- $34,297
- Equity at exit
- $9,511
Cash invested: $30,800 (down + closing). Projections, not guarantees.
Landlord ↔ Tenant lean methodology
- Overall (STATE)
- 87 Strongly Landlord-Friendly
- State Florida
- 87 Strongly Landlord-Friendly · R+3
- County
- — inherits STATE
- City
- — inherits STATE
ZIP-level market 32570
- Home prices YoY
- -15.1%
- Rents YoY
- 2.7%
- Active inventory
- 360
- Price-to-rent
- 6.4×
Monthly cashflow live
- Estimated rent
- $1,440 high interval (Pro) →
- Mortgage (P&I)
- −$577
- Tax est. 1.5%
- −$138 /mo · $1,650/yr
- Insurance
- −$46
- HOA
- −$0
- Vacancy / Maint / Mgmt
- −$302
- Net cashflow
- $377
Break-even live
UW: 25.0% down · 7.5% · 30yr · 1.5% tax · 5.0% vac · 8.0% maint · 8.0% mgmt
Financing live
Cash to close
- Down payment
- $27,500
- Closing costs
- $3,300
- Reserves months
- —
- Total cash needed
- —
Loan-product check · same deal, 3 products live
Conventional
25% down · 7.5% · 30yr
- Down + closing
- —
- Monthly P&I
- —
- Monthly cashflow
- —
- DSCR
- —
- Eligible?
- —
Personal DTI + credit; lowest rate.
DSCR
20% down · 8.5% · 30yr
- Down + closing
- —
- Monthly P&I
- —
- Monthly cashflow
- —
- DSCR
- —
- Eligible?
- —
No personal income docs; deal must DSCR.
Hard money
10% down · 12.0% · 12mo
- Down + closing
- —
- Monthly P&I
- —
- Monthly cashflow
- —
- DSCR
- —
- Eligible?
- —
Short-term bridge; refi at stabilization.
Rent comps 6 comps
| Address | Beds | Baths | Sqft | Rent | $/sqft | DOM | Units | Dist |
|---|---|---|---|---|---|---|---|---|
| 5394 Munson Hwy Milton, FL | 2.0 | 2.0 | 900 | $1,250 | $1.39 | 14d | 1 | 0.21mi |
| 5376 Conecuh St Milton, FL | 2.0 | 1.0 | 730 | $1,400 | $1.92 | 23d | 1 | 0.61mi |
| 6593 Lee St Unit B Milton, FL | 2.0 | 1.0 | 750 | $1,300 | $1.73 | 21d | 1 | 0.90mi |
| 6567 Park Ave Unit A Milton, FL | 1.0 | 1.0 | 703 | $925 | $1.32 | 14d | 1 | 1.01mi |
| 6567 Park Ave NW Unit D Milton, FL | 1.0 | 1.0 | 703 | $925 | $1.32 | 23d | 1 | 1.01mi |
| 5357 Locklin Ave Milton, FL | 3.0 | 1.0 | 1100 | $1,700 | $1.55 | 14d | 1 | 1.16mi |
Listing history 16 events
-
2026-06-18days on market $110,000 Active 31 DOM
-
2026-06-17days on market $110,000 Active 30 DOM
-
2026-06-16days on market $110,000 Active 29 DOM
-
2026-06-15days on market $110,000 Active 28 DOM
-
2026-06-14days on market $110,000 Active 26 DOM
-
2026-06-10days on market $110,000 Active 23 DOM
-
2026-06-09days on market $110,000 Active 22 DOM
-
2026-06-08days on market $110,000 Active 21 DOM
-
2026-06-07days on market $110,000 Active 20 DOM
-
2026-06-05days on market $110,000 Active 17 DOM
-
2026-06-03days on market $110,000 Active 16 DOM
-
2026-06-02days on market $110,000 Active 15 DOM
-
2026-06-01days on market $110,000 Active 14 DOM
-
2026-05-31days on market $110,000 Active 13 DOM
-
2026-05-31days on market $110,000 Active 12 DOM
-
2026-05-18$110,000 Active
ⓘ Source: listings_history table (triggers on properties + properties_extension) + one-shot
backfill from property_details.listing_events for pre-trigger history.
Climate risk First Street
- Flood 1/10 Low FEMA zone X (unshaded) · 0% chance over 30 yrs
- Wildfire 4/10 Moderate
- Heat 10/10 Extreme 7 d/yr ≥104°F today · 21 d/yr by 30 yrs out
- Wind 9/10 Extreme 99% chance of damaging wind over 30 yrs
- Air quality 2/10 Low 0 unhealthy d/yr today · 1 by 30 yrs out
Nearby sold comps map
Loading sold comps map…
Walkable amenities ~0.75 mi
Loading nearby amenities…
Taxation est. · year 1
- Rental income
- $17,277
- − Mortgage interest
- −$6,162
- − Property taxes
- −$1,650
- − Insurance
- −$550
- − Repairs & maintenance
- −$1,382
- − Management
- −$1,382
- − Depreciation
- −$3,200
- Taxable income
- $2,951
- Est. tax owed @ 24.0%
- −$708
- After-tax cash flow
- $3,818/yr
For passive investors: Depreciation is non-cash, so a rental often shows a tax loss while cash-flowing — sheltering income. Rental losses are passive: they offset passive income freely, and up to $25,000/yr can offset ordinary (W-2) income if you actively participate and your MAGI is under $100k (phasing out to $0 by $150k); unused losses carry forward. On sale, claimed depreciation is recaptured at up to 25%, and gains may owe capital-gains tax (a 1031 exchange can defer both). Figures are a year-1 estimate at your 24.0% rate — not tax advice; consult a CPA.
Condition & rehab AI · 12 photos
This property requires extensive repairs and maintenance, including landscaping, kitchen and bath updates, and interior wall repair. Significant improvements are needed to increase its resale and rental value.
Repairs flagged
- Major exterior overgrowth — Vegetation covers the front yard and surrounding area
- Major kitchen flooring — Worn-out flooring
- Major bath flooring — Worn-out flooring
- Major kitchen countertops — Cluttered countertops
- Major bath countertops — Cluttered countertops
- Major kitchen appliances — Outdated appliances
- Major bath appliances — Outdated appliances
- Major interior walls — Worn-out paint and peeling walls
- Major landscaping — Overgrown vegetation covers the front yard and surrounding area
Value-add opportunities
- Both landscaping and exterior overgrowth removal — Improves curb appeal and property value
- Both kitchen and bath flooring replacement — Enhances functionality and aesthetics
- Both kitchen and bath countertops replacement — Enhances functionality and aesthetics
- Both kitchen and bath appliance replacement — Enhances functionality and aesthetics
- Both interior wall repair and painting — Enhances aesthetics and functionality
Renovation cost estimate screening
| Repair item | Severity | Est. cost |
|---|---|---|
| exterior overgrowth · Vegetation covers the front yard and surrounding area | Major | $15,000–50,000 |
| kitchen flooring · Worn-out flooring | Major | $15,000–50,000 |
| bath flooring · Worn-out flooring | Major | $15,000–50,000 |
| kitchen countertops · Cluttered countertops | Major | $15,000–50,000 |
| bath countertops · Cluttered countertops | Major | $15,000–50,000 |
| kitchen appliances · Outdated appliances | Major | $15,000–50,000 |
| bath appliances · Outdated appliances | Major | $15,000–50,000 |
| interior walls · Worn-out paint and peeling walls | Major | $15,000–50,000 |
| landscaping · Overgrown vegetation covers the front yard and surrounding area | Major | $15,000–50,000 |
| Total estimated repair cost · 9 items | $135,000–450,000 |
Value-add ROI direction
- Both landscaping and exterior overgrowth removal — Improves curb appeal and property value ↑
- Both kitchen and bath flooring replacement — Enhances functionality and aesthetics ↑
- Both kitchen and bath countertops replacement — Enhances functionality and aesthetics ↑
- Both kitchen and bath appliance replacement — Enhances functionality and aesthetics ↑
- Both interior wall repair and painting — Enhances aesthetics and functionality ↑
ⓘ Cost ranges are severity-bucket heuristics (US national rule-of-thumb). Get contractor quotes + a written scope before underwriting a rehab budget.
Schools (NCES district)
- District
- Santa Rosa
- NCES district ID
- 1201650
- Math proficiency
- 63% ▼ -6.00%
- Reading proficiency
- 60% ▼ -5.00%
- Median HH income
- $58,161
- Composite
- 53.12/100
- National rank
- #1511
- State rank
- #8 of 73 in FL
Livability — Milton
- Score
- 78/100
- State rank
- #166
- US rank
- #2480
Category grades
Schools grade is shown separately in the Schools card above.
Census & demographics
- County
- Santa Rosa County · 194,764 people
- City population
- 69,025
- Metro
- Pensacola-Ferry Pass-Brent, FL
- Population (ZIP)
- 37,197
- Household income
- $77,222
- Rent vs Own
- Severe rent burden
- 590.0
Population outlook (Santa Rosa County) Hauer SSP2
- Today (2025)
- 195,978 people
- By 2030
- 209,782 · +7.0%
- By 2040
- 235,293 · +20.1%
- By 2050
- 256,408 · +30.8%
- By 2075
- 298,074 · +52.1%
- By 2100
- 303,216 · +54.7%
Race, ethnicity, and origin ACS 2023
- Neighborhood character
- Predominantly White (80%)
- Race & ethnicity
- White 80% Two or more races 7% Black 6% Hispanic / Latino 6% Asian 1%
- Hispanic origin (detail)
- Mexican 2% Puerto Rican 2%
- Common ancestry
- Italian 4% Lithuanian 3% Portuguese 2%
- Foreign-born
- 4% · Canada
- Languages at home
- 94% English-only · Spanish 4% Other Asian/Pacific 1%
Political lean MEDSL · Santa Rosa
- 2024 margin
- Solid R (+51.0) · D 24.1% · R 75.0%
- 2008→2024 swing
- -3.0pp toward R · 2008: -47.9pp · 2024: -51.0pp
- All cycles
- 2024: R+51.0 2020: R+46.5 2016: R+53.5 2012: R+52.6 2008: R+47.9
Not yet ingested
- Civics
- —
Market trends
- HPI YoY
- ▼ -51.06%
- Current HPI
- 287.7469
- Rent YoY
- ▲ 2.70%
- Metro
- Pensacola-Ferry Pass-Brent, FL
- State GDP YoY
- ▲ 3.28%
- F500 in state
- 36
Industry mix (Fortune 500 HQ in FL)
| Industry | F500 HQs | Revenue |
|---|---|---|
| Industrial Technology | 2 | $29B |
|
||
| Insurance | 2 | $17B |
|
||
| Retail | 1 | $60B |
|
||
| Technology Distribution | 1 | $58B |
|
||
| Homebuilding | 1 | $35B |
|
||
| Technology Manufacturing | 1 | $35B |
|
||
Price history
1 event — show timeline
- 2026-05-18 Listed $110,000 PARMLS
Cash-flow waterfall
monthlySold comps — $/sqft
last 12 mo · ≤1 miLoading sold comps…