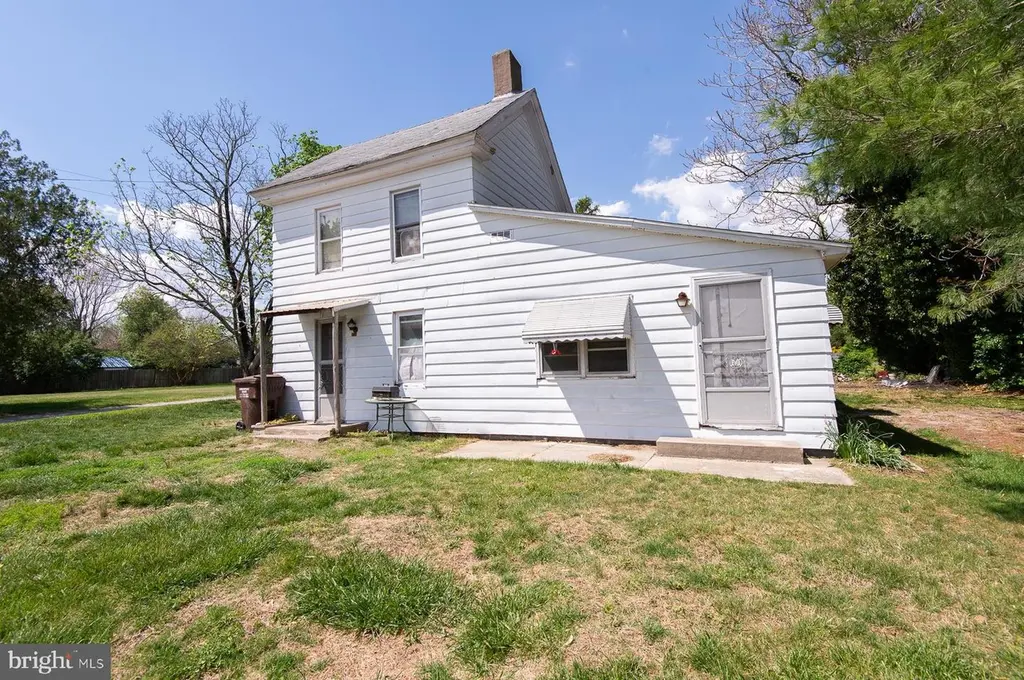
111 School St · Mardela Springs, MD
Flood risk 1/10 · Minimal
- FEMA flood zone
- X (unshaded)
- Chance of flooding over 30 yrs
- 0.0%
- Est. flood insurance / yr
- $507 – $1,088
Fire risk 3/10 · Minor
- Est. fire insurance / yr
- $755 – $1,403
Heat risk 8/10 · Major
- Hot days now (above 106°F)
- 7 days/yr
- Hot days in 30 yrs
- 16 days/yr
Wind risk 6/10 · Moderate
- Chance of severe wind over 30 yrs
- 77.0%
Air-quality risk 3/10 · Minor
- Unhealthy air days now
- 2 days/yr
- Unhealthy air days in 30 yrs
- 2 days/yr
Risk factors via First Street. Map © Google.
Why this score? — see what drove the B grade
The composite is a weighted blend of 9 inputs, each scored 0–100. Each bar is that input's sub-score; the figure is the points it added to the 100-point composite (weight × sub-score).
- Cash flow +23.1/30.0
- ARV discount +15.0/15.0
- Appreciation +10.0/10.0
- DSCR +7.4/10.0
- 1% rule +4.9/10.0
- Livability +3.5/5.0
- Rent growth +2.5/5.0
- Condition / age +2.5/5.0
- Schools +1.9/10.0
$120,000
🖨 Deal sheet 📄 Offer letter ✓ Due diligence
Listing remarks MLS
Mardela Springs - looking for a project with a great small town feel? Check out this 2+BR, 1 bath home on a corner lot. Large rooms. Electric baseboard heat. Stainless stove and refrigerator.
Key facts
- 0.3 acre lot
- Built 1910
- Listed 62 days
Neighborhood map
What this means for you Summary
Snapshot
- This is a 2-bed/1.0-bath single-family listed at $120k.
Deal economics
- At list price, monthly cash flow is $215 ($3k/yr) — positive.
- The deal already cash-flows at list — no discount required.
- To meet the 1% rule (rent ≥ 1% of price), the offer needs to be $119k (0.7% below list).
- Recommended offer: $113k (6.0% below list) — sets the bar for market timing.
Location & tenants
- Location reads 70/100 on livability (#181 in MD) — a middle-class / working-renter tenant base. Strengths: housing A+, health & safety A+, employment A; Watch: crime F, amenities F, commute F.
- Wicomico County Public Schools (urban): math 16% / reading 26% proficiency, ranked #19 of 24 in MD (top 79%) — low school quality limits family demand, transient renter base, plan for 1-2y turnover.
- Market conditions: 19 active listings in the ZIP; 278 units permitted in Wicomico County in 2024 (44 in 5+ unit buildings).
Forward outlook
- In year one you build about $13k of equity ($830 loan paydown + $12k appreciation (10.0% local appreciation)).
- Wicomico County population projected at +14% by 2050 — modest demand growth; plan on rents tracking national, not racing it.
- At projected returns (10.0% appreciation + 3.0% rent growth), your $34k cash investment doubles in ~3 years — after that, you're playing with house money.
- By year 3, paydown + projected appreciation supports a ~$32k cash-out refi (75% LTV) — recoverable capital for the next deal without selling this one.
Negotiation context
- It's been on market 62 days — a 6% lower offer ($113k) is reasonable based on typical stale-listing flexibility.
- Current owner paid $25k; list at $120k implies a 380% gain — meaningful room to come down on a strong offer.
Risks & watch-outs
- Watch-outs: built in 1910 — expect roof / HVAC / electrical / plumbing capex.
- Climate carrying-cost: major wind risk, 77% chance of damaging wind over 30y; extreme-heat days projected 7→16/yr by 2055 (HVAC capex compounding) — expect insurance premiums to compound above CPI over the hold.
Questions for the listing agent
- It's been on market 62 days. Have you received any prior offers? Is the seller open to a 6% concession, seller financing, or rate buy-down credit?
- Built in 1910 — when were the roof, HVAC, electrical panel, plumbing, and water heater last replaced?
- Why hasn't it sold? Are there any deal-killer items the seller is aware of (foundation, flood, title, zoning, code violations)?
- Is there a deadline driving the sale (1031 exchange, divorce, estate, relocation)? That informs how much negotiation room exists.
- Schools are B-rated — typically a magnet for longer-tenancy family renters. What's the average tenant stay here, and is there a school-zone premium baked into asking?
- Crime grade is F in this area — have there been break-ins, vandalism, or insurance claims at this property in the last 3 years? What carrier currently insures it and at what premium?
- What's the average days-on-market for RENTAL listings here right now (not sales)? A rising rental-DOM trend means longer vacancies and softer asking-rent achievability than the comps imply.
- What's the recent tenant-quality profile in this submarket — average credit score on applications, eviction rate, late-payment / NSF rate, and stable-employment percentage? A property-management company in the area should have these aggregated.
- How much new for-sale + rental construction is in the pipeline within 1–3 miles? Heavy new supply typically softens prices + rents 12–24 months out; constrained supply supports both.
Investment metrics
- 1% rule
- 0.99% ✗
- Cap rate
- 8.45%
- Cash-on-cash
- 7.69%
- DSCR
- 1.34
- GRM
- 8.4
CMA / ARV
- ARV (median comp)
- $237,927
- List price
- $120,000
- Delta
- -49.56%
- Verdict
- UNDERPRICED
- Comps
- 12 within 1.0 mi
Show comp detail 4 sales within ~0.75 mi
| Address | Dist | Beds/Ba | Sqft | Sold | Price | $/sf | Match |
|---|---|---|---|---|---|---|---|
| 513 Main St | 0.20mi | 2/1.0 | 1,260 (+4%) | 9mo | $150,000 | $119 | 76 |
| 311 Bridge St | 0.09mi | 3/2.0 (+1) | 1,100 (-9%) | 19mo | $249,000 | $226 | 56 |
| 24880 Delmar Rd | 0.52mi | 3/1.0 (+1) | 1,158 (-4%) | 11mo | $148,000 | $128 | 55 |
| 207 Bridge St | 0.07mi | 3/2.0 (+1) | 1,388 (+15%) | 13mo | $97,400 | $70 | 52 |
Match score weights: distance 35% · size 25% · config 20% · recency 20%. Top-matched comps best support the ARV.
Projected returns pro-forma
10.0% appreciation · 3.0% rent growth · sell at horizon
- IRR
- 29.9%
- Equity multiple
- 3.35×
- Total profit
- $79,031
- Equity at exit
- $108,106
- IRR
- 25.9%
- Equity multiple
- 7.60×
- Total profit
- $221,852
- Equity at exit
- $233,134
Cash invested: $33,600 (down + closing). Projections, not guarantees.
Landlord ↔ Tenant lean methodology
- Overall (STATE)
- 27 Tenant-Leaning
- State Maryland
- 27 Tenant-Leaning · D+14
- County
- — inherits STATE
- City
- — inherits STATE
ZIP-level market 21837
- Home prices YoY
- 23.2%
- Active inventory
- 19
- Price-to-rent
- 8.4×
Monthly cashflow live
- Estimated rent
- $1,191 medium interval (Pro) →
- Mortgage (P&I)
- −$629
- Tax from tax record
- −$46 /mo · $555/yr
- Insurance
- −$50
- HOA
- −$0
- Vacancy / Maint / Mgmt
- −$250
- Net cashflow
- $215
Break-even live
UW: 25.0% down · 7.5% · 30yr · 1.5% tax · 5.0% vac · 8.0% maint · 8.0% mgmt
Financing live
Cash to close
- Down payment
- $30,000
- Closing costs
- $3,600
- Reserves months
- —
- Total cash needed
- —
Loan-product check · same deal, 3 products live
Conventional
25% down · 7.5% · 30yr
- Down + closing
- —
- Monthly P&I
- —
- Monthly cashflow
- —
- DSCR
- —
- Eligible?
- —
Personal DTI + credit; lowest rate.
DSCR
20% down · 8.5% · 30yr
- Down + closing
- —
- Monthly P&I
- —
- Monthly cashflow
- —
- DSCR
- —
- Eligible?
- —
No personal income docs; deal must DSCR.
Hard money
10% down · 12.0% · 12mo
- Down + closing
- —
- Monthly P&I
- —
- Monthly cashflow
- —
- DSCR
- —
- Eligible?
- —
Short-term bridge; refi at stabilization.
Listing history 19 events
-
2026-06-18days on market $120,000 Active 62 DOM
-
2026-06-17days on market $120,000 Active 61 DOM
-
2026-06-16days on market $120,000 Active 60 DOM
-
2026-06-15days on market $120,000 Active 59 DOM
-
2026-06-14days on market $120,000 Active 57 DOM
-
2026-06-13days on market $120,000 Active 56 DOM
-
2026-06-10days on market $120,000 Active 54 DOM
-
2026-06-09days on market $120,000 Active 53 DOM
-
2026-06-08days on market $120,000 Active 52 DOM
-
2026-06-07days on market $120,000 Active 51 DOM
-
2026-06-03days on market $120,000 Active 47 DOM
-
2026-06-02days on market $120,000 Active 46 DOM
-
2026-06-01days on market $120,000 Active 45 DOM
-
2026-05-31days on market $120,000 Active 44 DOM
-
2026-05-30days on market $120,000 Active 43 DOM
-
2026-05-01price $120,000 192-char remark
Show marketing remark (192 chars)
Mardela Springs - looking for a project with a great small town feel? Check out this 2+BR, 1 bath home on a corner lot. Large rooms. Electric baseboard heat. Stainless stove and refrigerator.
-
2026-04-17$125,000 Active 192-char remark
Show marketing remark (192 chars)
Mardela Springs - looking for a project with a great small town feel? Check out this 2+BR, 1 bath home on a corner lot. Large rooms. Electric baseboard heat. Stainless stove and refrigerator.
-
2001-06-04soldstatus $25,000
-
1986-10-24soldstatus $22,500
ⓘ Source: listings_history table (triggers on properties + properties_extension) + one-shot
backfill from property_details.listing_events for pre-trigger history.
Tax reassessment forecast MD · Partial reset (capped growth)
- Current annual tax
- $555 · $46/mo
- Projected year-2 tax
- $931 · $78/mo
- Expected delta
- +$377/yr (+$31/mo · 67.9%)
ⓘ Screening estimate from a state-policy table — verify with the county assessor before closing.
Climate risk First Street
- Flood 1/10 Low FEMA zone X (unshaded) · 0% chance over 30 yrs
- Wildfire 3/10 Moderate
- Heat 8/10 Severe 7 d/yr ≥106°F today · 16 d/yr by 30 yrs out
- Wind 6/10 Major 77% chance of damaging wind over 30 yrs
- Air quality 3/10 Moderate 2 unhealthy d/yr today · 2 by 30 yrs out
Nearby sold comps map
Loading sold comps map…
Walkable amenities ~0.75 mi
Loading nearby amenities…
Taxation est. · year 1
- Rental income
- $14,293
- − Mortgage interest
- −$6,722
- − Property taxes
- −$555
- − Insurance
- −$600
- − Repairs & maintenance
- −$1,143
- − Management
- −$1,143
- − Depreciation
- −$3,491
- Taxable income
- $639
- Est. tax owed @ 24.0%
- −$153
- After-tax cash flow
- $2,432/yr
For passive investors: Depreciation is non-cash, so a rental often shows a tax loss while cash-flowing — sheltering income. Rental losses are passive: they offset passive income freely, and up to $25,000/yr can offset ordinary (W-2) income if you actively participate and your MAGI is under $100k (phasing out to $0 by $150k); unused losses carry forward. On sale, claimed depreciation is recaptured at up to 25%, and gains may owe capital-gains tax (a 1031 exchange can defer both). Figures are a year-1 estimate at your 24.0% rate — not tax advice; consult a CPA.
Schools (NCES district)
- District
- Wicomico County Public Schools
- NCES district ID
- 2400690
- Math proficiency
- 16% ▼ -18.00%
- Reading proficiency
- 26% ▼ -13.00%
- Median HH income
- $51,745
- Composite
- 18.87/100
- National rank
- #8860
- State rank
- #19 of 24 in MD
Livability — Mardela Springs
- Score
- 70/100
- State rank
- #181
- US rank
- #8103
Category grades
Schools grade is shown separately in the Schools card above.
Census & demographics
- Census place
- Mardela Springs, MD
- Population (ZIP)
- 2,975
Population outlook (Wicomico County) Hauer SSP2
- Today (2025)
- 108,548 people
- By 2030
- 111,783 · +3.0%
- By 2040
- 118,139 · +8.8%
- By 2050
- 123,641 · +13.9%
- By 2075
- 139,784 · +28.8%
- By 2100
- 145,334 · +33.9%
Race, ethnicity, and origin ACS 2023
- Neighborhood character
- Majority White (65%)
- Race & ethnicity
- White 65% Black 26% Hispanic / Latino 6% Two or more races 2%
- Hispanic origin (detail)
- Mexican 3%
- Common ancestry
- Romanian 2% Slovak 1% Serbian 0%
- Foreign-born
- 4% · Canada
- Languages at home
- 98% English-only · Spanish 1% Other Indo-European 1%
Political lean MEDSL · Wicomico
- 2024 margin
- Lean R (+5.5) · D 46.1% · R 51.5% · Other 2.4%
- 2008→2024 swing
- +0.3pp no change · 2008: -5.8pp · 2024: -5.5pp
- All cycles
- 2024: R+5.5 2020: R+1.9 2016: R+11.6 2012: R+6.9 2008: R+5.8
Not yet ingested
- Civics
- —
Market trends
- HPI YoY
- ▲ 51.70%
- Current HPI
- 274.26
- Rent YoY
- —
- Metro
- —
- State GDP YoY
- ▲ 2.97%
- F500 in state
- 12
Industry mix (Fortune 500 HQ in MD)
| Industry | F500 HQs | Revenue |
|---|---|---|
| Aerospace / Defense | 1 | $71B |
|
||
| Utilities | 1 | $25B |
|
||
| Hotels | 1 | $24B |
|
||
| Consumer Goods | 1 | $7B |
|
||
| Real Estate | 1 | $6B |
|
||
| Chemicals | 1 | $2B |
|
||
Price history
+433.3% since first listed4 events — show timeline
- 2026-05-01 Price Changed $120,000 BRIGHT MLS
- 2026-04-17 Listed $125,000 BRIGHT MLS
- 2001-06-04 Sold (Public Records) $25,000 Public Records
- 1986-10-24 Sold (Public Records) $22,500 Public Records
Property tax history
+0.2%/yrLatest (2025): $555 · +3.2% YoY. Source: county tax records.
Cash-flow waterfall
monthlySold comps — $/sqft
last 12 mo · ≤1 miLoading sold comps…