 Triplex
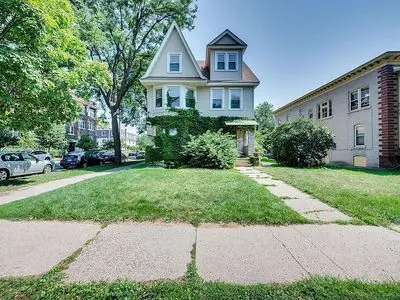
2501 Emerson Ave S · Minneapolis, MN
Flood risk 1/10 · Minimal
- FEMA flood zone
- X (unshaded)
- Chance of flooding over 30 yrs
- 0.0%
- Est. flood insurance / yr
- $473 – $860
Fire risk 1/10 · Minimal
- Est. fire insurance / yr
- $888 – $1,650
Heat risk 2/10 · Minimal
- Hot days now (above 99°F)
- 7 days/yr
- Hot days in 30 yrs
- 14 days/yr
Wind risk 2/10 · Minimal
- Chance of severe wind over 30 yrs
- —
Air-quality risk 2/10 · Minimal
- Unhealthy air days now
- 1 days/yr
- Unhealthy air days in 30 yrs
- 1 days/yr
Risk factors via First Street. Map © Google.
Why this score? — see what drove the D- grade
The composite is a weighted blend of 9 inputs, each scored 0–100. Each bar is that input's sub-score; the figure is the points it added to the 100-point composite (weight × sub-score).
- Cash flow +14.3/30.0
- DSCR +4.3/10.0
- 1% rule +4.0/10.0
- Livability +3.9/5.0
- Schools +3.5/10.0
- Rent growth +3.0/5.0
- Condition / age +2.5/5.0
- ARV discount +0.1/15.0
- Appreciation +0.0/10.0
$565,000
🖨 Deal sheet 📄 Offer letter ✓ Due diligence
Multi-family units
County records classify this as Multi-Family (2-4 Unit). Listing-text estimate: 3 units. confirmed
Listing remarks MLS
Wedge Neighborhood Tri-plex with R5 zoning. Currently used as a short term rental property. Turn key business opportunity or excellent owner occupant option. Hardwood floors, lots of storage in the basement and large 3 car garage. Conveniently located near Downtown, the Lakes and countless bike/running trails, dining and entertainment options!
Key facts
- Proximity to uptown
- Wedge neighborhood
- Built 1900
Tags
Property features AI
Exterior
- Home design: Built in 1900
- Construction: Historic property constructed in 1900
- Exterior features: Located in the Lowry Hill East neighborhood
Neighborhood map
What this means for you Summary
Snapshot
- This is a 1×4.0bd/2.0ba + 2×2.0bd/1.0ba units multifamily listed at $565k.
Deal economics
- At list price, monthly cash flow is $100 ($1k/yr) — positive. Per door: $33/mo.
- The deal already cash-flows at list — no discount required.
- To meet the 1% rule (rent ≥ 1% of price), the offer needs to be $510k (9.7% below list).
- Recommended offer: $510k (9.7% below list) — sets the bar for 1% rule.
- Cap rate 6.5% vs local median 3.1% in Minneapolis — top-decile yield for the area; either an underpriced asset or a hidden risk that comps aren't pricing in. Stress-test before assuming the spread holds.
Location & tenants
- Location reads 78/100 on livability (#110 in MN, #2,525 nationally) — a middle-class / working-renter tenant base. Strengths: amenities A+, commute A+, housing A+; Watch: cost of living C-, crime F.
- Minneapolis Public School District (urban): math 35% / reading 46% proficiency, ranked #217 of 301 in MN (top 72%) — families likely to look elsewhere, expect single-tenant / working-renter base with shorter leases.
- Market conditions: Rents rising (+1.9%/yr); 100 active listings in the ZIP; 3 comparable units currently listed for rent nearby; rentals lingering (median 44d on market — plan ~5-8 weeks vacancy on turnover, expect pricing pressure); 67% of comp listings sitting > 30 days — soft ceiling on asking rent; 4,651 units permitted in Hennepin County in 2024 (2,443 in 5+ unit buildings).
- At $5,103/mo this rent would consume 84% of the median local household income ($73k/yr) (locally 985% of renters already pay >50% of income on rent) — very limited rent-growth headroom before tenants either downsize or default.
Forward outlook
- Local home prices are declining (-3.0%/yr); year-one equity from $4k of loan paydown is wiped out by about $17k of value loss. Plan a longer hold.
- Hennepin County population projected at +30% by 2050 — long-run rental-demand tailwind backs the buy-and-hold thesis.
Negotiation context
- Only 10 days on market — expect competitive offers; lowballing is unlikely to land.
- 3 sale attempts since 6y ago with the ask held roughly flat each time — persistent listings suggest the price (not the market) is what's stuck; bring a comps-based counter.
Risks & watch-outs
- Watch-outs: built in 1900 — expect roof / HVAC / electrical / plumbing capex.
Questions for the listing agent
- Can we see the unit-by-unit rent roll, current vacancy, and any below-market leases? What's the average tenancy length?
- What capital expenditures (roof, boiler, parking lot, exteriors) have been made in the last 5 years, and what's planned in the next 2?
- Built in 1900 — when were the roof, HVAC, electrical panel, plumbing, and water heater last replaced?
- Is there a deadline driving the sale (1031 exchange, divorce, estate, relocation)? That informs how much negotiation room exists.
- Crime grade is F in this area — have there been break-ins, vandalism, or insurance claims at this property in the last 3 years? What carrier currently insures it and at what premium?
- The area grade is low — what's the realistic commute time and amenity access for the typical tenant pool here? Any planned neighborhood developments (good or bad) we should know about?
- What's the average days-on-market for RENTAL listings here right now (not sales)? A rising rental-DOM trend means longer vacancies and softer asking-rent achievability than the comps imply.
- What's the recent tenant-quality profile in this submarket — average credit score on applications, eviction rate, late-payment / NSF rate, and stable-employment percentage? A property-management company in the area should have these aggregated.
- How much new apartment / multifamily construction is in the pipeline within 1–3 miles? Heavy new supply (>2% of stock underway) typically softens rents 12–24 months out; light construction supports rent growth.
Investment metrics
- 1% rule
- 0.90% ✗
- Cap rate
- 6.51%
- Cash-on-cash
- 0.76%
- DSCR
- 1.03
- GRM
- 9.2
CMA / ARV
- ARV (on-the-fly)
- $484,866
- Comps found
- 1
Show comp detail 1 sale within ~0.75 mi
| Address | Dist | Beds/Ba | Sqft | Sold | Price | $/sf | Match |
|---|---|---|---|---|---|---|---|
| 2417 Lyndale Ave S | 0.33mi | 5/5.0 (-1) | 2,228 (+1%) | 13mo | $487,500 | $219 | 60 |
Match score weights: distance 35% · size 25% · config 20% · recency 20%. Top-matched comps best support the ARV.
Projected returns pro-forma
-3.0% appreciation · 1.93% rent growth · sell at horizon
- IRR
- -16.3%
- Equity multiple
- 0.43×
- Total profit
- $-90,515
- Equity at exit
- $84,243
- IRR
- -10.0%
- Equity multiple
- 0.42×
- Total profit
- $-92,052
- Equity at exit
- $48,851
Cash invested: $158,200 (down + closing). Projections, not guarantees.
Landlord ↔ Tenant lean methodology
- Overall (CITY)
- 34 Tenant-Leaning
- State Minnesota
- 46 Balanced · D+2
- County
- — inherits STATE
- City Minneapolis
- 34 Tenant-Leaning · D+50
ZIP-level market 55405
- Rents YoY
- 1.9%
- Active inventory
- 100
- Price-to-rent
- 18.1×
Monthly cashflow live
- Estimated rent
- $5,103 high interval (Pro) →
- Mortgage (P&I)
- −$2,963
- Tax from tax record
- −$733 /mo · $8,794/yr
- Insurance
- −$235
- HOA
- −$0
- Vacancy / Maint / Mgmt
- −$1,072
- Net cashflow
- $100
Break-even live
3-unit breakdown (identical units grouped — click to expand)
| Units | Beds | Baths | Est. rent |
|---|---|---|---|
| 1× unit | 4.0 | 2 | $2,596 |
| 2× units | 2.0 | 1 | $2,506 |
| #2 | 2.0 | 1 | $1,253 |
| #3 | 2.0 | 1 | $1,253 |
| Total (3 units) | $5,103 | ||
UW: 25.0% down · 7.5% · 30yr · 1.5% tax · 5.0% vac · 8.0% maint · 8.0% mgmt
Financing live
Cash to close
- Down payment
- $141,250
- Closing costs
- $16,950
- Reserves months
- —
- Total cash needed
- —
Loan-product check · same deal, 3 products live
Conventional
25% down · 7.5% · 30yr
- Down + closing
- —
- Monthly P&I
- —
- Monthly cashflow
- —
- DSCR
- —
- Eligible?
- —
Personal DTI + credit; lowest rate.
DSCR
20% down · 8.5% · 30yr
- Down + closing
- —
- Monthly P&I
- —
- Monthly cashflow
- —
- DSCR
- —
- Eligible?
- —
No personal income docs; deal must DSCR.
Hard money
10% down · 12.0% · 12mo
- Down + closing
- —
- Monthly P&I
- —
- Monthly cashflow
- —
- DSCR
- —
- Eligible?
- —
Short-term bridge; refi at stabilization.
Rent comps 3 comps
| Address | Beds | Baths | Sqft | Rent | $/sqft | DOM | Units | Dist |
|---|---|---|---|---|---|---|---|---|
| 2808 Colfax Ave S Unit 1250755P Minneapolis, MN | 5.0 | 3.5 | 2088 | $6,923 | $3.32 | 3d | 1 | 0.39mi |
| 911 W 31st St Unit 1 Minneapolis, MN | 6.0 | 3.0 | 2200 | $3,895 | $1.77 | 43d | 1 | 0.75mi |
| 911 W 31st St Minneapolis, MN | 6.0 | 3.0 | 2200 | $3,850 | $1.75 | 43d | 1 | 0.75mi |
Listing history 7 events
-
2026-06-18days on market $565,000 Active 10 DOM
-
2026-06-17days on market $565,000 Active 9 DOM
-
2026-06-16days on market $565,000 Active 8 DOM
-
2026-06-15days on market $565,000 Active 7 DOM
-
2026-06-13days on market $565,000 Active 5 DOM
-
2026-06-09remarks 699-char remark
-
2026-06-09$565,000 Active 1 DOM
ⓘ Source: listings_history table (triggers on properties + properties_extension) + one-shot
backfill from property_details.listing_events for pre-trigger history.
Tax reassessment forecast MN · Partial reset (capped growth)
- Current annual tax
- $8,794 · $733/mo
- Projected year-2 tax
- $8,794 · $733/mo
- Expected delta
- $0/yr ($0/mo · 0.0%)
ⓘ Screening estimate from a state-policy table — verify with the county assessor before closing.
Climate risk First Street
- Flood 1/10 Low FEMA zone X (unshaded) · 0% chance over 30 yrs
- Wildfire 1/10 Low
- Heat 2/10 Low 7 d/yr ≥99°F today · 14 d/yr by 30 yrs out
- Wind 2/10 Low
- Air quality 2/10 Low 1 unhealthy d/yr today · 1 by 30 yrs out
Nearby sold comps map
Loading sold comps map…
Walkable amenities ~0.75 mi
Loading nearby amenities…
Taxation est. · year 1
- Rental income
- $61,236
- − Mortgage interest
- −$31,649
- − Property taxes
- −$8,794
- − Insurance
- −$2,825
- − Repairs & maintenance
- −$4,899
- − Management
- −$4,899
- − Depreciation
- −$16,436
- Taxable loss
- −$8,266
- Est. tax savings @ 24.0%
- +$1,984
- After-tax cash flow
- $3,186/yr
For passive investors: Depreciation is non-cash, so a rental often shows a tax loss while cash-flowing — sheltering income. Rental losses are passive: they offset passive income freely, and up to $25,000/yr can offset ordinary (W-2) income if you actively participate and your MAGI is under $100k (phasing out to $0 by $150k); unused losses carry forward. On sale, claimed depreciation is recaptured at up to 25%, and gains may owe capital-gains tax (a 1031 exchange can defer both). Figures are a year-1 estimate at your 24.0% rate — not tax advice; consult a CPA.
Schools (NCES district)
- District
- Minneapolis Public School District
- NCES district ID
- 2721240
- Math proficiency
- 35% ▼ -7.00%
- Reading proficiency
- 46% ▼ -1.00%
- Median HH income
- $50,521
- Composite
- 34.92/100
- National rank
- #5067
- State rank
- #217 of 301 in MN
Livability — Minneapolis
- Score
- 78/100
- State rank
- #110
- US rank
- #2525
Category grades
Schools grade is shown separately in the Schools card above.
Census & demographics
- Census place
- Minneapolis, MN
- County
- Hennepin County · 1,150,272 people
- City population
- 417,555
- Metro
- Minneapolis-St. Paul-Bloomington, MN-WI
- Population (ZIP)
- 17,198
- Household income
- $73,053
- Rent vs Own
- Severe rent burden
- 985.0
Population outlook (Hennepin County) Hauer SSP2
- Today (2025)
- 1,405,227 people
- By 2030
- 1,492,650 · +6.2%
- By 2040
- 1,660,157 · +18.1%
- By 2050
- 1,823,498 · +29.8%
- By 2075
- 2,221,283 · +58.1%
- By 2100
- 2,509,976 · +78.6%
Race, ethnicity, and origin ACS 2023
- Neighborhood character
- Diverse neighborhood (Simpson 0.58)
- Race & ethnicity
- White 59% Black 25% Two or more races 7% Hispanic / Latino 5% Asian 4% Native American 2%
- Hispanic origin (detail)
- Mexican 2%
- Common ancestry
- Portuguese 9% Romanian 4% Lithuanian 2%
- Foreign-born
- 10% · Canada, South Korea, Jamaica
- Languages at home
- 81% English-only · Spanish 3% Other Asian/Pacific 2% French/Haitian/Cajun 1%
Political lean MEDSL · Hennepin
- 2024 margin
- Solid D (+42.6) · D 70.2% · R 27.5% · Other 2.3%
- 2008→2024 swing
- +14.0pp toward D · 2008: 28.6pp · 2024: 42.6pp
- All cycles
- 2024: D+42.6 2020: D+43.2 2016: D+35.3 2012: D+27.1 2008: D+28.6
Not yet ingested
- Civics
- —
Market trends
- HPI YoY
- ▼ -282.04%
- Current HPI
- 242.8961
- Rent YoY
- ▲ 1.93%
- Metro
- Minneapolis-St. Paul-Bloomington, MN-WI
- State GDP YoY
- ▲ 2.41%
- F500 in state
- 34
Industry mix (Fortune 500 HQ in MN)
| Industry | F500 HQs | Revenue |
|---|---|---|
| Healthcare | 2 | $407B |
|
||
| Retail | 2 | $150B |
|
||
| Consumer Goods | 2 | $32B |
|
||
| Industrial Machinery | 2 | $6B |
|
||
| Agriculture | 1 | $40B |
|
||
| Healthcare / Medical Devices | 1 | $32B |
|
||
Price history
+534.8% since first listed13 events — show timeline
- 2026-06-09 Listed $565,000 FSBO.com
- 2021-10-21 Sold (Public Records) $530,000 Public Records
- 2021-06-03 Sold (MLS) $515,000 NORTHSTARMLS as Distributed by MLS Grid
- 2021-04-23 Pending — NORTHSTARMLS as Distributed by MLS Grid
- 2021-03-17 Price Changed $514,900 NORTHSTARMLS as Distributed by MLS Grid
- 2021-03-08 Relisted — NORTHSTARMLS as Distributed by MLS Grid
- 2021-01-30 Price Changed $524,900 NORTHSTARMLS as Distributed by MLS Grid
- 2020-09-28 Price Changed $539,900 NORTHSTARMLS as Distributed by MLS Grid
- 2020-09-09 Price Changed $574,900 NORTHSTARMLS as Distributed by MLS Grid
- 2020-09-03 Listed $599,900 NORTHSTARMLS as Distributed by MLS Grid
- 1998-12-22 Sold (Public Records) $80,000 Public Records
- 1998-12-01 Sold (Public Records) $160,000 Public Records
- 1992-01-24 Sold (Public Records) $89,000 Public Records
Property tax history
+2.3%/yrLatest (2025): $8,794 · +13.7% YoY. Source: county tax records.
Cash-flow waterfall
monthlySold comps — $/sqft
last 12 mo · ≤1 miLoading sold comps…