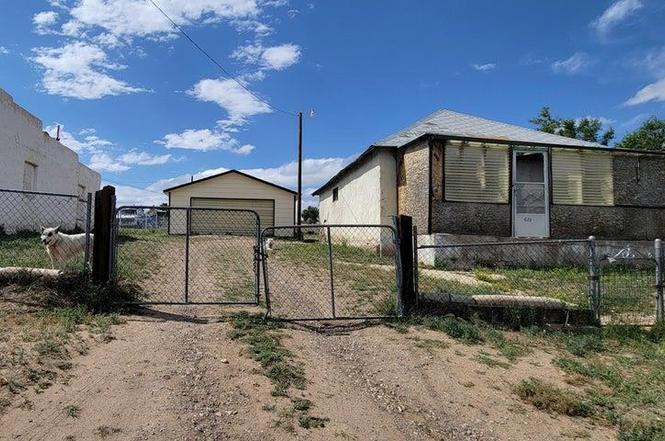
620 W 4th St · Walsenburg, CO
Flood risk 1/10 · Minimal
- FEMA flood zone
- X
- Chance of flooding over 30 yrs
- 0.0%
- Est. flood insurance / yr
- $507 – $1,088
Fire risk 5/10 · Moderate
- Est. fire insurance / yr
- $939 – $1,743
Heat risk 3/10 · Minor
- Hot days now (above 91°F)
- 6 days/yr
- Hot days in 30 yrs
- 18 days/yr
Wind risk 1/10 · Minimal
- Chance of severe wind over 30 yrs
- —
Air-quality risk 2/10 · Minimal
- Unhealthy air days now
- 0 days/yr
- Unhealthy air days in 30 yrs
- 1 days/yr
Risk factors via First Street. Map © Google.
Why this score? — see what drove the B- grade
The composite is a weighted blend of 9 inputs, each scored 0–100. Each bar is that input's sub-score; the figure is the points it added to the 100-point composite (weight × sub-score).
- Cash flow +28.7/30.0
- DSCR +10.0/10.0
- ARV discount +7.5/15.0
- 1% rule +7.0/10.0
- Livability +3.6/5.0
- Rent growth +2.5/5.0
- Condition / age +2.5/5.0
- Appreciation +2.2/10.0
- Schools +1.7/10.0
$65,000
🖨 Deal sheet 📄 Offer letter ✓ Due diligence
Listing remarks
Prime investor and builder opportunity! This 1-bedroom, 1-bath property has been fully gutted and is ready for a complete rebuild or custom renovation. Blank slate interior allows for maximum design flexibility. Detached garage is in good condition and can be incorporated into future plans or used for storage during construction. Large lot offers potential for expansion, redevelopment, or new construction (buyer to verify zoning and use). Ideal project for investors, builders, or contractors seeking value-add potential. Sold as-is.
Key facts
- Fully gutted
- Blank slate interior
- Large lot
Tags
Property features AI
Finance
- HOA & community: No association amenities
Exterior
- Parking: Detached garage
- Utilities: Public water; Public sewer
- Home design: Single-family residential; Frame, stucco and adobe construction
- Construction: Composition roof; Partial basement noted
- Exterior features: Front porch; Irregular-shaped lot
Interior
- Bedrooms: One main-level bedroom
- Bathrooms: One full bathroom on the main level
- Heating & cooling: No heating; No cooling
- Interior features: No built-in appliances listed; No fireplace
- Laundry & utility: Laundry on the main level; Partial basement
Neighborhood map
What this means for you Summary
Snapshot
- This is a 1-bed/1.0-bath single-family listed at $65k.
Deal economics
- At list price, monthly cash flow is $217 ($3k/yr) — positive.
- The deal already cash-flows at list — no discount required.
- Meets the 1% rule at list price ($777 rent vs $65k).
- Recommended offer: $57k (12.0% below list) — sets the bar for market timing.
- Cap rate 10.3% vs local median 1.7% in Walsenburg — top-decile yield for the area; either an underpriced asset or a hidden risk that comps aren't pricing in. Stress-test before assuming the spread holds.
Location & tenants
- Location reads 71/100 on livability (#80 in CO) — a middle-class / working-renter tenant base. Strengths: cost of living A+, health & safety A+, housing A; Watch: schools F, amenities F, commute F.
- Huerfano School District Re-1 (town): math 9% / reading 24% proficiency, ranked #163 of 176 in CO (top 93%) — low school quality limits family demand, transient renter base, plan for 1-2y turnover; 69% free/reduced lunch — lower-income household profile, screen leases tightly.
- Market conditions: 356 active listings in the ZIP; 51 units permitted in Huerfano County in 2024 (0 in 5+ unit buildings).
Forward outlook
- Local home prices are declining (-3.0%/yr); year-one equity from $449 of loan paydown is wiped out by about $2k of value loss. Plan a longer hold.
- Huerfano County population projected at -36% by 2050 — secular population decline; favor cash flow + early exit over multi-decade hold.
- At projected returns (-3.0% appreciation + 3.0% rent growth), your $18k cash investment doubles in ~9 years — after that, you're playing with house money.
Negotiation context
- It's been on market 170 days — a 12% lower offer ($57k) is reasonable based on typical stale-listing flexibility.
- 6 sale attempts since 6y ago with the ask held roughly flat each time — persistent listings suggest the price (not the market) is what's stuck; bring a comps-based counter.
- Current owner paid $50k; 30% above their basis — modest negotiation headroom, anchor on the comps not their cost.
Risks & watch-outs
- Watch-outs: built in 1895 — expect roof / HVAC / electrical / plumbing capex.
- Climate carrying-cost: moderate wildfire risk — expect insurance premiums to compound above CPI over the hold.
Questions for the listing agent
- It's been on market 170 days. Have you received any prior offers? Is the seller open to a 12% concession, seller financing, or rate buy-down credit?
- Built in 1895 — when were the roof, HVAC, electrical panel, plumbing, and water heater last replaced?
- Why hasn't it sold? Are there any deal-killer items the seller is aware of (foundation, flood, title, zoning, code violations)?
- Is there a deadline driving the sale (1031 exchange, divorce, estate, relocation)? That informs how much negotiation room exists.
- Schools are F-rated, which usually means shorter tenancies and higher turnover. Who's the typical renter profile here, and what's been the actual vacancy rate?
- What's the average days-on-market for RENTAL listings here right now (not sales)? A rising rental-DOM trend means longer vacancies and softer asking-rent achievability than the comps imply.
- What's the recent tenant-quality profile in this submarket — average credit score on applications, eviction rate, late-payment / NSF rate, and stable-employment percentage? A property-management company in the area should have these aggregated.
- How much new for-sale + rental construction is in the pipeline within 1–3 miles? Heavy new supply typically softens prices + rents 12–24 months out; constrained supply supports both.
Investment metrics
- 1% rule
- 1.20% ✓
- Cap rate
- 10.30%
- Cash-on-cash
- 14.31%
- DSCR
- 1.64
- GRM
- 7.0
CMA / ARV
- ARV (on-the-fly)
- $38,688
- Comps found
- 1
Show comp detail 1 sale within ~0.75 mi
| Address | Dist | Beds/Ba | Sqft | Sold | Price | $/sf | Match |
|---|---|---|---|---|---|---|---|
| 116 W 1st St | 0.48mi | 2/1.0 (+1) | 676 (+8%) | 10mo | $42,000 | $62 | 50 |
Match score weights: distance 35% · size 25% · config 20% · recency 20%. Top-matched comps best support the ARV.
Projected returns pro-forma
-3.0% appreciation · 3.0% rent growth · sell at horizon
- IRR
- 4.6%
- Equity multiple
- 1.18×
- Total profit
- $3,268
- Equity at exit
- $9,692
- IRR
- 14.1%
- Equity multiple
- 2.13×
- Total profit
- $20,560
- Equity at exit
- $5,620
Cash invested: $18,200 (down + closing). Projections, not guarantees.
Landlord ↔ Tenant lean methodology
- Overall (STATE)
- 38 Tenant-Leaning
- State Colorado
- 38 Tenant-Leaning · D+4
- County
- — inherits STATE
- City
- — inherits STATE
ZIP-level market 81089
- Home prices YoY
- -2.4%
- Active inventory
- 356
- Price-to-rent
- 7.0×
Monthly cashflow live
- Estimated rent
- $777 medium interval (Pro) →
- Mortgage (P&I)
- −$341
- Tax from tax record
- −$29 /mo · $351/yr
- Insurance
- −$27
- HOA
- −$0
- Vacancy / Maint / Mgmt
- −$163
- Net cashflow
- $217
Break-even live
UW: 25.0% down · 7.5% · 30yr · 1.5% tax · 5.0% vac · 8.0% maint · 8.0% mgmt
Financing live
Cash to close
- Down payment
- $16,250
- Closing costs
- $1,950
- Reserves months
- —
- Total cash needed
- —
Loan-product check · same deal, 3 products live
Conventional
25% down · 7.5% · 30yr
- Down + closing
- —
- Monthly P&I
- —
- Monthly cashflow
- —
- DSCR
- —
- Eligible?
- —
Personal DTI + credit; lowest rate.
DSCR
20% down · 8.5% · 30yr
- Down + closing
- —
- Monthly P&I
- —
- Monthly cashflow
- —
- DSCR
- —
- Eligible?
- —
No personal income docs; deal must DSCR.
Hard money
10% down · 12.0% · 12mo
- Down + closing
- —
- Monthly P&I
- —
- Monthly cashflow
- —
- DSCR
- —
- Eligible?
- —
Short-term bridge; refi at stabilization.
Listing history 24 events
-
2026-06-18days on market $65,000 Active 170 DOM
-
2026-06-17days on market $65,000 Active 169 DOM
-
2026-06-16days on market $65,000 Active 168 DOM
-
2026-06-15days on market $65,000 Active 167 DOM
-
2026-06-13days on market $65,000 Active 165 DOM
-
2026-06-12days on market $65,000 Active 164 DOM
-
2026-06-09days on market $65,000 Active 161 DOM
-
2026-06-08days on market $65,000 Active 160 DOM
-
2026-06-07days on market $65,000 Active 159 DOM
-
2026-06-07days on market $65,000 Active 158 DOM
-
2026-06-04days on market $65,000 Active 155 DOM
-
2026-06-02days on market $65,000 Active 154 DOM
-
2026-06-01days on market $65,000 Active 153 DOM
-
2026-05-31days on market $65,000 Active 152 DOM
-
2026-05-31days on market $65,000 Active 151 DOM
-
2025-12-31$65,000 Active
-
2025-06-28$65,000 Active
-
2024-05-14$75,000 Active
-
2024-05-14$75,000 Active
-
2022-05-31soldstatus $50,000
-
2022-05-27soldstatus $50,000
-
2021-10-01$50,000
-
2020-09-17$60,000
-
1983-08-05soldstatus $10,000
ⓘ Source: listings_history table (triggers on properties + properties_extension) + one-shot
backfill from property_details.listing_events for pre-trigger history.
Tax reassessment forecast CO · Resets to sale price
- Current annual tax
- $351 · $29/mo
- Projected year-2 tax
- $358 · $30/mo
- Expected delta
- +$7/yr (+$1/mo · 1.9%)
ⓘ Screening estimate from a state-policy table — verify with the county assessor before closing.
Climate risk First Street
- Flood 1/10 Low FEMA zone X · 0% chance over 30 yrs
- Wildfire 5/10 Major
- Heat 3/10 Moderate 6 d/yr ≥91°F today · 18 d/yr by 30 yrs out
- Wind 1/10 Low
- Air quality 2/10 Low 0 unhealthy d/yr today · 1 by 30 yrs out
Nearby sold comps map
Loading sold comps map…
Walkable amenities ~0.75 mi
Loading nearby amenities…
Taxation est. · year 1
- Rental income
- $9,330
- − Mortgage interest
- −$3,641
- − Property taxes
- −$351
- − Insurance
- −$325
- − Repairs & maintenance
- −$746
- − Management
- −$746
- − Depreciation
- −$1,891
- Taxable income
- $1,629
- Est. tax owed @ 24.0%
- −$391
- After-tax cash flow
- $2,213/yr
For passive investors: Depreciation is non-cash, so a rental often shows a tax loss while cash-flowing — sheltering income. Rental losses are passive: they offset passive income freely, and up to $25,000/yr can offset ordinary (W-2) income if you actively participate and your MAGI is under $100k (phasing out to $0 by $150k); unused losses carry forward. On sale, claimed depreciation is recaptured at up to 25%, and gains may owe capital-gains tax (a 1031 exchange can defer both). Figures are a year-1 estimate at your 24.0% rate — not tax advice; consult a CPA.
Schools (NCES district)
- District
- Huerfano School District Re-1
- NCES district ID
- 0807080
- Math proficiency
- 9% ▼ -3.00%
- Reading proficiency
- 24% ▼ -4.00%
- Median HH income
- $31,069
- Composite
- 16.56/100
- National rank
- #14243
- State rank
- #163 of 176 in CO
Livability — Walsenburg
- Score
- 71/100
- State rank
- #80
- US rank
- #7234
Category grades
Schools grade is shown separately in the Schools card above.
Census & demographics
- Census place
- Walsenburg, CO
- Population (ZIP)
- 4,810
Population outlook (Huerfano County) Hauer SSP2
- Today (2025)
- 5,963 people
- By 2030
- 5,550 · -6.9%
- By 2040
- 4,598 · -22.9%
- By 2050
- 3,849 · -35.5%
- By 2075
- 2,906 · -51.3%
- By 2100
- 2,156 · -63.8%
Race, ethnicity, and origin ACS 2023
- Neighborhood character
- Diverse neighborhood (Simpson 0.55)
- Race & ethnicity
- White 56% Hispanic / Latino 36% Two or more races 9% Native American 3%
- Hispanic origin (detail)
- Mexican 17%
- Common ancestry
- Scottish 2% Serbian 1% Romanian 1%
- Foreign-born
- 0% · Canada
- Languages at home
- 93% English-only · Spanish 6%
Political lean MEDSL · Huerfano
- 2024 margin
- Lean R (+8.6) · D 44.3% · R 52.9% · Other 2.9%
- 2008→2024 swing
- -19.8pp toward R · 2008: 11.2pp · 2024: -8.6pp
- All cycles
- 2024: R+8.6 2020: R+2.9 2016: R+6.5 2012: D+7.8 2008: D+11.2
Not yet ingested
- Civics
- —
Market trends
- HPI YoY
- ▼ -5.61%
- Current HPI
- 227.112
- Rent YoY
- —
- Metro
- —
- State GDP YoY
- ▲ 1.95%
- F500 in state
- 14
Industry mix (Fortune 500 HQ in CO)
| Industry | F500 HQs | Revenue |
|---|---|---|
| Technology Distribution | 1 | $31B |
|
||
| Food / Agriculture | 1 | $18B |
|
||
| Packaging | 1 | $14B |
|
||
| Healthcare | 1 | $13B |
|
||
| Energy | 1 | $10B |
|
||
| Technology | 1 | $4B |
|
||
Price history
+550.0% since first listed9 events — show timeline
- 2025-12-31 Listed $65,000 PARMLS
- 2025-06-28 Listed $65,000 PARMLS
- 2024-05-14 Listed $75,000 PARMLS
- 2024-05-14 Listed $75,000 SPMLS
- 2022-05-31 Sold (Public Records) $50,000 Public Records
- 2022-05-27 Sold (MLS) $50,000 PARMLS
- 2021-10-01 Listed $50,000 PARMLS
- 2020-09-17 Listed $60,000 PARMLS
- 1983-08-05 Sold (Public Records) $10,000 Public Records
Property tax history
+7.0%/yrLatest (2025): $351 · +305.7% YoY. Source: county tax records.
Cash-flow waterfall
monthlySold comps — $/sqft
last 12 mo · ≤1 miLoading sold comps…