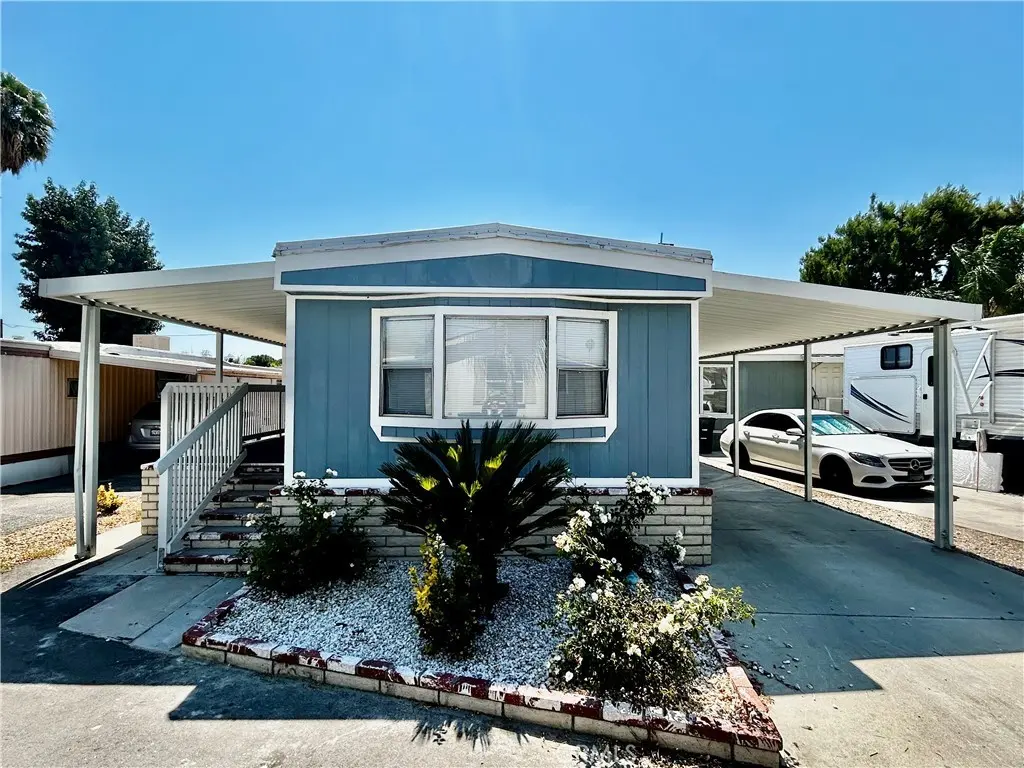
220 ELK St #118 · Hemet, CA
Flood risk 1/10 · Minimal
- FEMA flood zone
- X (unshaded)
- Chance of flooding over 30 yrs
- 0.0%
- Est. flood insurance / yr
- $507 – $1,088
Fire risk 2/10 · Minimal
- Est. fire insurance / yr
- $659 – $1,223
Heat risk 7/10 · Major
- Hot days now (above 104°F)
- 7 days/yr
- Hot days in 30 yrs
- 19 days/yr
Wind risk 1/10 · Minimal
- Chance of severe wind over 30 yrs
- —
Air-quality risk 6/10 · Moderate
- Unhealthy air days now
- 9 days/yr
- Unhealthy air days in 30 yrs
- 11 days/yr
Risk factors via First Street. Map © Google.
Why this score? — see what drove the B- grade
The composite is a weighted blend of 9 inputs, each scored 0–100. Each bar is that input's sub-score; the figure is the points it added to the 100-point composite (weight × sub-score).
- Cash flow +30.0/30.0
- 1% rule +10.0/10.0
- DSCR +10.0/10.0
- ARV discount +7.5/15.0
- Condition / age +3.8/5.0
- Rent growth +2.9/5.0
- Livability +2.6/5.0
- Schools +2.5/10.0
- Appreciation +0.0/10.0
$67,900
🖨 Deal sheet 📄 Offer letter ✓ Due diligence
Listing remarks MLS
? Charming & Move-In Ready! This beautifully updated 1-bedroom, 1-bath home combines comfort, convenience, and style. The exterior has been freshly painted and features a brand-new porch with brick steps, covered parking for two vehicles, and a spacious low-maintenance yard. Inside, enjoy fresh paint throughout and brand-new vinyl flooring. The bright, inviting living area is filled with natural light, while the kitchen offers generous cabinet and built-in storage space and comes equipped with an oven, refrigerator, and dishwasher. Additional highlights include central air and heat for year-round comfort, plus in-home washer and dryer hookups.
Key facts
- Covered parking
- Low maintenance yard
- Brand new porch
Tags
Neighborhood map
What this means for you Summary
Snapshot
- This is a 1-bed/1.0-bath manufactured listed at $68k. Condition is rated good.
Deal economics
- At list price, monthly cash flow is $709 ($9k/yr) — positive.
- The deal already cash-flows at list — no discount required.
- Meets the 1% rule at list price ($1k rent vs $68k).
- Recommended offer: $60k (12.0% below list) — sets the bar for market timing.
- Cap rate 18.8% vs local median 4.9% in Hemet — top-decile yield for the area; either an underpriced asset or a hidden risk that comps aren't pricing in. Stress-test before assuming the spread holds.
Location & tenants
- Location reads 51/100 on livability (#1,056 in CA) — a working-class tenant base; expect higher turnover. Strengths: housing A+; Watch: crime D+, schools F, amenities F.
- Hemet Unified (suburban): math 19% / reading 41% proficiency, ranked #360 of 517 in CA (top 70%) — families likely to look elsewhere, expect single-tenant / working-renter base with shorter leases; 66% free/reduced lunch — lower-income household profile, screen leases tightly.
- Market conditions: Rents rising (+1.8%/yr); 264 active listings in the ZIP; 21 comparable units currently listed for rent nearby; rentals at typical pace (median 17d on market — plan ~3-4 weeks tenant-placement turnaround); 9,195 units permitted in Riverside County in 2024 (1,512 in 5+ unit buildings).
- This rent runs 36% of the median local income ($49k/yr) — at the standard rent-burdened threshold; future hikes will face affordability resistance.
Forward outlook
- Local home prices are declining (-3.0%/yr); year-one equity from $469 of loan paydown is wiped out by about $2k of value loss. Plan a longer hold.
- Riverside County population projected at +22% by 2050 — long-run rental-demand tailwind backs the buy-and-hold thesis.
- At projected returns (-3.0% appreciation + 1.8% rent growth), your $19k cash investment doubles in ~3 years — after that, you're playing with house money.
Negotiation context
- It's been on market 312 days — a 12% lower offer ($60k) is reasonable based on typical stale-listing flexibility.
Risks & watch-outs
- Climate carrying-cost: extreme-heat days projected 7→19/yr by 2055 (HVAC capex compounding) — expect insurance premiums to compound above CPI over the hold.
Questions for the listing agent
- It's been on market 312 days. Have you received any prior offers? Is the seller open to a 12% concession, seller financing, or rate buy-down credit?
- Why hasn't it sold? Are there any deal-killer items the seller is aware of (foundation, flood, title, zoning, code violations)?
- Is there a deadline driving the sale (1031 exchange, divorce, estate, relocation)? That informs how much negotiation room exists.
- Schools are F-rated, which usually means shorter tenancies and higher turnover. Who's the typical renter profile here, and what's been the actual vacancy rate?
- Crime grade is D in this area — have there been break-ins, vandalism, or insurance claims at this property in the last 3 years? What carrier currently insures it and at what premium?
- What's the average days-on-market for RENTAL listings here right now (not sales)? A rising rental-DOM trend means longer vacancies and softer asking-rent achievability than the comps imply.
- What's the recent tenant-quality profile in this submarket — average credit score on applications, eviction rate, late-payment / NSF rate, and stable-employment percentage? A property-management company in the area should have these aggregated.
- How much new for-sale + rental construction is in the pipeline within 1–3 miles? Heavy new supply typically softens prices + rents 12–24 months out; constrained supply supports both.
Investment metrics
- 1% rule
- 2.20% ✓
- Cap rate
- 18.82%
- Cash-on-cash
- 44.74%
- DSCR
- 2.99
- GRM
- 3.8
CMA / ARV
- ARV (median comp)
- $35,363
- List price
- $67,900
- Delta
- 92.01%
- Verdict
- OVERPRICED
- Comps
- 20 within 1.0 mi
Show comp detail 12 sales within ~0.75 mi
| Address | Dist | Beds/Ba | Sqft | Sold | Price | $/sf | Match |
|---|---|---|---|---|---|---|---|
| 1895 W Devonshire Ave #135 | 0.60mi | 2/1.0 (+1) | 696 (-4%) | 5mo | $26,000 | $37 | 55 |
| 260 N Lyon Ave #12 | 0.35mi | 2/1.0 (+1) | 800 (+10%) | 14mo | $75,000 | $94 | 50 |
| 332 N Lyon Ave #25 | 0.48mi | 2/1.0 (+1) | 800 (+10%) | 8mo | $30,000 | $38 | 49 |
| 260 N Lyon Ave #120 | 0.36mi | 2/1.0 (+1) | 800 (+10%) | 16mo | $44,000 | $55 | 48 |
| 332 N Lyon Ave #17 | 0.55mi | 2/1.0 (+1) | 800 (+10%) | 8mo | $26,000 | $33 | 46 |
| 270 Santa Clara Cir | 0.64mi | 2/1.0 (+1) | 672 (-8%) | 9mo | $103,000 | $153 | 45 |
| 1895 W Devonshire Ave #93 | 0.52mi | 2/1.0 (+1) | 800 (+10%) | 13mo | $35,000 | $44 | 44 |
| 281 Santa Clara Cir | 0.66mi | 2/1.0 (+1) | 684 (-6%) | 13mo | $139,000 | $203 | 43 |
| 2205 W Acacia Ave #139 | 0.74mi | 2/1.0 (+1) | 800 (+10%) | 1mo | $85,000 | $106 | 43 |
| 430 N Palm Ave #103 | 0.62mi | 2/1.0 (+1) | 832 (+14%) | 2mo | $47,000 | $56 | 40 |
| 810 San Ynez Dr | 0.73mi | 2/2.0 (+1) | 800 (+10%) | 3mo | $85,000 | $106 | 38 |
| 1774 Santiago Way | 0.73mi | 2/1.0 (+1) | 800 (+10%) | 11mo | $125,000 | $156 | 35 |
Match score weights: distance 35% · size 25% · config 20% · recency 20%. Top-matched comps best support the ARV.
Projected returns pro-forma
-3.0% appreciation · 1.76% rent growth · sell at horizon
- IRR
- 40.4%
- Equity multiple
- 2.70×
- Total profit
- $32,331
- Equity at exit
- $10,124
- IRR
- 46.1%
- Equity multiple
- 5.16×
- Total profit
- $79,025
- Equity at exit
- $5,871
Cash invested: $19,012 (down + closing). Projections, not guarantees.
Landlord ↔ Tenant lean methodology
- Overall (STATE)
- 18 Strongly Tenant-Friendly
- State California
- 18 Strongly Tenant-Friendly · D+13
- County
- — inherits STATE
- City
- — inherits STATE
ZIP-level market 92543
- Home prices YoY
- -26.7%
- Rents YoY
- 1.8%
- Active inventory
- 264
- Price-to-rent
- 3.8×
Monthly cashflow live
- Estimated rent
- $1,491 high interval (Pro) →
- Mortgage (P&I)
- −$356
- Tax est. 1.5%
- −$85 /mo · $1,018/yr
- Insurance
- −$28
- HOA
- −$0
- Vacancy / Maint / Mgmt
- −$313
- Net cashflow
- $709
Break-even live
UW: 25.0% down · 7.5% · 30yr · 1.5% tax · 5.0% vac · 8.0% maint · 8.0% mgmt
Financing live
Cash to close
- Down payment
- $16,975
- Closing costs
- $2,037
- Reserves months
- —
- Total cash needed
- —
Loan-product check · same deal, 3 products live
Conventional
25% down · 7.5% · 30yr
- Down + closing
- —
- Monthly P&I
- —
- Monthly cashflow
- —
- DSCR
- —
- Eligible?
- —
Personal DTI + credit; lowest rate.
DSCR
20% down · 8.5% · 30yr
- Down + closing
- —
- Monthly P&I
- —
- Monthly cashflow
- —
- DSCR
- —
- Eligible?
- —
No personal income docs; deal must DSCR.
Hard money
10% down · 12.0% · 12mo
- Down + closing
- —
- Monthly P&I
- —
- Monthly cashflow
- —
- DSCR
- —
- Eligible?
- —
Short-term bridge; refi at stabilization.
Rent comps 21 comps
| Address | Beds | Baths | Sqft | Rent | $/sqft | DOM | Units | Dist |
|---|---|---|---|---|---|---|---|---|
| 201 N Valley View Dr Hemet, CA | 1.0 | 1.0 | 552 | $1,500 | $2.72 | 43d | 1 | 0.24mi |
| 2098 W Acacia Ave Hemet, CA | 1.0–3.0 | 1.0–2.0 | 895 | $1,595 | $1.78 | 1d | 1 | 0.55mi |
| 233 N Alessandro St Hemet, CA | 1.0 | 1.0 | 690 | $1,400 | $2.03 | 43d | 1 | 0.64mi |
| 199 N Inez St Apt D Hemet, CA | 1.0 | 1.0 | 650 | $1,300 | $2.00 | 7d | 1 | 0.67mi |
| 113 E Kimball Ave Unit 2 Hemet, CA | 2.0 | 1.0 | 500 | $1,295 | $2.59 | 43d | 1 | 0.74mi |
| 893 S Palm Ave Hemet, CA | 2.0 | 2.0 | 720 | $1,375 | $1.91 | 4d | 1 | 0.90mi |
| 2770 W Devonshire Ave Hemet, CA | 1.0–2.0 | 1.0–2.0 | 707 | $1,625 | $2.30 | 1d | 11 | 1.05mi |
| 3030 W Acacia Ave Hemet, CA | 1.0–3.0 | 1.0–2.0 | 892 | $1,595 | $1.79 | 1d | 10 | 1.10mi |
| 426 N Buena Vista St Hemet, CA | 2.0 | 1.0 | 680 | $1,550 | $2.28 | 3d | 1 | 1.11mi |
| 426 N Buena Vista St Apt 1 Hemet, CA | 2.0 | 1.0 | 680 | $1,550 | $2.28 | 7d | 1 | 1.11mi |
| 1025 S Gilbert St Hemet, CA | 1.0–2.0 | 1.0–2.0 | 890 | $1,820 | $2.04 | 1d | 8 | 1.13mi |
| 560 E Oakland Ave Apt P Hemet, CA | 1.0 | 1.0 | 550 | $1,325 | $2.41 | 16d | 1 | 1.17mi |
| 1000 S Gilbert St Hemet, CA | 1.0–2.0 | 1.0 | 500 | $1,170 | $2.34 | 1d | 4 | 1.18mi |
| 526 Greystone Ln Hemet, CA | 2.0 | 1.0 | 700 | $1,600 | $2.29 | 43d | 1 | 1.22mi |
| 526 Greystone Ln Hemet, CA | 2.0 | 1.0 | 700 | $1,600 | $2.29 | 17d | 1 | 1.22mi |
| 526 Greystone Ln Apt 3 Hemet, CA | 2.0 | 1.0 | 700 | $1,650 | $2.36 | 43d | 1 | 1.22mi |
| 1150 S Palm Ave Hemet, CA | 1.0 | 1.0 | 670 | $1,534 | $2.29 | 24d | 1 | 1.23mi |
| 210 N Santa Fe St Hemet, CA | 1.0 | 1.0 | 600 | $1,300 | $2.17 | 3d | 1 | 1.26mi |
| 811 E Menlo Ave Apt 12 Hemet, CA | 1.0 | 1.0 | 550 | $1,300 | $2.36 | 24d | 1 | 1.40mi |
| 811 E Menlo Ave Unit 02 Hemet, CA | 1.0 | 1.0 | 550 | $1,300 | $2.36 | 43d | 1 | 1.41mi |
| 150 S San Jacinto St Hemet, CA | 1.0–2.0 | 1.0–2.0 | 834 | $1,445 | $1.73 | 23d | 2 | 1.50mi |
Listing history 15 events
-
2026-06-18days on market $67,900 Active 312 DOM
-
2026-06-17days on market $67,900 Active 311 DOM
-
2026-06-16days on market $67,900 Active 310 DOM
-
2026-06-15days on market $67,900 Active 309 DOM
-
2026-06-13days on market $67,900 Active 307 DOM
-
2026-06-09days on market $67,900 Active 303 DOM
-
2026-06-08days on market $67,900 Active 302 DOM
-
2026-06-07days on market $67,900 Active 301 DOM
-
2026-06-04days on market $67,900 Active 298 DOM
-
2026-06-03days on market $67,900 Active 297 DOM
-
2026-06-02days on market $67,900 Active 296 DOM
-
2026-06-01days on market $67,900 Active 295 DOM
-
2026-05-31days on market $67,900 Active 294 DOM
-
2025-10-28price $67,900 661-char remark
Show marketing remark (661 chars)
? Charming & Move-In Ready! This beautifully updated 1-bedroom, 1-bath home combines comfort, convenience, and style. The exterior has been freshly painted and features a brand-new porch with brick steps, covered parking for two vehicles, and a spacious low-maintenance yard. Inside, enjoy fresh paint throughout and brand-new vinyl flooring. The bright, inviting living area is filled with natural light, while the kitchen offers generous cabinet and built-in storage space and comes equipped with an oven, refrigerator, and dishwasher. Additional highlights include central air and heat for year-round comfort, plus in-home washer and dryer hookups.
-
2025-08-10$68,900 Active 661-char remark
Show marketing remark (661 chars)
? Charming & Move-In Ready! This beautifully updated 1-bedroom, 1-bath home combines comfort, convenience, and style. The exterior has been freshly painted and features a brand-new porch with brick steps, covered parking for two vehicles, and a spacious low-maintenance yard. Inside, enjoy fresh paint throughout and brand-new vinyl flooring. The bright, inviting living area is filled with natural light, while the kitchen offers generous cabinet and built-in storage space and comes equipped with an oven, refrigerator, and dishwasher. Additional highlights include central air and heat for year-round comfort, plus in-home washer and dryer hookups.
ⓘ Source: listings_history table (triggers on properties + properties_extension) + one-shot
backfill from property_details.listing_events for pre-trigger history.
Climate risk First Street
- Flood 1/10 Low FEMA zone X (unshaded) · 0% chance over 30 yrs
- Wildfire 2/10 Low
- Heat 7/10 Severe 7 d/yr ≥104°F today · 19 d/yr by 30 yrs out
- Wind 1/10 Low
- Air quality 6/10 Major 9 unhealthy d/yr today · 11 by 30 yrs out
Nearby sold comps map
Loading sold comps map…
Walkable amenities ~0.75 mi
Loading nearby amenities…
Taxation est. · year 1
- Rental income
- $17,896
- − Mortgage interest
- −$3,803
- − Property taxes
- −$1,018
- − Insurance
- −$340
- − Repairs & maintenance
- −$1,432
- − Management
- −$1,432
- − Depreciation
- −$1,975
- Taxable income
- $7,896
- Est. tax owed @ 24.0%
- −$1,895
- After-tax cash flow
- $6,612/yr
For passive investors: Depreciation is non-cash, so a rental often shows a tax loss while cash-flowing — sheltering income. Rental losses are passive: they offset passive income freely, and up to $25,000/yr can offset ordinary (W-2) income if you actively participate and your MAGI is under $100k (phasing out to $0 by $150k); unused losses carry forward. On sale, claimed depreciation is recaptured at up to 25%, and gains may owe capital-gains tax (a 1031 exchange can defer both). Figures are a year-1 estimate at your 24.0% rate — not tax advice; consult a CPA.
Condition & rehab AI · 13 photos
This charming and move-in ready manufactured home is in good condition with fresh updates and a low-maintenance yard, making it an attractive investment.
Value-add opportunities
- Both Painting the exterior — Enhances curb appeal and value.
- Both Landscaping improvements — Enhances curb appeal and value.
- Both New flooring in common areas — Improves aesthetics and functionality.
- Both Upgrading appliances — Enhances functionality and value.
- Both Landscaping and curb appeal improvements — Enhances curb appeal and value.
Renovation cost estimate screening
Value-add ROI direction
- Both Painting the exterior — Enhances curb appeal and value. ↑
- Both Landscaping improvements — Enhances curb appeal and value. ↑
- Both New flooring in common areas — Improves aesthetics and functionality. ↑
- Both Upgrading appliances — Enhances functionality and value. ↑
- Both Landscaping and curb appeal improvements — Enhances curb appeal and value. ↑
ⓘ Cost ranges are severity-bucket heuristics (US national rule-of-thumb). Get contractor quotes + a written scope before underwriting a rehab budget.
Schools (NCES district)
- District
- Hemet Unified
- NCES district ID
- 0616920
- Math proficiency
- 19% ▼ -3.00%
- Reading proficiency
- 41% ▲ 4.00%
- Median HH income
- $39,962
- Composite
- 25.16/100
- National rank
- #7517
- State rank
- #360 of 517 in CA
Livability — Hemet
- Score
- 51/100
- State rank
- #1056
- US rank
- #25208
Category grades
Schools grade is shown separately in the Schools card above.
Census & demographics
- Census place
- Hemet, CA
- County
- Riverside County · 2,287,001 people
- City population
- 137,670
- Metro
- Riverside-San Bernardino-Ontario, CA
- Population (ZIP)
- 39,937
- Household income
- $49,396
- Rent vs Own
- Severe rent burden
- 2144.0
Population outlook (Riverside County) Hauer SSP2
- Today (2025)
- 2,664,475 people
- By 2030
- 2,802,692 · +5.2%
- By 2040
- 3,050,904 · +14.5%
- By 2050
- 3,256,783 · +22.2%
- By 2075
- 3,655,058 · +37.2%
- By 2100
- 3,766,594 · +41.4%
Race, ethnicity, and origin ACS 2023
- Neighborhood character
- Diverse neighborhood (Simpson 0.61)
- Race & ethnicity
- Hispanic / Latino 54% White 30% Two or more races 18% Black 10% Native American 2% Asian 2%
- Hispanic origin (detail)
- Mexican 48% Puerto Rican 1%
- Common ancestry
- Slovak 1% Romanian 1% Portuguese 1%
- Foreign-born
- 21% · Canada
- Languages at home
- 59% English-only · Spanish 38% Arabic 1% Tagalog/Filipino 1%
Political lean MEDSL · Riverside
- 2024 margin
- Toss-up / Even · D 48.0% · R 49.3% · Other 2.6%
- 2008→2024 swing
- -3.6pp toward R · 2008: 2.3pp · 2024: -1.3pp
- All cycles
- 2024: R+1.3 2020: D+8.0 2016: D+4.3 2012: R+0.4 2008: D+2.3
Not yet ingested
- Civics
- —
Market trends
- HPI YoY
- ▼ -147.46%
- Current HPI
- 405.1277
- Rent YoY
- ▲ 1.76%
- Metro
- Riverside-San Bernardino-Ontario, CA
- State GDP YoY
- ▲ 3.21%
- F500 in state
- 116
Industry mix (Fortune 500 HQ in CA)
| Industry | F500 HQs | Revenue |
|---|---|---|
| Technology | 27 | $1,492B |
|
||
| Financial Services | 3 | $174B |
|
||
| Retail | 3 | $44B |
|
||
| Insurance | 3 | $26B |
|
||
| Media / Entertainment | 2 | $115B |
|
||
| Pharmaceuticals / Biotech | 2 | $62B |
|
||
Price history
-1.5% since first listed2 events — show timeline
- 2025-10-28 Price Changed $67,900 CRMLS
- 2025-08-10 Listed $68,900 CRMLS
Cash-flow waterfall
monthlySold comps — $/sqft
last 12 mo · ≤1 miLoading sold comps…