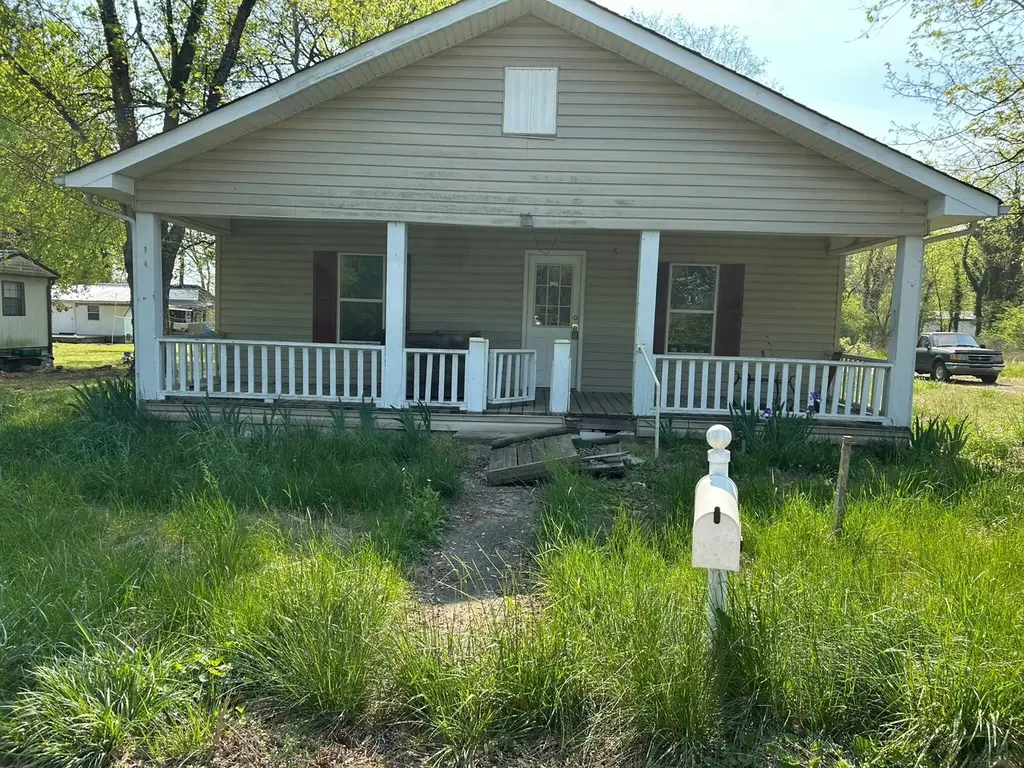
459 Pikeville Ave · Graysville, TN
Flood risk 3/10 · Minor
- FEMA flood zone
- X (unshaded)
- Chance of flooding over 30 yrs
- 0.2%
- Est. flood insurance / yr
- $507 – $1,088
Fire risk 5/10 · Moderate
- Est. fire insurance / yr
- $949 – $1,763
Heat risk 6/10 · Moderate
- Hot days now (above 105°F)
- 8 days/yr
- Hot days in 30 yrs
- 23 days/yr
Wind risk 4/10 · Minor
- Chance of severe wind over 30 yrs
- 10.0%
Air-quality risk 3/10 · Minor
- Unhealthy air days now
- 2 days/yr
- Unhealthy air days in 30 yrs
- 3 days/yr
Risk factors via First Street. Map © Google.
Why this score? — see what drove the B+ grade
The composite is a weighted blend of 9 inputs, each scored 0–100. Each bar is that input's sub-score; the figure is the points it added to the 100-point composite (weight × sub-score).
- Cash flow +30.0/30.0
- 1% rule +10.0/10.0
- DSCR +10.0/10.0
- Appreciation +10.0/10.0
- ARV discount +7.5/15.0
- Livability +2.9/5.0
- Schools +2.8/10.0
- Rent growth +2.5/5.0
- Condition / age +2.5/5.0
$69,900
🖨 Deal sheet (PDF) 📄 Offer letter ✓ Due diligence
Listing remarks MLS
The House is a Fixer Upper.
Key facts
- 0.56 acre lot
- Built 1940
- Listed 26 days
Neighborhood map
What this means for you Summary
Snapshot
- This is a 2-bed/1.0-bath single-family listed at $70k.
Deal economics
- At list price, monthly cash flow is $494 ($6k/yr) — positive.
- The deal already cash-flows at list — no discount required.
- Meets the 1% rule at list price ($1k rent vs $70k).
- Recommended offer: $69k (1.5% below list) — sets the bar for market timing.
Location & tenants
- Location reads 58/100 on livability (#298 in TN) — a working-class tenant base; expect higher turnover. Strengths: cost of living A+, housing A+; Watch: health & safety C-, amenities F, commute F.
- Rhea County (rural): math 35% / reading 31% proficiency, ranked #38 of 139 in TN (top 27%) — families likely to look elsewhere, expect single-tenant / working-renter base with shorter leases.
- Zoned schools: Graysville Elementary School (math 22% / reading 27%, grade F, #546 of 952 statewide, top 61%, 229 students, 0% FRL); Rhea Middle School (math 39% / reading 26%, grade F, #81 of 333 statewide, top 26%, 556 students, 0% FRL); Rhea County High School (math 24% / reading 35%, grade F, #86 of 332 statewide, top 27%, 1,500 students, 0% FRL) — zoned schools average 0% FRL vs 60% district-wide (60 pts lower); this property's tenant base skews higher-income than the district average.
- Market conditions: 50 active listings in the ZIP; 1 comparable units currently listed for rent nearby; 198 units permitted in Rhea County in 2024 (40 in 5+ unit buildings).
Forward outlook
- In year one you build about $7k of equity ($483 loan paydown + $7k appreciation (10.0% local appreciation)).
- At projected returns (10.0% appreciation + 3.0% rent growth), your $20k cash investment doubles in ~2 years — after that, you're playing with house money.
- By year 5, paydown + projected appreciation supports a ~$35k cash-out refi (75% LTV) — recoverable capital for the next deal without selling this one.
Negotiation context
- It's been on market 26 days — a 2% lower offer ($69k) is reasonable based on typical stale-listing flexibility.
- 9 sale attempts since 9y ago with the ask held roughly flat each time — persistent listings suggest the price (not the market) is what's stuck; bring a comps-based counter.
- Current owner paid $45k; list at $70k implies a 55% gain — meaningful room to come down on a strong offer.
Risks & watch-outs
- Watch-outs: built in 1940 — expect roof / HVAC / electrical / plumbing capex.
- Climate carrying-cost: moderate wildfire risk; extreme-heat days projected 8→23/yr by 2055 (HVAC capex compounding) — expect insurance premiums to compound above CPI over the hold.
Questions for the listing agent
- Built in 1940 — when were the roof, HVAC, electrical panel, plumbing, and water heater last replaced?
- Is there a deadline driving the sale (1031 exchange, divorce, estate, relocation)? That informs how much negotiation room exists.
- Schools are F-rated, which usually means shorter tenancies and higher turnover. Who's the typical renter profile here, and what's been the actual vacancy rate?
- What's the average days-on-market for RENTAL listings here right now (not sales)? A rising rental-DOM trend means longer vacancies and softer asking-rent achievability than the comps imply.
- What's the recent tenant-quality profile in this submarket — average credit score on applications, eviction rate, late-payment / NSF rate, and stable-employment percentage? A property-management company in the area should have these aggregated.
- How much new for-sale + rental construction is in the pipeline within 1–3 miles? Heavy new supply typically softens prices + rents 12–24 months out; constrained supply supports both.
Investment metrics
- 1% rule
- 1.72% ✓
- Cap rate
- 14.78%
- Cash-on-cash
- 30.30%
- DSCR
- 2.35
- GRM
- 4.9
CMA / ARV
- ARV (median comp)
- $206,695
- List price
- $69,900
- Delta
- -66.18%
- Verdict
- UNDERPRICED
- Comps
- 15 within 1.0 mi
Show comp detail 4 sales within ~0.75 mi
| Address | Dist | Beds/Ba | Sqft | Sold | Price | $/sf | Match |
|---|---|---|---|---|---|---|---|
| 483 Pikeville Ave | 0.02mi | 2/1.0 | 1,128 (-6%) | 2mo | $52,250 | $46 | 88 |
| 4314 Dayton Ave | 0.38mi | 2/1.0 | 1,120 (-7%) | 5mo | $103,000 | $92 | 67 |
| 4696 Cranmore Cove Rd | 0.56mi | 3/1.0 (+1) | 1,242 (+4%) | 6mo | $235,000 | $189 | 58 |
| 150 Harmon Rd | 0.54mi | 3/1.5 (+1) | 1,100 (-8%) | 4mo | $240,000 | $218 | 50 |
Match score weights: distance 35% · size 25% · config 20% · recency 20%. Top-matched comps best support the ARV.
Projected returns pro-forma
10.0% appreciation · 3.0% rent growth · sell at horizon
- IRR
- 47.3%
- Equity multiple
- 4.55×
- Total profit
- $69,547
- Equity at exit
- $62,971
- IRR
- 41.2%
- Equity multiple
- 10.20×
- Total profit
- $180,051
- Equity at exit
- $135,800
Cash invested: $19,572 (down + closing). Projections, not guarantees.
Landlord ↔ Tenant lean methodology
- Overall (STATE)
- 87 Strongly Landlord-Friendly
- State Tennessee
- 87 Strongly Landlord-Friendly · R+13
- County
- — inherits STATE
- City
- — inherits STATE
ZIP-level market 37338
- Home prices YoY
- 3.6%
- Active inventory
- 50
- Price-to-rent
- 4.9×
Monthly cashflow live
- Estimated rent
- $1,200 medium interval (Pro) →
- Mortgage (P&I)
- −$367
- Tax from tax record
- −$58 /mo · $697/yr
- Insurance
- −$29
- HOA
- −$0
- Lot rent
- −$0
- Vacancy / Maint / Mgmt
- −$252
- Net cashflow
- $494
Break-even live
Sensitivity live
| Price | -10% $534 | -5% $514 | +0% $494 | +5% $474 | +10% $455 |
|---|---|---|---|---|---|
| Rent | -10% $399 | -5% $447 | +0% $494 | +5% $542 | +10% $589 |
| Rate | -1.0pp $529 | -0.5pp $512 | base $494 | +0.5pp $476 | +1.0pp $458 |
UW: 25.0% down · 7.5% · 30yr · 1.5% tax · 5.0% vac · 8.0% maint · 8.0% mgmt
Financing live
Cash to close
- Down payment
- $17,475
- Closing costs
- $2,097
- Reserves months
- —
- Total cash needed
- —
Loan-product check · same deal, 3 products live
Conventional
25% down · 7.5% · 30yr
- Down + closing
- —
- Monthly P&I
- —
- Monthly cashflow
- —
- DSCR
- —
- Eligible?
- —
Personal DTI + credit; lowest rate.
DSCR
20% down · 8.5% · 30yr
- Down + closing
- —
- Monthly P&I
- —
- Monthly cashflow
- —
- DSCR
- —
- Eligible?
- —
No personal income docs; deal must DSCR.
Hard money
10% down · 12.0% · 12mo
- Down + closing
- —
- Monthly P&I
- —
- Monthly cashflow
- —
- DSCR
- —
- Eligible?
- —
Short-term bridge; refi at stabilization.
Rent comps 1 comps
| Address | Beds | Baths | Sqft | Rent | $/sqft | DOM | Units | Dist |
|---|---|---|---|---|---|---|---|---|
| 210 6th St Graysville, TN | 2.0 | 1.0 | 1092 | $1,200 | $1.10 | 16d | 1 | 0.16mi |
Listing history 24 events
-
2026-05-05status Pending 27-char remark
Show marketing remark (27 chars)
The House is a Fixer Upper.
-
2026-04-10$69,900 Active 27-char remark
Show marketing remark (27 chars)
The House is a Fixer Upper.
-
2026-04-09$69,900 Active 27-char remark
Show marketing remark (27 chars)
The House is a Fixer Upper.
-
2026-01-20
-
2025-01-09soldstatus $45,100
-
2025-01-06soldstatus $45,100
-
2025-01-06soldstatus $45,100 Closed
-
2025-01-06soldstatus $45,100 Closed
-
2024-12-19status Pending
-
2024-12-19status Pending
-
2024-12-02Active
-
2024-12-02Active
-
2024-10-04status Pending
-
2024-10-04historical
-
2024-09-27price $75,900
-
2024-09-27status Active
-
2024-09-04status Pending
-
2024-09-03price $89,000
-
2024-08-28$99,900 Active
-
2017-09-01soldstatus $50,000
-
2017-09-01soldstatus $50,000
-
2017-09-01soldstatus $50,000
-
2017-07-06$58,500
-
2017-07-06$58,500
ⓘ Source: listings_history table (triggers on properties + properties_extension) + one-shot
backfill from property_details.listing_events for pre-trigger history.
Tax reassessment forecast TN · Resets to sale price
- Current annual tax
- $697 · $58/mo
- Projected year-2 tax
- $697 · $58/mo
- Expected delta
- $0/yr ($0/mo · 0.0%)
ⓘ Screening estimate from a state-policy table — verify with the county assessor before closing.
Climate risk First Street
- Flood 3/10 Moderate FEMA zone X (unshaded) · 20% chance over 30 yrs
- Wildfire 5/10 Major
- Heat 6/10 Major 8 d/yr ≥105°F today · 23 d/yr by 30 yrs out
- Wind 4/10 Moderate 10% chance of damaging wind over 30 yrs
- Air quality 3/10 Moderate 2 unhealthy d/yr today · 3 by 30 yrs out
Nearby sold comps map
Loading sold comps map…
Walkable amenities ~0.75 mi
Loading nearby amenities…
Taxation est. · year 1
- Rental income
- $14,400
- − Mortgage interest
- −$3,915
- − Property taxes
- −$697
- − Insurance
- −$350
- − Repairs & maintenance
- −$1,152
- − Management
- −$1,152
- − Depreciation
- −$2,033
- Taxable income
- $5,101
- Est. tax owed @ 24.0%
- −$1,224
- After-tax cash flow
- $4,707/yr
For passive investors: Depreciation is non-cash, so a rental often shows a tax loss while cash-flowing — sheltering income. Rental losses are passive: they offset passive income freely, and up to $25,000/yr can offset ordinary (W-2) income if you actively participate and your MAGI is under $100k (phasing out to $0 by $150k); unused losses carry forward. On sale, claimed depreciation is recaptured at up to 25%, and gains may owe capital-gains tax (a 1031 exchange can defer both). Figures are a year-1 estimate at your 24.0% rate — not tax advice; consult a CPA.
Schools (NCES district)
- District
- Rhea County
- NCES district ID
- 4703510
- Math proficiency
- 35% ▼ -7.00%
- Reading proficiency
- 31% ▼ -5.00%
- Median HH income
- $39,059
- Composite
- 27.67/100
- National rank
- #6917
- State rank
- #38 of 139 in TN
Livability — Graysville
- Score
- 58/100
- State rank
- #298
- US rank
- #20631
Category grades
Schools grade is shown separately in the Schools card above.
Census & demographics
- Census place
- Graysville, TN
- Population (ZIP)
- 2,991
Population outlook (Rhea County) Hauer SSP2
- Today (2025)
- 33,187 people
- By 2030
- 33,482 · +0.9%
- By 2040
- 33,786 · +1.8%
- By 2050
- 33,730 · +1.6%
- By 2075
- 33,603 · +1.3%
- By 2100
- 33,312 · +0.4%
Race, ethnicity, and origin ACS 2023
- Neighborhood character
- Predominantly White (88%)
- Race & ethnicity
- White 88% Two or more races 7% Hispanic / Latino 4% Black 3%
- Common ancestry
- Iranian 2% Lithuanian 2% Slovak 1%
- Foreign-born
- 1% · Canada
- Languages at home
- 98% English-only · Spanish 1%
Political lean MEDSL · Rhea
- 2024 margin
- Solid R (+66.9) · D 16.0% · R 82.9% · Other 1.1%
- 2008→2024 swing
- -20.7pp toward R · 2008: -46.2pp · 2024: -66.9pp
- All cycles
- 2024: R+66.9 2020: R+63.7 2016: R+61.3 2012: R+48.9 2008: R+46.2
Not yet ingested
- Civics
- —
Market trends
- HPI YoY
- ▲ 12.62%
- Current HPI
- 365.0013
- Rent YoY
- —
- Metro
- —
- State GDP YoY
- ▲ 2.78%
- F500 in state
- 22
Industry mix (Fortune 500 HQ in TN)
| Industry | F500 HQs | Revenue |
|---|---|---|
| Healthcare | 3 | $91B |
|
||
| Retail | 3 | $72B |
|
||
| Transportation / Logistics | 1 | $88B |
|
||
| Paper / Packaging | 1 | $19B |
|
||
| Insurance | 1 | $13B |
|
||
| Energy | 1 | $12B |
|
||
Price history
+19.5% since first listed24 events — show timeline
- 2026-05-05 Pending — GCAR
- 2026-04-10 Listed $69,900 RCAOR
- 2026-04-09 Listed $69,900 GCAR
- 2026-01-20 Listed — REALTRACS as Distributed by MLS Grid
- 2025-01-09 Sold (Public Records) $45,100 Public Records
- 2025-01-06 Sold (MLS) $45,100 Knoxville MLS
- 2025-01-06 Sold (MLS) $45,100 UCMLS
- 2025-01-06 Sold (MLS) $45,100 REALTRACS as Distributed by MLS Grid
- 2024-12-19 Pending — UCMLS
- 2024-12-19 Pending — Knoxville MLS
- 2024-12-02 Listed — Knoxville MLS
- 2024-12-02 Listed — UCMLS
- 2024-10-04 Pending — REALTRACS as Distributed by MLS Grid
- 2024-10-04 Listing Removed — REALTRACS as Distributed by MLS Grid
- 2024-09-27 Price Changed $75,900 REALTRACS as Distributed by MLS Grid
- 2024-09-27 Relisted — REALTRACS as Distributed by MLS Grid
- 2024-09-04 Pending — REALTRACS as Distributed by MLS Grid
- 2024-09-03 Price Changed $89,000 REALTRACS as Distributed by MLS Grid
- 2024-08-28 Listed $99,900 REALTRACS as Distributed by MLS Grid
- 2017-09-01 Sold (Public Records) $50,000 Public Records
- 2017-09-01 Sold (MLS) $50,000 GCAR
- 2017-09-01 Sold (MLS) $50,000 RCAOR
- 2017-07-06 Listed $58,500 GCAR
- 2017-07-06 Listed $58,500 RCAOR
Property tax history
+5.8%/yrLatest (2025): $697 · +0.0% YoY. Source: county tax records.
Cash-flow waterfall
monthlySold comps — $/sqft
last 12 mo · ≤1 miLoading sold comps…