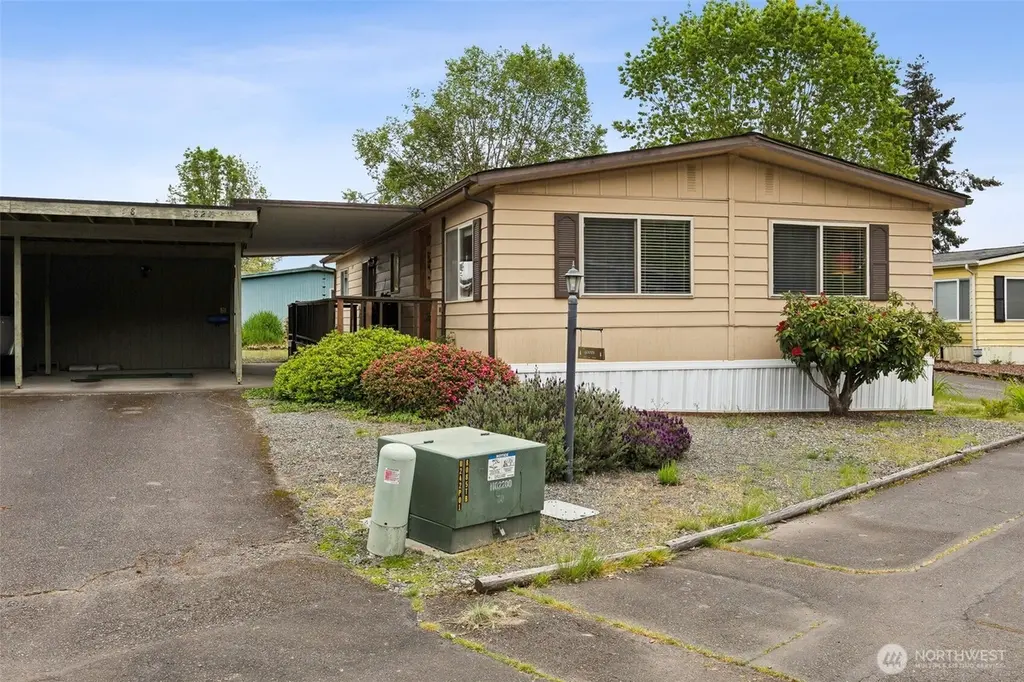
2827 34th Avenue Ct E #58 · Waller, WA
Flood risk 8/10 · Major
- FEMA flood zone
- AE
- Chance of flooding over 30 yrs
- 0.78%
- Est. flood insurance / yr
- $1,737 – $8,500
Fire risk 3/10 · Minor
- Est. fire insurance / yr
- $604 – $1,122
Heat risk 3/10 · Minor
- Hot days now (above 88°F)
- 7 days/yr
- Hot days in 30 yrs
- 16 days/yr
Wind risk 1/10 · Minimal
- Chance of severe wind over 30 yrs
- —
Air-quality risk 7/10 · Major
- Unhealthy air days now
- 10 days/yr
- Unhealthy air days in 30 yrs
- 12 days/yr
Risk factors via First Street. Map © Google.
Why this score? — see what drove the B- grade
The composite is a weighted blend of 9 inputs, each scored 0–100. Each bar is that input's sub-score; the figure is the points it added to the 100-point composite (weight × sub-score).
- Cash flow +30.0/30.0
- 1% rule +10.0/10.0
- DSCR +10.0/10.0
- Schools +5.4/10.0
- Livability +3.5/5.0
- Rent growth +2.5/5.0
- Condition / age +2.5/5.0
- ARV discount +2.1/15.0
- Appreciation +0.0/10.0
$99,999
🖨 Deal sheet (PDF) 📄 Offer letter ✓ Due diligence
Listing remarks
Welcome to sought-after Tacoma Country Estates 55+ community, conveniently located just off River Road with easy access to shopping, dining, medical facilities, and the Emerald Queen Casino. This well-maintained doublewide home offers 2 bedrooms and 1.75 baths with a spacious open-concept layout perfect for comfortable everyday living. All appliances included. Additional features include double-pane windows, forced air electric heat with a newer heat pump, newer roof, covered deck, storage space, carport, and a low-maintenance yard designed for easy living.
Key facts
- Covered deck
- Newer roof
- Newer heat pump
Tags
Property features AI
Finance
- Other: Buyer to verify school assignments; Bus line nearby; Directions: Just off River Road at Tacoma Country Estates — pull in, take first right, go around corner to first home on left
- Financial info: Listed for cash; Land lease fee applies
- HOA & community: Located in Tacoma Country Estates (senior community); Park approved for sale; High-speed internet available
Exterior
- Parking: RV parking available in park
- Utilities: Electric energy; Community water; Septic sewer; Electric water heater; Power provided by TPU
- Home design: Manufactured double-wide home; One level; Faces east; Has view
- Construction: Metal/vinyl construction; Composition roof; Concrete ribbon foundation with tie downs; Manufactured house structure
- Exterior features: Metal/vinyl exterior; Patio/porch/deck; Awnings; Double pane windows; Paved lot
Interior
- Kitchen: Dishwasher; Refrigerator; Stove/Range
- Bedrooms: 2 bedrooms
- Flooring: Vinyl; Carpet
- Bathrooms: 1 full bath; 1 three-quarter bath
- Heating & cooling: Forced air heating; Heat pump for heating and cooling
- Interior features: Water heater; Vaulted ceilings; Bath off primary; Dining room; Entry; Family room; Kitchen with eating space; Living room; Utility room
- Laundry & utility: Washer; Dryer
Neighborhood map
What this means for you Summary
Snapshot
- This is a 2-bed/2.0-bath manufactured listed at $100k.
Deal economics
- At list price, monthly cash flow is $859 ($10k/yr) — positive.
- The deal already cash-flows at list — no discount required.
- Meets the 1% rule at list price ($2k rent vs $100k).
- Recommended offer: $97k (3.0% below list) — sets the bar for market timing.
- Cap rate 21.7% vs local median 2.2% in Waller — top-decile yield for the area; either an underpriced asset or a hidden risk that comps aren't pricing in. Stress-test before assuming the spread holds.
Location & tenants
- Location reads 69/100 on livability (#254 in WA) — a middle-class / working-renter tenant base. Strengths: employment A+, housing A+, crime B; Watch: health & safety C-, commute D+, schools D-.
- Puyallup School District (suburban): math 53% / reading 66% proficiency, ranked #52 of 291 in WA (top 18%) — acceptable for families but not a draw, mixed tenant base, ~2y average lease.
- Market conditions: 28 active listings in the ZIP; 6 comparable units currently listed for rent nearby; rentals at typical pace (median 26d on market — plan ~3-4 weeks tenant-placement turnaround); 3,209 units permitted in Pierce County in 2024 (1,269 in 5+ unit buildings).
Forward outlook
- Local home prices are declining (-3.0%/yr); year-one equity from $691 of loan paydown is wiped out by about $3k of value loss. Plan a longer hold.
- Pierce County population projected at +26% by 2050 — long-run rental-demand tailwind backs the buy-and-hold thesis.
- At projected returns (-3.0% appreciation + 3.0% rent growth), your $28k cash investment doubles in ~4 years — after that, you're playing with house money.
Negotiation context
- It's been on market 45 days — a 3% lower offer ($97k) is reasonable based on typical stale-listing flexibility.
- 2 sale attempts since 4y ago with the ask held roughly flat each time — persistent listings suggest the price (not the market) is what's stuck; bring a comps-based counter.
- Current owner paid $80k; 25% above their basis — modest negotiation headroom, anchor on the comps not their cost.
Risks & watch-outs
- Watch-outs: flood insurance adds $427/mo.
- Climate carrying-cost: in FEMA flood zone AE (mandatory federal flood insurance) — expect insurance premiums to compound above CPI over the hold.
Questions for the listing agent
- It's been on market 45 days. Have you received any prior offers? Is the seller open to a 3% concession, seller financing, or rate buy-down credit?
- Built in 1975 — when were the roof, HVAC, electrical panel, plumbing, and water heater last replaced?
- What's the actual annual flood-insurance premium (NFIP or private), and is the property in a SFHA with mandatory coverage?
- Is there a deadline driving the sale (1031 exchange, divorce, estate, relocation)? That informs how much negotiation room exists.
- Schools are D-rated, which usually means shorter tenancies and higher turnover. Who's the typical renter profile here, and what's been the actual vacancy rate?
- What's the average days-on-market for RENTAL listings here right now (not sales)? A rising rental-DOM trend means longer vacancies and softer asking-rent achievability than the comps imply.
- What's the recent tenant-quality profile in this submarket — average credit score on applications, eviction rate, late-payment / NSF rate, and stable-employment percentage? A property-management company in the area should have these aggregated.
- How much new for-sale + rental construction is in the pipeline within 1–3 miles? Heavy new supply typically softens prices + rents 12–24 months out; constrained supply supports both.
Investment metrics
- 1% rule
- 2.43% ✓
- Cap rate
- 21.72%
- Cash-on-cash
- 55.09%
- DSCR
- 3.45
- GRM
- 3.4
CMA / ARV
- ARV (median comp)
- $89,213
- List price
- $99,999
- Delta
- 12.09%
- Verdict
- OVERPRICED
- Comps
- 2 within 1.0 mi
Show comp detail 6 sales within ~0.75 mi
| Address | Dist | Beds/Ba | Sqft | Sold | Price | $/sf | Match |
|---|---|---|---|---|---|---|---|
| 3007 35th Ave Ct E | 0.13mi | 2/2.0 | 1,248 (-7%) | 14mo | $59,999 | $48 | 71 |
| 3213 28th Street Ct E #35 | 0.12mi | 2/2.0 | 1,146 (-14%) | 3mo | $89,950 | $78 | 68 |
| 2912 36th Ave E #4 | 0.11mi | 2/2.0 | 1,440 (+8%) | 23mo | $140,000 | $97 | 63 |
| 3021 28th ST Ct E #7 | 0.23mi | 3/2.0 (+1) | 1,404 (+5%) | 20mo | $133,500 | $95 | 59 |
| 3102 35th Avenue Ct E | 0.17mi | 3/2.0 (+1) | 1,502 (+12%) | 19mo | $50,000 | $33 | 51 |
| 3821 Waller Rd E | 0.63mi | 2/2.0 | 1,470 (+10%) | 20mo | $350,000 | $238 | 37 |
Match score weights: distance 35% · size 25% · config 20% · recency 20%. Top-matched comps best support the ARV.
Projected returns pro-forma
-3.0% appreciation · 3.0% rent growth · sell at horizon
- IRR
- 32.8%
- Equity multiple
- 2.38×
- Total profit
- $38,765
- Equity at exit
- $14,910
- IRR
- 39.9%
- Equity multiple
- 4.76×
- Total profit
- $105,269
- Equity at exit
- $8,646
Cash invested: $28,000 (down + closing). Projections, not guarantees.
Landlord ↔ Tenant lean methodology
- Overall (STATE)
- 28 Tenant-Leaning
- State Washington
- 28 Tenant-Leaning · D+8
- County
- — inherits STATE
- City
- — inherits STATE
ZIP-level market 98443
- Active inventory
- 28
- Price-to-rent
- 3.4×
Monthly cashflow live
- Estimated rent
- $2,430 high interval (Pro) →
- Mortgage (P&I)
- −$524
- Tax from tax record
- −$68 /mo · $821/yr
- Insurance
- −$42
- Flood insurance flood zone
- −$427 /mo · $5,118/yr
- HOA
- −$0
- Vacancy / Maint / Mgmt
- −$510
- Net cashflow
- $859
Break-even live
Sensitivity live
| Price | -10% $916 | -5% $887 | +0% $859 | +5% $831 | +10% $802 |
|---|---|---|---|---|---|
| Rent | -10% $667 | -5% $763 | +0% $859 | +5% $955 | +10% $1,051 |
| Rate | -1.0pp $909 | -0.5pp $884 | base $859 | +0.5pp $833 | +1.0pp $807 |
UW: 25.0% down · 7.5% · 30yr · 1.5% tax · 5.0% vac · 8.0% maint · 8.0% mgmt
Financing live
Cash to close
- Down payment
- $25,000
- Closing costs
- $3,000
- Reserves months
- —
- Total cash needed
- —
Loan-product check · same deal, 3 products live
Conventional
25% down · 7.5% · 30yr
- Down + closing
- —
- Monthly P&I
- —
- Monthly cashflow
- —
- DSCR
- —
- Eligible?
- —
Personal DTI + credit; lowest rate.
DSCR
20% down · 8.5% · 30yr
- Down + closing
- —
- Monthly P&I
- —
- Monthly cashflow
- —
- DSCR
- —
- Eligible?
- —
No personal income docs; deal must DSCR.
Hard money
10% down · 12.0% · 12mo
- Down + closing
- —
- Monthly P&I
- —
- Monthly cashflow
- —
- DSCR
- —
- Eligible?
- —
Short-term bridge; refi at stabilization.
Rent comps 6 comps
| Address | Beds | Baths | Sqft | Rent | $/sqft | DOM | Units | Dist |
|---|---|---|---|---|---|---|---|---|
| 2036 E Morton St Tacoma, WA | 3.0 | 1.0 | 889 | $3,300 | $3.71 | 0d | 1 | 0.82mi |
| 4600 16th St E Fife, WA | 1.0–3.0 | 1.0–2.0 | 925 | $1,800 | $1.95 | 25d | 1 | 1.00mi |
| 1207 46th Ave E Unit 1207 Fife, WA | 3.0 | 1.5 | 1200 | $1,995 | $1.66 | 25d | 1 | 1.27mi |
| 4919 Waller Rd E Unit 4919 Tacoma, WA | 2.0 | 1.0 | 1200 | $2,300 | $1.92 | 25d | 1 | 1.33mi |
| 1405 E 38th St Tacoma, WA | 3.0 | 2.5 | 1265 | $2,650 | $2.09 | 0d | 1 | 1.40mi |
| 3562 E L St Tacoma, WA | 3.0 | 2.0 | 1200 | $2,397 | $2.00 | 25d | 1 | 1.49mi |
Listing history 19 events
-
2026-06-21days on market $99,999 Active 45 DOM
-
2026-06-18days on market $99,999 Active 42 DOM
-
2026-06-17days on market $99,999 Active 41 DOM
-
2026-06-16days on market $99,999 Active 40 DOM
-
2026-06-15days on market $99,999 Active 39 DOM
-
2026-06-13days on market $99,999 Active 37 DOM
-
2026-06-13days on market $99,999 Active 36 DOM
-
2026-06-09days on market $99,999 Active 33 DOM
-
2026-06-08days on market $99,999 Active 32 DOM
-
2026-06-07days on market $99,999 Active 31 DOM
-
2026-06-04days on market $99,999 Active 28 DOM
-
2026-06-03days on market $99,999 Active 27 DOM
-
2026-06-02days on market $99,999 Active 26 DOM
-
2026-06-01days on market $99,999 Active 25 DOM
-
2026-05-31days on market $99,999 Active 24 DOM
-
2026-05-07$99,999 Active
-
2022-05-18soldstatus $79,900 Closed
-
2022-04-30status Pending
-
2022-04-09$79,900 Active
ⓘ Source: listings_history table (triggers on properties + properties_extension) + one-shot
backfill from property_details.listing_events for pre-trigger history.
Tax reassessment forecast WA · Resets to sale price
- Current annual tax
- $821 · $68/mo
- Projected year-2 tax
- $980 · $82/mo
- Expected delta
- +$159/yr (+$13/mo · 19.3%)
ⓘ Screening estimate from a state-policy table — verify with the county assessor before closing.
Climate risk First Street
- Flood 8/10 Severe FEMA zone AE · 78% chance over 30 yrs
- Wildfire 3/10 Moderate
- Heat 3/10 Moderate 7 d/yr ≥88°F today · 16 d/yr by 30 yrs out
- Wind 1/10 Low
- Air quality 7/10 Severe 10 unhealthy d/yr today · 12 by 30 yrs out
Nearby sold comps map
Loading sold comps map…
Walkable amenities ~0.75 mi
Loading nearby amenities…
Taxation est. · year 1
- Rental income
- $29,164
- − Mortgage interest
- −$5,601
- − Property taxes
- −$821
- − Insurance
- −$5,618
- − Repairs & maintenance
- −$2,333
- − Management
- −$2,333
- − Depreciation
- −$2,909
- Taxable income
- $9,547
- Est. tax owed @ 24.0%
- −$2,291
- After-tax cash flow
- $8,016/yr
For passive investors: Depreciation is non-cash, so a rental often shows a tax loss while cash-flowing — sheltering income. Rental losses are passive: they offset passive income freely, and up to $25,000/yr can offset ordinary (W-2) income if you actively participate and your MAGI is under $100k (phasing out to $0 by $150k); unused losses carry forward. On sale, claimed depreciation is recaptured at up to 25%, and gains may owe capital-gains tax (a 1031 exchange can defer both). Figures are a year-1 estimate at your 24.0% rate — not tax advice; consult a CPA.
Schools (NCES district)
- District
- Puyallup School District
- NCES district ID
- 5306960
- Math proficiency
- 53% ▬ 0.00%
- Reading proficiency
- 66% ▬ 0.00%
- Median HH income
- $68,291
- Composite
- 54.01/100
- National rank
- #3006
- State rank
- #52 of 291 in WA
Livability — Waller
- Score
- 69/100
- State rank
- #254
- US rank
- #8174
Category grades
Schools grade is shown separately in the Schools card above.
Census & demographics
- Census place
- Waller, WA
- City population
- 5,787
- Population (ZIP)
- 5,787
Population outlook (Pierce County) Hauer SSP2
- Today (2025)
- 956,648 people
- By 2030
- 1,010,862 · +5.7%
- By 2040
- 1,113,170 · +16.4%
- By 2050
- 1,206,524 · +26.1%
- By 2075
- 1,436,425 · +50.2%
- By 2100
- 1,563,654 · +63.5%
Race, ethnicity, and origin ACS 2023
- Neighborhood character
- Predominantly White (71%)
- Race & ethnicity
- White 71% Two or more races 11% Hispanic / Latino 10% Asian 6% Black 2%
- Hispanic origin (detail)
- Mexican 8%
- Common ancestry
- Portuguese 5% Italian 4% Romanian 3%
- Foreign-born
- 7% · Canada, Vietnam, South Korea
- Languages at home
- 89% English-only · Spanish 5% Other Asian/Pacific 2% German/W. Germanic 1%
Political lean MEDSL · Pierce
- 2024 margin
- D (+10.8) · D 53.9% · R 43.1% · Other 3.0%
- 2008→2024 swing
- -1.4pp toward R · 2008: 12.2pp · 2024: 10.8pp
- All cycles
- 2024: D+10.8 2020: D+11.2 2016: D+7.5 2012: D+11.0 2008: D+12.2
Not yet ingested
- Civics
- —
Market trends
- HPI YoY
- ▼ -375.05%
- Current HPI
- 299.5307
- Rent YoY
- —
- Metro
- —
- State GDP YoY
- ▲ 4.65%
- F500 in state
- 22
Industry mix (Fortune 500 HQ in WA)
| Industry | F500 HQs | Revenue |
|---|---|---|
| Retail | 2 | $269B |
|
||
| Technology / Retail | 1 | $638B |
|
||
| Technology | 1 | $245B |
|
||
| Telecommunications | 1 | $38B |
|
||
| Food / Beverage | 1 | $36B |
|
||
| Automotive / Trucks | 1 | $34B |
|
||
Price history
+25.2% since first listed4 events — show timeline
- 2026-05-07 Listed $99,999 NWMLS as Distributed by MLS Grid
- 2022-05-18 Sold (MLS) $79,900 NWMLS as Distributed by MLS Grid
- 2022-04-30 Pending — NWMLS as Distributed by MLS Grid
- 2022-04-09 Listed $79,900 NWMLS as Distributed by MLS Grid
Property tax history
+11.0%/yrLatest (2026): $821 · +3.2% YoY. Source: county tax records.
Cash-flow waterfall
monthlySold comps — $/sqft
last 12 mo · ≤1 miLoading sold comps…