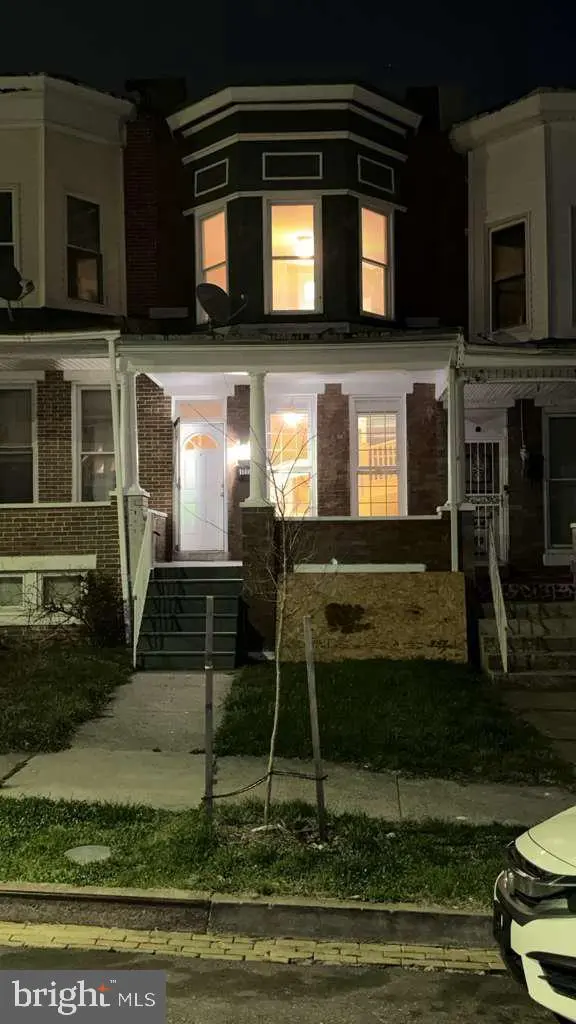
1717 N Pulaski St · Baltimore, MD
Flood risk 1/10 · Minimal
- FEMA flood zone
- X (unshaded)
- Chance of flooding over 30 yrs
- 0.0%
- Est. flood insurance / yr
- $473 – $860
Fire risk 1/10 · Minimal
- Est. fire insurance / yr
- $755 – $1,403
Heat risk 7/10 · Major
- Hot days now (above 103°F)
- 7 days/yr
- Hot days in 30 yrs
- 15 days/yr
Wind risk 6/10 · Moderate
- Chance of severe wind over 30 yrs
- 27.0%
Air-quality risk 3/10 · Minor
- Unhealthy air days now
- 3 days/yr
- Unhealthy air days in 30 yrs
- 4 days/yr
Risk factors via First Street. Map © Google.
Why this score? — see what drove the D grade
The composite is a weighted blend of 9 inputs, each scored 0–100. Each bar is that input's sub-score; the figure is the points it added to the 100-point composite (weight × sub-score).
- Cash flow +15.0/30.0
- ARV discount +7.5/15.0
- 1% rule +5.0/10.0
- DSCR +5.0/10.0
- Rent growth +4.2/5.0
- Livability +3.8/5.0
- Condition / age +2.5/5.0
- Schools +1.0/10.0
- Appreciation +0.0/10.0
$40,000
🖨 Deal sheet 📄 Offer letter ✓ Due diligence
Listing remarks
Welcome to this well maintained 3‑bed, 1‑bath brick townhome in the Easterwood community of West Baltimore. Enjoy a bright kitchen ample cabinet space. The dining room a nice arched entryway, and the cozy living room offers three large windows for plenty of sunlight, and the front porch is for inviting evenings. Upstairs, you’ll find spacious bedrooms with new carpet and paint. The clean concrete basement offers storage space with a rear entrance. Relax on the classic front porch and enjoy easy access to shopping, transit, schools, and Coppin State University. A perfect blend of charm, space, and conveniently located just Blocks from Easterwood Park, supermarkets, subway stations, and
Key facts
- Nearby attractions
- Mondawmin mall
- Built 1915
Tags
Property features AI
Finance
- Other: Improvement assessed value $45,100; Land assessed value $20,000; Annual taxes listed
- Financial info: Ground rent $120 paid semi-annually; Ownership interest: Ground Rent
Exterior
- Parking: On-street parking
- Utilities: Public water; Public sewer; Natural gas heating fuel
- Home design: Interior townhouse/rowhouse; Brick construction
- Construction: Brick exterior; Other foundation; Above-grade and below-grade structures
- Exterior features: Lot dimensions approximately 14-3 x 85; Ground rent exists (semi-annual payment)
Interior
- Bedrooms: Three bedrooms on the first upper level
- Bathrooms: One full bathroom
- Heating & cooling: Forced air heating; Electric cooling fuel
- Interior features: Unfinished basement
Neighborhood map
What this means for you Summary
Snapshot
- This is a 3-bed/1.0-bath townhouse listed at $40k.
Deal economics
- At list price, monthly cash flow is $1k ($12k/yr) — positive.
- The deal already cash-flows at list — no discount required.
- Meets the 1% rule at list price ($2k rent vs $40k).
- Cap rate 36.6% vs local median 6.0% in Baltimore — top-decile yield for the area; either an underpriced asset or a hidden risk that comps aren't pricing in. Stress-test before assuming the spread holds.
Location & tenants
- Location reads 76/100 on livability (#90 in MD, #3,396 nationally) — a middle-class / working-renter tenant base. Strengths: amenities A+, commute A+, housing A+; Watch: schools D, crime F.
- Baltimore City Public Schools (urban): math 7% / reading 16% proficiency, ranked #24 of 24 in MD (top 100%) — low school quality limits family demand, transient renter base, plan for 1-2y turnover; 79% free/reduced lunch — lower-income household profile, screen leases tightly.
- Market conditions: Rents rising fast (+6.6%/yr); 331 active listings in the ZIP; 40 comparable units currently listed for rent nearby; rentals at typical pace (median 24d on market — plan ~3-4 weeks tenant-placement turnaround); 40% of comp listings sitting > 30 days — soft ceiling on asking rent; lower-income renter base — watch delinquency; 1,273 units permitted in Baltimore city in 2024 (1,104 in 5+ unit buildings).
- At $1,691/mo this rent would consume 53% of the median local household income ($38k/yr) (locally 2921% of renters already pay >50% of income on rent) — very limited rent-growth headroom before tenants either downsize or default.
Forward outlook
- Local home prices are declining (-3.0%/yr); year-one equity from $277 of loan paydown is wiped out by about $1k of value loss. Plan a longer hold.
- Baltimore County population projected to shrink 4% by 2050 — rents likely to lag national; underwrite the cash flow, not the appreciation.
- At projected returns (-3.0% appreciation + 6.6% rent growth), your $11k cash investment doubles in ~1 year — after that, you're playing with house money.
Negotiation context
- Only 8 days on market — expect competitive offers; lowballing is unlikely to land.
- 5 sale attempts since 23y ago with the ask held roughly flat each time — persistent listings suggest the price (not the market) is what's stuck; bring a comps-based counter.
Risks & watch-outs
- Watch-outs: property tax is 2.9% of price; built in 1915 — expect roof / HVAC / electrical / plumbing capex.
- Climate carrying-cost: major wind risk, 27% chance of damaging wind over 30y; extreme-heat days projected 7→15/yr by 2055 (HVAC capex compounding) — expect insurance premiums to compound above CPI over the hold.
Questions for the listing agent
- Built in 1915 — when were the roof, HVAC, electrical panel, plumbing, and water heater last replaced?
- Property tax is high relative to price — has the assessment been appealed recently, and will the sale trigger a re-assessment?
- Is there a deadline driving the sale (1031 exchange, divorce, estate, relocation)? That informs how much negotiation room exists.
- Schools are D-rated, which usually means shorter tenancies and higher turnover. Who's the typical renter profile here, and what's been the actual vacancy rate?
- Crime grade is F in this area — have there been break-ins, vandalism, or insurance claims at this property in the last 3 years? What carrier currently insures it and at what premium?
- The area grade is low — what's the realistic commute time and amenity access for the typical tenant pool here? Any planned neighborhood developments (good or bad) we should know about?
- What's the average days-on-market for RENTAL listings here right now (not sales)? A rising rental-DOM trend means longer vacancies and softer asking-rent achievability than the comps imply.
- What's the recent tenant-quality profile in this submarket — average credit score on applications, eviction rate, late-payment / NSF rate, and stable-employment percentage? A property-management company in the area should have these aggregated.
- How much new for-sale + rental construction is in the pipeline within 1–3 miles? Heavy new supply typically softens prices + rents 12–24 months out; constrained supply supports both.
Investment metrics
- 1% rule
- 4.23% ✓
- Cap rate
- 36.63%
- Cash-on-cash
- 108.35%
- DSCR
- 5.82
- GRM
- 2.0
CMA / ARV
- ARV (median comp)
- $89,860
- List price
- $40,000
- Delta
- 9.06%
- Verdict
- FAIR
- Comps
- 20 within 1.0 mi
Show comp detail 12 sales within ~0.75 mi
| Address | Dist | Beds/Ba | Sqft | Sold | Price | $/sf | Match |
|---|---|---|---|---|---|---|---|
| 1815 N Pulaski St | 0.06mi | 3/1.0 | — | 0mo | $28,000 | — | 84 |
| 2032 Walbrook Ave | 0.19mi | 3/1.0 | — | 0mo | $30,000 | — | 78 |
| 1601 Ruxton Ave | 0.23mi | 3/1.0 | 1,568 | 1mo | $90,000 | $57 | 76 |
| 1828 Walbrook Ave | 0.26mi | 3/1.0 | — | 0mo | $64,000 | — | 75 |
| 2117 N Smallwood St | 0.29mi | 3/2.5 | 1,680 | 1mo | $192,000 | $114 | 67 |
| 2009 Ruxton Ave | 0.28mi | 4/2.0 (+1) | 1,600 | 1mo | $234,000 | $146 | 65 |
| 1121 Mckean Ave | 0.50mi | 3/1.0 | 792 | 1mo | $40,000 | $51 | 63 |
| 1920 N Bentalou St | 0.25mi | 4/3.5 (+1) | 1,928 | 1mo | $255,000 | $132 | 60 |
| 1647 W North Ave | 0.39mi | 4/2.0 (+1) | — | 1mo | $36,000 | — | 60 |
| 2032 Ruxton Ave | 0.33mi | 4/3.5 (+1) | — | 1mo | $255,000 | — | 56 |
| 1732 Braddish Ave | 0.55mi | 2/1.0 (-1) | — | 0mo | $60,000 | — | 56 |
| 1934 W Lafayette Ave | 0.65mi | 3/1.0 | — | 1mo | $60,000 | — | 56 |
Match score weights: distance 35% · size 25% · config 20% · recency 20%. Top-matched comps best support the ARV.
Projected returns pro-forma
-3.0% appreciation · 6.63% rent growth · sell at horizon
- IRR
- —
- Equity multiple
- 6.75×
- Total profit
- $64,385
- Equity at exit
- $5,964
- IRR
- —
- Equity multiple
- 15.96×
- Total profit
- $167,533
- Equity at exit
- $3,458
Cash invested: $11,200 (down + closing). Projections, not guarantees.
Landlord ↔ Tenant lean methodology
- Overall (CITY)
- 12 Strongly Tenant-Friendly
- State Maryland
- 27 Tenant-Leaning · D+14
- County
- — inherits STATE
- City Baltimore
- 12 Strongly Tenant-Friendly · D+58
ZIP-level market 21217
- Rents YoY
- 6.6%
- Active inventory
- 331
- Price-to-rent
- 2.0×
Monthly cashflow live
- Estimated rent
- $1,691 high interval (Pro) →
- Mortgage (P&I)
- −$210
- Tax from tax record
- −$98 /mo · $1,177/yr
- Insurance
- −$17
- HOA
- −$0
- Vacancy / Maint / Mgmt
- −$355
- Net cashflow
- $1,011
Break-even live
UW: 25.0% down · 7.5% · 30yr · 1.5% tax · 5.0% vac · 8.0% maint · 8.0% mgmt
Financing live
Cash to close
- Down payment
- $10,000
- Closing costs
- $1,200
- Reserves months
- —
- Total cash needed
- —
Loan-product check · same deal, 3 products live
Conventional
25% down · 7.5% · 30yr
- Down + closing
- —
- Monthly P&I
- —
- Monthly cashflow
- —
- DSCR
- —
- Eligible?
- —
Personal DTI + credit; lowest rate.
DSCR
20% down · 8.5% · 30yr
- Down + closing
- —
- Monthly P&I
- —
- Monthly cashflow
- —
- DSCR
- —
- Eligible?
- —
No personal income docs; deal must DSCR.
Hard money
10% down · 12.0% · 12mo
- Down + closing
- —
- Monthly P&I
- —
- Monthly cashflow
- —
- DSCR
- —
- Eligible?
- —
Short-term bridge; refi at stabilization.
Rent comps 40 comps
| Address | Beds | Baths | Sqft | Rent | $/sqft | DOM | Units | Dist |
|---|---|---|---|---|---|---|---|---|
| 1700 N Pulaski St Baltimore, MD | 3.0 | 1.5 | — | $2,500 | — | 43d | 1 | 0.02mi |
| 2003 Westwood Ave Unit 2003 Baltimore, MD | 4.0 | 2.0 | — | $1,950 | — | 43d | 1 | 0.05mi |
| 2014 Westwood Ave Baltimore, MD | 3.0 | 1.5 | — | $1,350 | — | 43d | 1 | 0.06mi |
| 1655 N Smallwood St Unit First Baltimore, MD | 3.0 | 2.0 | — | $1,300 | — | 4d | 1 | 0.08mi |
| 1610 N Smallwood St Baltimore, MD | 3.0 | 1.5 | — | $1,700 | — | 17d | 1 | 0.13mi |
| 1722 N Monroe St Baltimore, MD | 3.0 | 1.5 | 1000 | $1,350 | $1.35 | 24d | 1 | 0.15mi |
| 2002 Presstman St Baltimore, MD | 3.0 | 1.0 | — | $1,475 | — | 24d | 1 | 0.19mi |
| 1816 N Bentalou St Baltimore, MD | 3.0 | 2.0 | 1350 | $1,700 | $1.26 | 24d | 1 | 0.19mi |
| 1816 N Bentalou St Baltimore, MD | 3.0 | 2.0 | 1350 | $1,700 | $1.26 | 11d | 1 | 0.19mi |
| 1930 N Payson St Baltimore, MD | 2.0 | 2.0 | 980 | $1,500 | $1.53 | 24d | 1 | 0.19mi |
| 1501 N Payson St Baltimore, MD | 3.0 | 1.0 | 1400 | $1,550 | $1.11 | 43d | 1 | 0.20mi |
| 1616 N Fulton Ave Baltimore, MD | 3.0 | 2.0 | 1620 | $1,795 | $1.11 | 4d | 1 | 0.25mi |
| 1617 Moreland Ave Baltimore, MD | 2.0 | 1.0 | — | $1,250 | — | 43d | 1 | 0.26mi |
| 1617 Moreland Ave Baltimore, MD | 2.0 | 1.0 | 900 | $1,450 | $1.61 | 24d | 1 | 0.26mi |
| 1617-A Moreland Ave Unit 2nd Flr Baltimore, MD | 2.0 | 1.0 | 1500 | $1,400 | $0.93 | 43d | 1 | 0.26mi |
| 1729 N Fulton Ave Baltimore, MD | 3.0 | 2.0 | 1081 | $1,795 | $1.66 | 43d | 1 | 0.27mi |
| 1810 Presstman St Baltimore, MD | 3.0 | 1.0 | — | $1,300 | — | 3d | 1 | 0.28mi |
| 2405 W North Ave Baltimore, MD | 4.0 | 3.0 | 1826 | $1,900 | $1.04 | 4d | 1 | 0.29mi |
| 2407 W North Ave Unit 1 Baltimore, MD | 3.0 | 1.0 | — | $1,400 | — | 43d | 1 | 0.29mi |
| 2204 Clifton Ave Baltimore, MD | 3.0 | 1.0 | 1400 | $1,450 | $1.04 | 4d | 1 | 0.30mi |
| 1617 N Warwick Ave Baltimore, MD | 3.0 | 1.0 | — | $1,695 | — | 24d | 1 | 0.32mi |
| 1806 N Mount St Baltimore, MD | 3.0 | 3.0 | 1200 | $1,700 | $1.42 | 20d | 1 | 0.32mi |
| 2128 N Pulaski St Baltimore, MD | 4.0 | 3.0 | 2166 | $2,200 | $1.02 | 43d | 1 | 0.33mi |
| 1433 N Fulton Ave Baltimore, MD | 2.0 | 1.0 | 1200 | $1,500 | $1.25 | 43d | 1 | 0.35mi |
| 1516 N Mount St Baltimore, MD | 3.0 | 1.5 | 1830 | $1,750 | $0.96 | 14d | 1 | 0.35mi |
| 1624 Westwood Ave Baltimore, MD | 3.0 | 2.0 | 1000 | $1,900 | $1.90 | 43d | 1 | 0.37mi |
| 1607 Clifton Ave Baltimore, MD | 3.0 | 1.0 | — | $1,600 | — | 44d | 1 | 0.40mi |
| 1605 Clifton Ave Baltimore, MD | 2.0 | 1.0 | — | $1,500 | — | 44d | 1 | 0.40mi |
| 1703 Lorman St Baltimore, MD | 3.0 | 1.5 | — | $1,000 | — | 4d | 1 | 0.41mi |
| 2614 Pennsylvania Ave Baltimore, MD | 1.0–3.0 | 1.0–2.0 | 982 | $1,141 | $1.16 | 4d | 4 | 0.42mi |
| 2636 Pennsylvania Ave Baltimore, MD | 1.0–2.0 | 1.0 | 846 | $956 | $1.13 | 24d | 4 | 0.42mi |
| 1614 N Calhoun St Baltimore, MD | 2.0 | 1.0 | 950 | $1,300 | $1.37 | 43d | 1 | 0.44mi |
| 1645 N Calhoun St Apt 202 Baltimore, MD | 2.0 | 1.0 | 650 | $1,199 | $1.84 | 43d | 1 | 0.44mi |
| 1534 N Stricker St Baltimore, MD | 2.0 | 1.5 | 900 | $1,475 | $1.64 | 14d | 1 | 0.49mi |
| 1599 Retreat St Baltimore, MD | 3.0 | 2.5 | — | $1,900 | — | 43d | 1 | 0.51mi |
| 1562 N Woodyear St Baltimore, MD | 2.0 | 1.5 | 788 | $1,325 | $1.68 | 24d | 1 | 0.51mi |
| 1917 Riggs Ave Baltimore, MD | 2.0 | 3.5 | — | $1,900 | — | 14d | 1 | 0.51mi |
| 2505 Woodbrook Ave Baltimore, MD | 4.0 | 2.0 | 1256 | $1,745 | $1.39 | 2d | 1 | 0.52mi |
| 1729 Braddish Ave Baltimore, MD | 2.0 | 2.0 | — | $1,500 | — | 11d | 1 | 0.53mi |
| 2636 W North Ave Baltimore, MD | 2.0–3.0 | 1.0–2.0 | 975 | $1,475 | $1.51 | 4d | 1 | 0.53mi |
Listing history 24 events
-
2026-06-18days on market $40,000 Active 8 DOM
-
2026-06-17days on market $40,000 Active 7 DOM
-
2026-06-16days on market $40,000 Active 6 DOM
-
2026-06-15days on market $40,000 Active 5 DOM
-
2026-06-13pricedays on market $40,000 Active 3 DOM
-
2026-06-07days on market $98,000 Active 81 DOM
-
2026-06-04days on market $98,000 Active 78 DOM
-
2026-06-03days on market $98,000 Active 77 DOM
-
2026-06-02days on market $98,000 Active 76 DOM
-
2026-06-01days on market $98,000 Active 75 DOM
-
2026-05-31days on market $98,000 Active 74 DOM
-
2026-04-24price $98,000 762-char remark
-
2026-03-18$125,000 Active 762-char remark
-
2024-03-17historical $1,100
-
2024-01-20$1,100
-
2023-12-14historical $1,100
-
2023-11-14price $1,100
-
2023-10-11$1,300
-
2021-01-27soldstatus $52,000
-
2020-11-13soldstatus $10,000
-
2004-03-15soldstatus $15,900
-
2004-01-20historical
-
2003-12-29$17,900
-
1997-03-21soldstatus $46,000
ⓘ Source: listings_history table (triggers on properties + properties_extension) + one-shot
backfill from property_details.listing_events for pre-trigger history.
Tax reassessment forecast MD · Partial reset (capped growth)
- Current annual tax
- $1,177 · $98/mo
- Projected year-2 tax
- $1,177 · $98/mo
- Expected delta
- $0/yr ($0/mo · 0.0%)
ⓘ Screening estimate from a state-policy table — verify with the county assessor before closing.
Climate risk First Street
- Flood 1/10 Low FEMA zone X (unshaded) · 0% chance over 30 yrs
- Wildfire 1/10 Low
- Heat 7/10 Severe 7 d/yr ≥103°F today · 15 d/yr by 30 yrs out
- Wind 6/10 Major 27% chance of damaging wind over 30 yrs
- Air quality 3/10 Moderate 3 unhealthy d/yr today · 4 by 30 yrs out
Nearby sold comps map
Loading sold comps map…
Walkable amenities ~0.75 mi
Loading nearby amenities…
Taxation est. · year 1
- Rental income
- $20,291
- − Mortgage interest
- −$2,241
- − Property taxes
- −$1,177
- − Insurance
- −$200
- − Repairs & maintenance
- −$1,623
- − Management
- −$1,623
- − Depreciation
- −$1,164
- Taxable income
- $12,263
- Est. tax owed @ 24.0%
- −$2,943
- After-tax cash flow
- $9,193/yr
For passive investors: Depreciation is non-cash, so a rental often shows a tax loss while cash-flowing — sheltering income. Rental losses are passive: they offset passive income freely, and up to $25,000/yr can offset ordinary (W-2) income if you actively participate and your MAGI is under $100k (phasing out to $0 by $150k); unused losses carry forward. On sale, claimed depreciation is recaptured at up to 25%, and gains may owe capital-gains tax (a 1031 exchange can defer both). Figures are a year-1 estimate at your 24.0% rate — not tax advice; consult a CPA.
Schools (NCES district)
- District
- Baltimore City Public Schools
- NCES district ID
- 2400090
- Math proficiency
- 7% ▼ -9.00%
- Reading proficiency
- 16% ▼ -5.00%
- Median HH income
- $42,108
- Composite
- 10.08/100
- National rank
- #9805
- State rank
- #24 of 24 in MD
Livability — Baltimore
- Score
- 76/100
- State rank
- #90
- US rank
- #3396
Category grades
Schools grade is shown separately in the Schools card above.
Census & demographics
- Census place
- Baltimore, MD
- County
- Baltimore City · 558,601 people
- City population
- 588,727
- Metro
- Baltimore-Columbia-Towson, MD
- Population (ZIP)
- 30,792
- Household income
- $38,409
- Rent vs Own
- Severe rent burden
- 2921.0
Population outlook (Baltimore County) Hauer SSP2
- Today (2025)
- 624,249 people
- By 2030
- 621,541 · -0.4%
- By 2040
- 609,756 · -2.3%
- By 2050
- 597,249 · -4.3%
- By 2075
- 552,236 · -11.5%
- By 2100
- 513,934 · -17.7%
Race, ethnicity, and origin ACS 2023
- Neighborhood character
- Predominantly Black (81%)
- Race & ethnicity
- Black 81% White 12% Two or more races 4% Hispanic / Latino 2% Asian 2%
- Common ancestry
- Romanian 1% Hispanic 1% Italian 1%
- Foreign-born
- 5% · Canada, China, South Korea
- Languages at home
- 94% English-only · Spanish 2% French/Haitian/Cajun 1% Chinese 1%
Political lean MEDSL · Baltimore
- 2024 margin
- Solid D (+73.0) · D 85.2% · R 12.2% · Other 2.6%
- 2008→2024 swing
- -2.5pp toward R · 2008: 75.5pp · 2024: 73.0pp
- All cycles
- 2024: D+73.0 2020: D+76.6 2016: D+74.6 2012: D+76.4 2008: D+75.5
Not yet ingested
- Civics
- —
Market trends
- HPI YoY
- ▼ -187.20%
- Current HPI
- 104.2102
- Rent YoY
- ▲ 6.63%
- Metro
- Baltimore-Columbia-Towson, MD
- State GDP YoY
- ▲ 2.97%
- F500 in state
- 12
Industry mix (Fortune 500 HQ in MD)
| Industry | F500 HQs | Revenue |
|---|---|---|
| Aerospace / Defense | 1 | $71B |
|
||
| Utilities | 1 | $25B |
|
||
| Hotels | 1 | $24B |
|
||
| Consumer Goods | 1 | $7B |
|
||
| Real Estate | 1 | $6B |
|
||
| Chemicals | 1 | $2B |
|
||
Price history
-13.0% since first listed15 events — show timeline
- 2026-06-10 Listed $40,000 BRIGHT MLS
- 2026-06-07 Listing Removed — BRIGHT MLS
- 2026-04-24 Price Changed $98,000 BRIGHT MLS
- 2026-03-18 Listed $125,000 BRIGHT MLS
- 2024-03-17 Rental Removed $1,100 APPFOLIO
- 2024-01-20 Listed for Rent $1,100 APPFOLIO
- 2023-12-14 Rental Removed $1,100 APPFOLIO
- 2023-11-14 Price Changed $1,100 APPFOLIO
- 2023-10-11 Listed for Rent $1,300 APPFOLIO
- 2021-01-27 Sold (Public Records) $52,000 Public Records
- 2020-11-13 Sold (Public Records) $10,000 Public Records
- 2004-03-15 Sold (MLS) $15,900 MRIS
- 2004-01-20 Delisted — MRIS
- 2003-12-29 Listed $17,900 MRIS
- 1997-03-21 Sold (Public Records) $46,000 Public Records
Property tax history
+1.1%/yrLatest (2025): $1,177 · +5.7% YoY. Source: county tax records.
Cash-flow waterfall
monthlySold comps — $/sqft
last 12 mo · ≤1 miLoading sold comps…