116 N Main St · Gilman, IL
Flood risk No data
- FEMA flood zone
- —
- Chance of flooding over 30 yrs
- —
- Est. flood insurance / yr
- —
Fire risk No data
- Est. fire insurance / yr
- —
Heat risk No data
- Hot days now (above threshold)
- —
- Hot days in 30 yrs
- —
Wind risk No data
- Chance of severe wind over 30 yrs
- —
Air-quality risk No data
- Unhealthy air days now
- —
- Unhealthy air days in 30 yrs
- —
Risk factors via First Street. Map © Google.
Why this score? — see what drove the B+ grade
The composite is a weighted blend of 9 inputs, each scored 0–100. Each bar is that input's sub-score; the figure is the points it added to the 100-point composite (weight × sub-score).
- Cash flow +30.0/30.0
- ARV discount +15.0/15.0
- 1% rule +10.0/10.0
- DSCR +10.0/10.0
- Livability +3.1/5.0
- Schools +2.6/10.0
- Rent growth +2.5/5.0
- Condition / age +2.2/5.0
- Appreciation +0.0/10.0
$58,900
🖨 Deal sheet (PDF) 📄 Offer letter ✓ Due diligence
Listing remarks
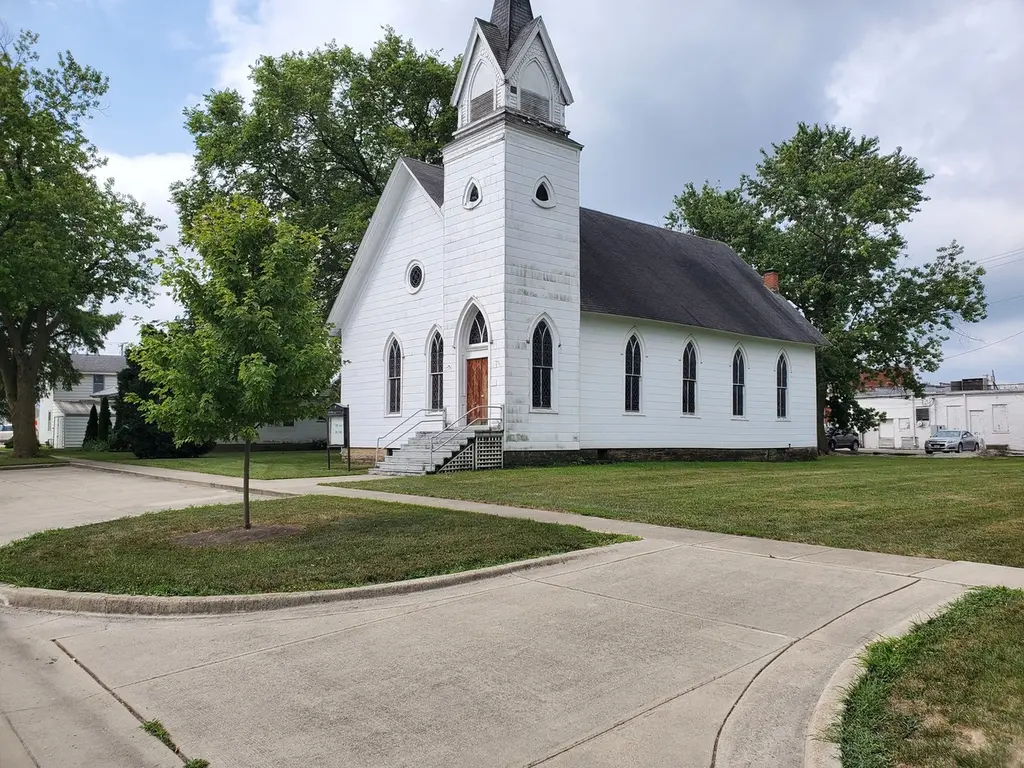
Original Presbyterian Church located near downtown Gilman built in 1886 as indicated by the Cornerstone built into the foundation. Inside full of History with pews, pianos, church bell, and stained-glass windows still present! Church and extra lot are zoned residential but certain variances to convert to a business would be considered by the town boards. Personal property and some pews do not stay but most all church related items do stay. Call for details.
Key facts
- 0.43 acre lot
- 4 parking spots
- Built 1886
Property features AI
Finance
- Other: Zoning: Other; Parcel numbers on file; Directions: Rte.24/45 through Gilman, then North on Main Street
- Financial info: Special service area: Yes
- HOA & community: No master association fee required
Exterior
- Parking: Off-street parking for 4 vehicles; Other parking features
- Utilities: Lot size about 0.25–0.49 acre; Lot dimensions approximately 125 x 150; Lot and size from county records
- Home design: Detached single-family home; One-story; Fee simple ownership; Over 100 years old; Rebuilt/rehab not reported; Interstate access nearby
- Construction: Built before 1978
- Exterior features: Sidewalks; Street is paved
Interior
- Kitchen: Kitchen (no appliance details provided)
- Bedrooms: 1 bedroom (master bedroom on main level); Additional bedrooms listed (Bedroom 2, Bedroom 3, Bedroom 4) — configured/usable bedroom count reported as 1
- Interior features: Foyer; Great Room; Dining Room; Family Room; Living Room; Basement is a crawl space; Total of 2 main living rooms/rooms reported
- Laundry & utility: Dedicated laundry room
Neighborhood map
What this means for you Summary
Snapshot
- This is a 1-bed/?-bath single-family listed at $59k. Condition is rated fair.
Deal economics
- At list price, monthly cash flow is $372 ($4k/yr) — positive.
- The deal already cash-flows at list — no discount required.
- Meets the 1% rule at list price ($986 rent vs $59k).
- Recommended offer: $52k (12.0% below list) — sets the bar for market timing.
Location & tenants
- Location reads 61/100 on livability (#912 in IL) — a middle-class / working-renter tenant base. Strengths: crime A+, cost of living A+, housing A+; Watch: employment C-, schools D-, amenities F.
- Iroquois West CUSD 10 (town): math 29% / reading 30% proficiency, ranked #255 of 620 in IL (top 41%) — low school quality limits family demand, transient renter base, plan for 1-2y turnover.
- Market conditions: 14 active listings in the ZIP; 14 units permitted in Iroquois County in 2024 (0 in 5+ unit buildings).
Forward outlook
- Local home prices are declining (-3.0%/yr); year-one equity from $407 of loan paydown is wiped out by about $2k of value loss. Plan a longer hold.
- Iroquois County population projected at -20% by 2050 — secular population decline; favor cash flow + early exit over multi-decade hold.
- At projected returns (-3.0% appreciation + 3.0% rent growth), your $16k cash investment doubles in ~5 years — after that, you're playing with house money.
Negotiation context
- It's been on market 1383 days — a 12% lower offer ($52k) is reasonable based on typical stale-listing flexibility.
Risks & watch-outs
- Watch-outs: built in 1886 — expect roof / HVAC / electrical / plumbing capex.
Questions for the listing agent
- It's been on market 1383 days. Have you received any prior offers? Is the seller open to a 12% concession, seller financing, or rate buy-down credit?
- Have any recent inspections been done? Can we get a copy of the seller's disclosures and any deferred-maintenance estimates?
- Built in 1886 — when were the roof, HVAC, electrical panel, plumbing, and water heater last replaced?
- Why hasn't it sold? Are there any deal-killer items the seller is aware of (foundation, flood, title, zoning, code violations)?
- Is there a deadline driving the sale (1031 exchange, divorce, estate, relocation)? That informs how much negotiation room exists.
- Schools are D-rated, which usually means shorter tenancies and higher turnover. Who's the typical renter profile here, and what's been the actual vacancy rate?
- What's the average days-on-market for RENTAL listings here right now (not sales)? A rising rental-DOM trend means longer vacancies and softer asking-rent achievability than the comps imply.
- What's the recent tenant-quality profile in this submarket — average credit score on applications, eviction rate, late-payment / NSF rate, and stable-employment percentage? A property-management company in the area should have these aggregated.
- How much new for-sale + rental construction is in the pipeline within 1–3 miles? Heavy new supply typically softens prices + rents 12–24 months out; constrained supply supports both.
Investment metrics
- 1% rule
- 1.67% ✓
- Cap rate
- 13.87%
- Cash-on-cash
- 27.07%
- DSCR
- 2.20
- GRM
- 5.0
CMA / ARV
- ARV (median comp)
- $103,616
- List price
- $58,900
- Delta
- -43.16%
- Verdict
- UNDERPRICED
- Comps
- 4 within 1.0 mi
Projected returns pro-forma
-3.0% appreciation · 3.0% rent growth · sell at horizon
- IRR
- 21.0%
- Equity multiple
- 1.86×
- Total profit
- $14,168
- Equity at exit
- $8,782
- IRR
- 29.2%
- Equity multiple
- 3.60×
- Total profit
- $42,912
- Equity at exit
- $5,093
Cash invested: $16,492 (down + closing). Projections, not guarantees.
Landlord ↔ Tenant lean methodology
- Overall (STATE)
- 43 Moderately Tenant-Leaning
- State Illinois
- 43 Moderately Tenant-Leaning · D+7
- County
- — inherits STATE
- City
- — inherits STATE
ZIP-level market 60938
- Home prices YoY
- -16.4%
- Active inventory
- 14
- Price-to-rent
- 5.0×
Monthly cashflow live
- Estimated rent
- $986 medium interval (Pro) →
- Mortgage (P&I)
- −$309
- Tax est. 1.5%
- −$74 /mo · $884/yr
- Insurance
- −$25
- HOA
- −$0
- Vacancy / Maint / Mgmt
- −$207
- Net cashflow
- $372
Break-even live
Sensitivity live
| Price | -10% $413 | -5% $392 | +0% $372 | +5% $352 | +10% $331 |
|---|---|---|---|---|---|
| Rent | -10% $294 | -5% $333 | +0% $372 | +5% $411 | +10% $450 |
| Rate | -1.0pp $402 | -0.5pp $387 | base $372 | +0.5pp $357 | +1.0pp $341 |
UW: 25.0% down · 7.5% · 30yr · 1.5% tax · 5.0% vac · 8.0% maint · 8.0% mgmt
Financing live
Cash to close
- Down payment
- $14,725
- Closing costs
- $1,767
- Reserves months
- —
- Total cash needed
- —
Loan-product check · same deal, 3 products live
Conventional
25% down · 7.5% · 30yr
- Down + closing
- —
- Monthly P&I
- —
- Monthly cashflow
- —
- DSCR
- —
- Eligible?
- —
Personal DTI + credit; lowest rate.
DSCR
20% down · 8.5% · 30yr
- Down + closing
- —
- Monthly P&I
- —
- Monthly cashflow
- —
- DSCR
- —
- Eligible?
- —
No personal income docs; deal must DSCR.
Hard money
10% down · 12.0% · 12mo
- Down + closing
- —
- Monthly P&I
- —
- Monthly cashflow
- —
- DSCR
- —
- Eligible?
- —
Short-term bridge; refi at stabilization.
Listing history 19 events
-
2026-06-21days on market $58,900 Active 1383 DOM
-
2026-06-21days on market $58,900 Active 1382 DOM
-
2026-06-18days on market $58,900 Active 1380 DOM
-
2026-06-17days on market $58,900 Active 1379 DOM
-
2026-06-16days on market $58,900 Active 1378 DOM
-
2026-06-15days on market $58,900 Active 1377 DOM
-
2026-06-13days on market $58,900 Active 1375 DOM
-
2026-06-12days on market $58,900 Active 1374 DOM
-
2026-06-09days on market $58,900 Active 1371 DOM
-
2026-06-08days on market $58,900 Active 1370 DOM
-
2026-06-07days on market $58,900 Active 1369 DOM
-
2026-06-04days on market $58,900 Active 1365 DOM
-
2026-06-02days on market $58,900 Active 1364 DOM
-
2026-06-01days on market $58,900 Active 1363 DOM
-
2026-05-31days on market $58,900 Active 1362 DOM
-
2026-05-31days on market $58,900 Active 1361 DOM
-
2024-09-05price $58,900
-
2024-05-28price $61,900
-
2022-09-07$65,500 Active
ⓘ Source: listings_history table (triggers on properties + properties_extension) + one-shot
backfill from property_details.listing_events for pre-trigger history.
Nearby sold comps map
Loading sold comps map…
Walkable amenities ~0.75 mi
Loading nearby amenities…
Taxation est. · year 1
- Rental income
- $11,835
- − Mortgage interest
- −$3,299
- − Property taxes
- −$884
- − Insurance
- −$294
- − Repairs & maintenance
- −$947
- − Management
- −$947
- − Depreciation
- −$1,713
- Taxable income
- $3,750
- Est. tax owed @ 24.0%
- −$900
- After-tax cash flow
- $3,565/yr
For passive investors: Depreciation is non-cash, so a rental often shows a tax loss while cash-flowing — sheltering income. Rental losses are passive: they offset passive income freely, and up to $25,000/yr can offset ordinary (W-2) income if you actively participate and your MAGI is under $100k (phasing out to $0 by $150k); unused losses carry forward. On sale, claimed depreciation is recaptured at up to 25%, and gains may owe capital-gains tax (a 1031 exchange can defer both). Figures are a year-1 estimate at your 24.0% rate — not tax advice; consult a CPA.
Condition & rehab AI · 12 photos
This historic church requires extensive repairs and maintenance to bring it up to a fair condition. Upgrades to the exterior, HVAC, and landscaping would significantly increase its value.
Repairs flagged
- Major siding — Severe weathering
- Major paint — Peeling and chipping
- Major roof — Shingles in poor condition
- Major HVAC — Likely outdated and inefficient
- Major landscaping — Overgrown and needs maintenance
Value-add opportunities
- Both exterior painting — Enhances curb appeal and value
- Both HVAC upgrade — Improves comfort and energy efficiency
- Both landscaping — Enhances curb appeal and value
Renovation cost estimate screening
| Repair item | Severity | Est. cost |
|---|---|---|
| siding · Severe weathering | Major | $15,000–50,000 |
| paint · Peeling and chipping | Major | $15,000–50,000 |
| roof · Shingles in poor condition | Major | $15,000–50,000 |
| HVAC · Likely outdated and inefficient | Major | $15,000–50,000 |
| landscaping · Overgrown and needs maintenance | Major | $15,000–50,000 |
| Total estimated repair cost · 5 items | $75,000–250,000 |
Value-add ROI direction
- Both exterior painting — Enhances curb appeal and value ↑
- Both HVAC upgrade — Improves comfort and energy efficiency ↑
- Both landscaping — Enhances curb appeal and value ↑
ⓘ Cost ranges are severity-bucket heuristics (US national rule-of-thumb). Get contractor quotes + a written scope before underwriting a rehab budget.
Schools (NCES district)
- District
- Iroquois West CUSD 10
- NCES district ID
- 1720180
- Math proficiency
- 29% ▼ -1.00%
- Reading proficiency
- 30% ▼ -9.00%
- Median HH income
- $47,456
- Composite
- 25.55/100
- National rank
- #7428
- State rank
- #255 of 620 in IL
Livability — Gilman
- Score
- 61/100
- State rank
- #912
- US rank
- #17705
Category grades
Schools grade is shown separately in the Schools card above.
Census & demographics
- Census place
- Gilman, IL
- City population
- 1,973
- Population (ZIP)
- 1,973
Population outlook (Iroquois County) Hauer SSP2
- Today (2025)
- 26,826 people
- By 2030
- 25,771 · -3.9%
- By 2040
- 23,589 · -12.1%
- By 2050
- 21,523 · -19.8%
- By 2075
- 17,998 · -32.9%
- By 2100
- 14,979 · -44.2%
Race, ethnicity, and origin ACS 2023
- Neighborhood character
- Predominantly White (79%)
- Race & ethnicity
- White 79% Hispanic / Latino 19% Two or more races 5%
- Hispanic origin (detail)
- Mexican 17%
- Common ancestry
- Iranian 5% Lithuanian 4% Romanian 2%
- Foreign-born
- 9% · Canada
- Languages at home
- 85% English-only · Spanish 15%
Political lean MEDSL · Iroquois
- 2024 margin
- Solid R (+57.3) · D 20.6% · R 78.0% · Other 1.4%
- 2008→2024 swing
- -27.5pp toward R · 2008: -29.8pp · 2024: -57.3pp
- All cycles
- 2024: R+57.3 2020: R+56.7 2016: R+56.0 2012: R+44.7 2008: R+29.8
Not yet ingested
- Civics
- —
Market trends
- HPI YoY
- ▼ -32.31%
- Current HPI
- 164.857
- Rent YoY
- —
- Metro
- —
- State GDP YoY
- ▲ 1.59%
- F500 in state
- 60
Industry mix (Fortune 500 HQ in IL)
| Industry | F500 HQs | Revenue |
|---|---|---|
| Insurance | 4 | $201B |
|
||
| Consumer Goods | 4 | $87B |
|
||
| Industrial Machinery | 3 | $64B |
|
||
| Healthcare | 2 | $55B |
|
||
| Retail / Pharmacy | 1 | $148B |
|
||
| Agriculture / Food | 1 | $86B |
|
||
Price history
-10.1% since first listed3 events — show timeline
- 2024-09-05 Price Changed $58,900 MRED as Distributed by MLS Grid
- 2024-05-28 Price Changed $61,900 MRED as Distributed by MLS Grid
- 2022-09-07 Listed $65,500 MRED as Distributed by MLS Grid
Cash-flow waterfall
monthlySold comps — $/sqft
last 12 mo · ≤1 miLoading sold comps…