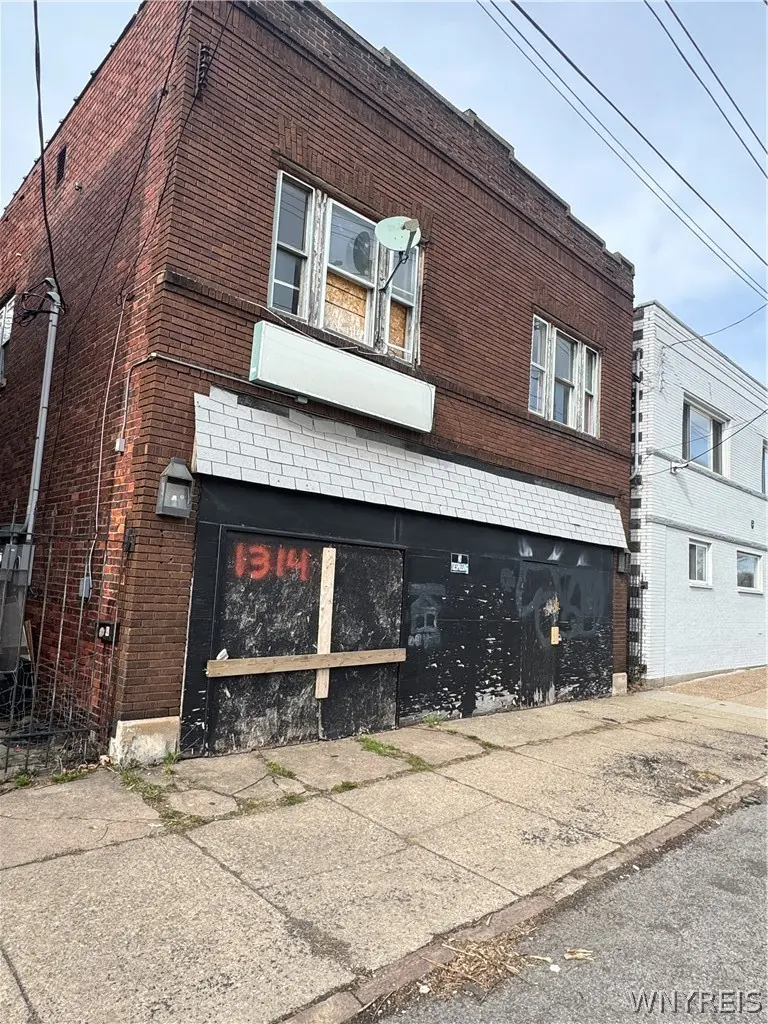
1314 Niagara St · Niagara Falls, NY
Flood risk No data
- FEMA flood zone
- —
- Chance of flooding over 30 yrs
- —
- Est. flood insurance / yr
- —
Fire risk No data
- Est. fire insurance / yr
- —
Heat risk No data
- Hot days now (above threshold)
- —
- Hot days in 30 yrs
- —
Wind risk No data
- Chance of severe wind over 30 yrs
- —
Air-quality risk No data
- Unhealthy air days now
- —
- Unhealthy air days in 30 yrs
- —
Risk factors via First Street. Map © Google.
Why this score? — see what drove the C+ grade
The composite is a weighted blend of 9 inputs, each scored 0–100. Each bar is that input's sub-score; the figure is the points it added to the 100-point composite (weight × sub-score).
- Cash flow +25.3/30.0
- DSCR +8.3/10.0
- ARV discount +7.5/15.0
- 1% rule +6.6/10.0
- Livability +3.0/5.0
- Rent growth +2.5/5.0
- Schools +2.5/10.0
- Condition / age +2.5/5.0
- Appreciation +2.3/10.0
$125,000
🖨 Deal sheet 📄 Offer letter ✓ Due diligence
Listing remarks MLS
REDUCED BY $30,000.00!! THIS IS A BRICK STOREFRONT BUILDING WITH 1 LARGE STOREFRONT OR 2 SMALLER STOREFRONTS. UPSTAIRS HAS TWO APARTMENTS, 1 IS OCCUPIED AND THE OTHER IS BEING RENOVATED. LOCATED JUST BLOCKS FROM THE SENECA NIAGARA CASINO ON NIAGARA STREET. VERY HOT LOCATION. UNBELIEVABLE PRICE FOR THE BUILDING. PACKAGE DEAL AVAILABLE WITH OTHER NIAGARA ST PROPERTIES. SELL MLS #'S 187922, 187924 AND 187926.
Key facts
- Residential units
- Storefront space
- Prime location
Tags
Property features AI
Finance
- Other: Owner pays: other / see remarks; Rent includes: see remarks
- Financial info: Multifamily property with 2 total units; Separate gas and electric meters for each unit; Operating expense details: see remarks
Exterior
- Parking: See remarks for parking details
- Utilities: Public water connected; Sewer connected
- Home design: 2-story building; Resale property; Brick construction
- Construction: Brick construction; Existing structure
- Exterior features: Near public transit; Rectangular residential lot; City street frontage; Lot dimensions approximately 33 x 130 feet
Interior
- Bathrooms: 2 full bathrooms
- Heating & cooling: Gas forced-air heating
- Interior features: Full basement
- Laundry & utility: Gas water heater
Neighborhood map
What this means for you Summary
Snapshot
- This is a 3-bed/2.0-bath single-family listed at $125k.
Deal economics
- At list price, monthly cash flow is $283 ($3k/yr) — positive.
- The deal already cash-flows at list — no discount required.
- Meets the 1% rule at list price ($1k rent vs $125k).
- Recommended offer: $121k (3.0% below list) — sets the bar for market timing.
Location & tenants
- Location reads 60/100 on livability (#956 in NY) — a middle-class / working-renter tenant base. Strengths: cost of living A+, housing A+; Watch: schools F, crime F, amenities F.
- Niagara Falls City School District (urban): math 26% / reading 34% proficiency, ranked #578 of 590 in NY (top 98%) — families likely to look elsewhere, expect single-tenant / working-renter base with shorter leases; 66% free/reduced lunch — lower-income household profile, screen leases tightly.
- Market conditions: 74 active listings in the ZIP; 167 units permitted in Niagara County in 2024 (0 in 5+ unit buildings).
- This rent runs 38% of the median local income ($46k/yr) — at the standard rent-burdened threshold; future hikes will face affordability resistance.
Forward outlook
- Local home prices are declining (-3.0%/yr); year-one equity from $864 of loan paydown is wiped out by about $4k of value loss. Plan a longer hold.
- Niagara County population projected at -19% by 2050 — secular population decline; favor cash flow + early exit over multi-decade hold.
Negotiation context
- It's been on market 46 days — a 3% lower offer ($121k) is reasonable based on typical stale-listing flexibility.
- 3 sale attempts since 23y ago with the ask held roughly flat each time — persistent listings suggest the price (not the market) is what's stuck; bring a comps-based counter.
- Current owner paid $49k; list at $125k implies a 155% gain — meaningful room to come down on a strong offer.
Risks & watch-outs
- Watch-outs: built in 1924 — expect roof / HVAC / electrical / plumbing capex.
Questions for the listing agent
- It's been on market 46 days. Have you received any prior offers? Is the seller open to a 3% concession, seller financing, or rate buy-down credit?
- Built in 1924 — when were the roof, HVAC, electrical panel, plumbing, and water heater last replaced?
- Is there a deadline driving the sale (1031 exchange, divorce, estate, relocation)? That informs how much negotiation room exists.
- Schools are F-rated, which usually means shorter tenancies and higher turnover. Who's the typical renter profile here, and what's been the actual vacancy rate?
- Crime grade is F in this area — have there been break-ins, vandalism, or insurance claims at this property in the last 3 years? What carrier currently insures it and at what premium?
- What's the average days-on-market for RENTAL listings here right now (not sales)? A rising rental-DOM trend means longer vacancies and softer asking-rent achievability than the comps imply.
- What's the recent tenant-quality profile in this submarket — average credit score on applications, eviction rate, late-payment / NSF rate, and stable-employment percentage? A property-management company in the area should have these aggregated.
- How much new for-sale + rental construction is in the pipeline within 1–3 miles? Heavy new supply typically softens prices + rents 12–24 months out; constrained supply supports both.
Investment metrics
- 1% rule
- 1.16% ✓
- Cap rate
- 9.01%
- Cash-on-cash
- 9.71%
- DSCR
- 1.43
- GRM
- 7.2
CMA / ARV
- ARV (median comp)
- $315,660
- List price
- $125,000
- Delta
- -60.40%
- Verdict
- UNDERPRICED
- Comps
- 20 within 1.0 mi
Show comp detail 2 sales within ~0.75 mi
| Address | Dist | Beds/Ba | Sqft | Sold | Price | $/sf | Match |
|---|---|---|---|---|---|---|---|
| 1114 Haeberle Ave | 0.49mi | 3/3.0 | 4,796 (-11%) | 20mo | $220,000 | $46 | 38 |
| 1611 Pine Ave | 0.43mi | 4/2.0 (+1) | 6,175 (+14%) | 22mo | $180,000 | $29 | 33 |
Match score weights: distance 35% · size 25% · config 20% · recency 20%. Top-matched comps best support the ARV.
Projected returns pro-forma
-3.0% appreciation · 3.0% rent growth · sell at horizon
- IRR
- -1.7%
- Equity multiple
- 0.94×
- Total profit
- $-2,199
- Equity at exit
- $18,638
- IRR
- 8.0%
- Equity multiple
- 1.61×
- Total profit
- $21,397
- Equity at exit
- $10,808
Cash invested: $35,000 (down + closing). Projections, not guarantees.
Landlord ↔ Tenant lean methodology
- Overall (STATE)
- 15 Strongly Tenant-Friendly
- State New York
- 15 Strongly Tenant-Friendly · D+10
- County
- — inherits STATE
- City
- — inherits STATE
ZIP-level market 14303
- Home prices YoY
- -1.7%
- Active inventory
- 74
- Price-to-rent
- 7.2×
Monthly cashflow live
- Estimated rent
- $1,452 medium interval (Pro) →
- Mortgage (P&I)
- −$656
- Tax est. 1.5%
- −$156 /mo · $1,875/yr
- Insurance
- −$52
- HOA
- −$0
- Vacancy / Maint / Mgmt
- −$305
- Net cashflow
- $283
Break-even live
UW: 25.0% down · 7.5% · 30yr · 1.5% tax · 5.0% vac · 8.0% maint · 8.0% mgmt
Financing live
Cash to close
- Down payment
- $31,250
- Closing costs
- $3,750
- Reserves months
- —
- Total cash needed
- —
Loan-product check · same deal, 3 products live
Conventional
25% down · 7.5% · 30yr
- Down + closing
- —
- Monthly P&I
- —
- Monthly cashflow
- —
- DSCR
- —
- Eligible?
- —
Personal DTI + credit; lowest rate.
DSCR
20% down · 8.5% · 30yr
- Down + closing
- —
- Monthly P&I
- —
- Monthly cashflow
- —
- DSCR
- —
- Eligible?
- —
No personal income docs; deal must DSCR.
Hard money
10% down · 12.0% · 12mo
- Down + closing
- —
- Monthly P&I
- —
- Monthly cashflow
- —
- DSCR
- —
- Eligible?
- —
Short-term bridge; refi at stabilization.
Listing history 19 events
-
2026-06-18days on market $125,000 Active 46 DOM
-
2026-06-17days on market $125,000 Active 45 DOM
-
2026-06-16days on market $125,000 Active 44 DOM
-
2026-06-15days on market $125,000 Active 43 DOM
-
2026-06-13days on market $125,000 Active 41 DOM
-
2026-06-13days on market $125,000 Active 40 DOM
-
2026-06-10days on market $125,000 Active 38 DOM
-
2026-06-09days on market $125,000 Active 37 DOM
-
2026-06-08days on market $125,000 Active 36 DOM
-
2026-06-07days on market $125,000 Active 35 DOM
-
2026-06-03days on market $125,000 Active 31 DOM
-
2026-06-02days on market $125,000 Active 30 DOM
-
2026-06-01days on market $125,000 Active 29 DOM
-
2026-05-31days on market $125,000 Active 28 DOM
-
2026-05-16price $125,000 655-char remark
-
2026-05-03$130,000 Active 655-char remark
-
2010-07-08$27,500
-
2004-08-11soldstatus $49,000
Show marketing remark (411 chars)
REDUCED BY $30,000.00!! THIS IS A BRICK STOREFRONT BUILDING WITH 1 LARGE STOREFRONT OR 2 SMALLER STOREFRONTS. UPSTAIRS HAS TWO APARTMENTS, 1 IS OCCUPIED AND THE OTHER IS BEING RENOVATED. LOCATED JUST BLOCKS FROM THE SENECA NIAGARA CASINO ON NIAGARA STREET. VERY HOT LOCATION. UNBELIEVABLE PRICE FOR THE BUILDING. PACKAGE DEAL AVAILABLE WITH OTHER NIAGARA ST PROPERTIES. SELL MLS #'S 187922, 187924 AND 187926.
-
2003-06-22$49,900
Show marketing remark (411 chars)
REDUCED BY $30,000.00!! THIS IS A BRICK STOREFRONT BUILDING WITH 1 LARGE STOREFRONT OR 2 SMALLER STOREFRONTS. UPSTAIRS HAS TWO APARTMENTS, 1 IS OCCUPIED AND THE OTHER IS BEING RENOVATED. LOCATED JUST BLOCKS FROM THE SENECA NIAGARA CASINO ON NIAGARA STREET. VERY HOT LOCATION. UNBELIEVABLE PRICE FOR THE BUILDING. PACKAGE DEAL AVAILABLE WITH OTHER NIAGARA ST PROPERTIES. SELL MLS #'S 187922, 187924 AND 187926.
ⓘ Source: listings_history table (triggers on properties + properties_extension) + one-shot
backfill from property_details.listing_events for pre-trigger history.
Nearby sold comps map
Loading sold comps map…
Walkable amenities ~0.75 mi
Loading nearby amenities…
Taxation est. · year 1
- Rental income
- $17,423
- − Mortgage interest
- −$7,002
- − Property taxes
- −$1,875
- − Insurance
- −$625
- − Repairs & maintenance
- −$1,394
- − Management
- −$1,394
- − Depreciation
- −$3,636
- Taxable income
- $1,497
- Est. tax owed @ 24.0%
- −$359
- After-tax cash flow
- $3,039/yr
For passive investors: Depreciation is non-cash, so a rental often shows a tax loss while cash-flowing — sheltering income. Rental losses are passive: they offset passive income freely, and up to $25,000/yr can offset ordinary (W-2) income if you actively participate and your MAGI is under $100k (phasing out to $0 by $150k); unused losses carry forward. On sale, claimed depreciation is recaptured at up to 25%, and gains may owe capital-gains tax (a 1031 exchange can defer both). Figures are a year-1 estimate at your 24.0% rate — not tax advice; consult a CPA.
Schools (NCES district)
- District
- Niagara Falls City School District
- NCES district ID
- 3620820
- Math proficiency
- 26% ▼ -10.00%
- Reading proficiency
- 34% ▲ 3.00%
- Median HH income
- $32,488
- Composite
- 24.5/100
- National rank
- #7655
- State rank
- #578 of 590 in NY
Livability — Niagara Falls
- Score
- 60/100
- State rank
- #956
- US rank
- #18749
Category grades
Schools grade is shown separately in the Schools card above.
Census & demographics
- Census place
- Niagara Falls, NY
- County
- Niagara County · 157,377 people
- City population
- 62,983
- Metro
- Buffalo-Cheektowaga, NY
- Population (ZIP)
- 6,156
- Household income
- $45,646
- Rent vs Own
- Severe rent burden
- 230.0
Population outlook (Niagara County) Hauer SSP2
- Today (2025)
- 204,149 people
- By 2030
- 197,900 · -3.1%
- By 2040
- 182,239 · -10.7%
- By 2050
- 165,198 · -19.1%
- By 2075
- 129,416 · -36.6%
- By 2100
- 96,222 · -52.9%
Race, ethnicity, and origin ACS 2023
- Neighborhood character
- Diverse neighborhood (Simpson 0.68)
- Race & ethnicity
- White 53% Two or more races 18% Hispanic / Latino 15% Black 12% Asian 4% Native American 1%
- Hispanic origin (detail)
- Mexican 6% Puerto Rican 6%
- Common ancestry
- Romanian 12% Lithuanian 2% Iranian 1%
- Foreign-born
- 3%
- Languages at home
- 93% English-only · Other Indo-European 3% Spanish 3% Russian/Polish/Slavic 1%
Political lean MEDSL · Niagara
- 2024 margin
- R (+14.9) · D 42.5% · R 57.5%
- 2008→2024 swing
- -15.9pp toward R · 2008: 1.0pp · 2024: -14.9pp
- All cycles
- 2024: R+14.9 2020: R+9.7 2016: R+19.0 2012: D+0.6 2008: D+1.0
Not yet ingested
- Civics
- —
Market trends
- HPI YoY
- ▼ -5.37%
- Current HPI
- 311.8094
- Rent YoY
- —
- Metro
- Buffalo-Cheektowaga, NY
- State GDP YoY
- ▲ 2.60%
- F500 in state
- 92
Industry mix (Fortune 500 HQ in NY)
| Industry | F500 HQs | Revenue |
|---|---|---|
| Financial Services | 10 | $950B |
|
||
| Consumer Goods | 9 | $162B |
|
||
| Insurance | 4 | $225B |
|
||
| Telecommunications | 2 | $144B |
|
||
| Pharmaceuticals | 2 | $112B |
|
||
| Media / Entertainment | 2 | $69B |
|
||
Price history
+150.5% since first listed5 events — show timeline
- 2026-05-16 Price Changed $125,000 WNYREIS
- 2026-05-03 Listed $130,000 WNYREIS
- 2010-07-08 Listed $27,500 WNYREIS
- 2004-08-11 Sold (MLS) $49,000 WNYREIS
- 2003-06-22 Listed $49,900 WNYREIS
Cash-flow waterfall
monthlySold comps — $/sqft
last 12 mo · ≤1 miLoading sold comps…