420 North St · Lawrence, KS
Flood risk No data
- FEMA flood zone
- —
- Chance of flooding over 30 yrs
- —
- Est. flood insurance / yr
- —
Fire risk No data
- Est. fire insurance / yr
- —
Heat risk No data
- Hot days now (above threshold)
- —
- Hot days in 30 yrs
- —
Wind risk No data
- Chance of severe wind over 30 yrs
- —
Air-quality risk No data
- Unhealthy air days now
- —
- Unhealthy air days in 30 yrs
- —
Risk factors via First Street. Map © Google.
Why this score? — see what drove the B grade
The composite is a weighted blend of 9 inputs, each scored 0–100. Each bar is that input's sub-score; the figure is the points it added to the 100-point composite (weight × sub-score).
- Cash flow +30.0/30.0
- 1% rule +10.0/10.0
- DSCR +10.0/10.0
- ARV discount +7.5/15.0
- Rent growth +4.8/5.0
- Livability +4.4/5.0
- Schools +3.2/10.0
- Condition / age +2.5/5.0
- Appreciation +0.0/10.0
$49,500
🖨 Deal sheet 📄 Offer letter ✓ Due diligence
Listing remarks
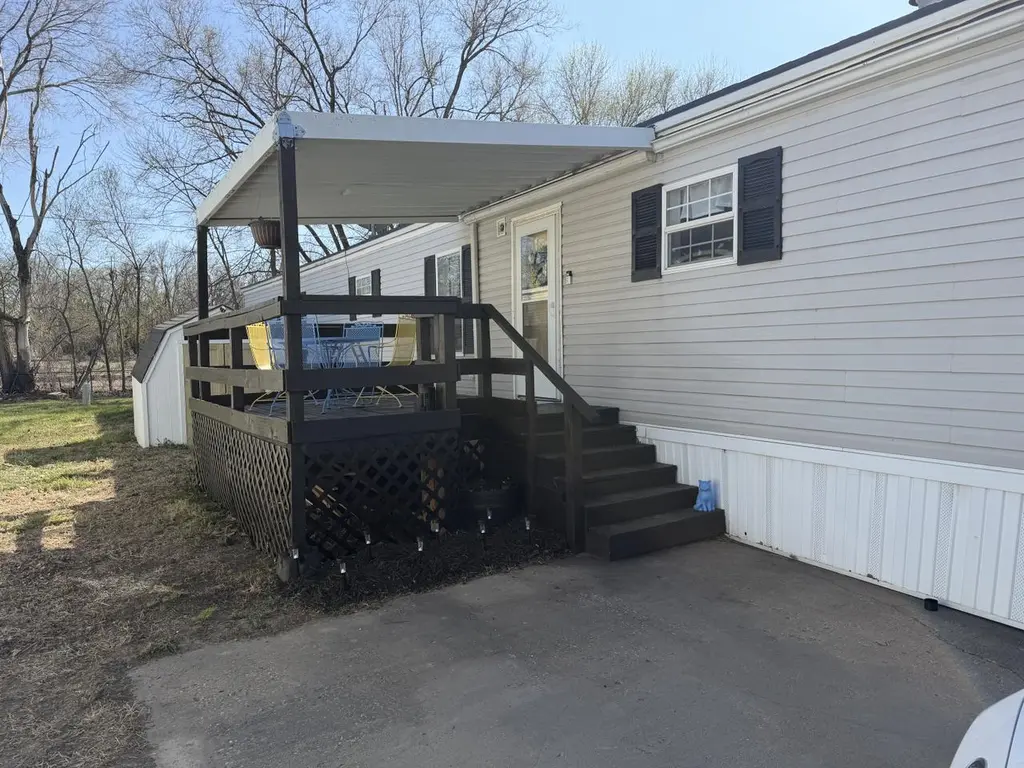
This home has been extensively updated and is move-in ready with modern finishes throughout. Recent upgrades include new flooring, fresh paint, updated lighting, and improved plumbing underneath the home. The kitchen features updated appliances, a new faucet, and a brand-new hood and microwave. Bathrooms have been refreshed, and the home includes new carpet in bedrooms and closets. Exterior improvements include a large front deck, fresh paint, updated shutters, new storm door, and gutter guards. Base Lot rent is $715/month. Conveniently located with easy access to Kansas City and upcoming World Cup activity. A great opportunity for affordable, updated living in a well-located community.
Key facts
- Updated appliances
- Brand new hood
- New faucet
Tags
Property features AI
Exterior
- Home design: Built in 1999
- Exterior features: Deck
Interior
- Kitchen: Dishwasher; Microwave; Refrigerator
- Flooring: Carpet
- Interior features: Carpet flooring in living areas; Pantry; Deck access from interior
Neighborhood map
What this means for you Summary
Snapshot
- This is a 3-bed/2.0-bath land listed at $50k.
Deal economics
- At list price, monthly cash flow is $616 ($7k/yr) — positive.
- The deal already cash-flows at list — no discount required.
- Meets the 1% rule at list price ($1k rent vs $50k).
- Recommended offer: $47k (6.0% below list) — sets the bar for market timing.
- Cap rate 21.2% vs local median 2.7% in Lawrence — top-decile yield for the area; either an underpriced asset or a hidden risk that comps aren't pricing in. Stress-test before assuming the spread holds.
Location & tenants
- Location reads 88/100 on livability (#1 in KS, #237 nationally) — a professional / high-income tenant draw. Strengths: amenities A+, commute A+, cost of living A+; Watch: crime D-.
- Lawrence (urban): math 31% / reading 44% proficiency, ranked #46 of 169 in KS (top 27%) — families likely to look elsewhere, expect single-tenant / working-renter base with shorter leases.
- Market conditions: Rents rising fast (+9.0%/yr); 93 active listings in the ZIP; 3 comparable units currently listed for rent nearby; rentals leasing fast (median 13d on market — plan ~1-2 weeks tenant-placement turnaround); 246 units permitted in Douglas County in 2024 (38 in 5+ unit buildings).
Forward outlook
- Local home prices are declining (-3.0%/yr); year-one equity from $342 of loan paydown is wiped out by about $1k of value loss. Plan a longer hold.
- Douglas County population projected at +39% by 2050 — long-run rental-demand tailwind backs the buy-and-hold thesis.
- At projected returns (-3.0% appreciation + 8.0% rent growth), your $14k cash investment doubles in ~3 years — after that, you're playing with house money.
Negotiation context
- It's been on market 71 days — a 6% lower offer ($47k) is reasonable based on typical stale-listing flexibility.
Questions for the listing agent
- It's been on market 71 days. Have you received any prior offers? Is the seller open to a 6% concession, seller financing, or rate buy-down credit?
- Why hasn't it sold? Are there any deal-killer items the seller is aware of (foundation, flood, title, zoning, code violations)?
- Is there a deadline driving the sale (1031 exchange, divorce, estate, relocation)? That informs how much negotiation room exists.
- Crime grade is D in this area — have there been break-ins, vandalism, or insurance claims at this property in the last 3 years? What carrier currently insures it and at what premium?
- What's the average days-on-market for RENTAL listings here right now (not sales)? A rising rental-DOM trend means longer vacancies and softer asking-rent achievability than the comps imply.
- What's the recent tenant-quality profile in this submarket — average credit score on applications, eviction rate, late-payment / NSF rate, and stable-employment percentage? A property-management company in the area should have these aggregated.
- How much new for-sale + rental construction is in the pipeline within 1–3 miles? Heavy new supply typically softens prices + rents 12–24 months out; constrained supply supports both.
Investment metrics
- 1% rule
- 2.45% ✓
- Cap rate
- 21.22%
- Cash-on-cash
- 53.31%
- DSCR
- 3.37
- GRM
- 3.4
CMA / ARV
No comps found within radius.
Projected returns pro-forma
-3.0% appreciation · 8.0% rent growth · sell at horizon
- IRR
- 57.0%
- Equity multiple
- 3.71×
- Total profit
- $37,617
- Equity at exit
- $7,381
- IRR
- 63.7%
- Equity multiple
- 9.12×
- Total profit
- $112,485
- Equity at exit
- $4,280
Cash invested: $13,860 (down + closing). Projections, not guarantees.
Landlord ↔ Tenant lean methodology
- Overall (STATE)
- 83 Strongly Landlord-Friendly
- State Kansas
- 83 Strongly Landlord-Friendly · R+10
- County
- — inherits STATE
- City
- — inherits STATE
ZIP-level market 66044
- Rents YoY
- 9.0%
- Active inventory
- 93
- Price-to-rent
- 3.4×
Monthly cashflow live
- Estimated rent
- $1,212 medium interval (Pro) →
- Mortgage (P&I)
- −$260
- Tax est. 1.5%
- −$62 /mo · $742/yr
- Insurance
- −$21
- HOA
- −$0
- Vacancy / Maint / Mgmt
- −$255
- Net cashflow
- $616
Break-even live
UW: 25.0% down · 7.5% · 30yr · 1.5% tax · 5.0% vac · 8.0% maint · 8.0% mgmt
Financing live
Cash to close
- Down payment
- $12,375
- Closing costs
- $1,485
- Reserves months
- —
- Total cash needed
- —
Loan-product check · same deal, 3 products live
Conventional
25% down · 7.5% · 30yr
- Down + closing
- —
- Monthly P&I
- —
- Monthly cashflow
- —
- DSCR
- —
- Eligible?
- —
Personal DTI + credit; lowest rate.
DSCR
20% down · 8.5% · 30yr
- Down + closing
- —
- Monthly P&I
- —
- Monthly cashflow
- —
- DSCR
- —
- Eligible?
- —
No personal income docs; deal must DSCR.
Hard money
10% down · 12.0% · 12mo
- Down + closing
- —
- Monthly P&I
- —
- Monthly cashflow
- —
- DSCR
- —
- Eligible?
- —
Short-term bridge; refi at stabilization.
Rent comps 3 comps
| Address | Beds | Baths | Sqft | Rent | $/sqft | DOM | Units | Dist |
|---|---|---|---|---|---|---|---|---|
| 110 N Michigan St Lawrence, KS | 3.0 | 3.0 | 1036 | $949 | $0.92 | 23d | 1 | 1.07mi |
| 1311 George Ct Lawrence, KS | 2.0 | 1.0 | 870 | $1,195 | $1.37 | 2d | 3 | 1.13mi |
| 901 Illinois St Lawrence, KS | 2.0 | 1.0 | 900 | $1,200 | $1.33 | 12d | 4 | 1.48mi |
Listing history 16 events
-
2026-06-19days on market $49,500 Active 71 DOM
-
2026-06-18days on market $49,500 Active 70 DOM
-
2026-06-17days on market $49,500 Active 69 DOM
-
2026-06-16days on market $49,500 Active 68 DOM
-
2026-06-15days on market $49,500 Active 67 DOM
-
2026-06-14days on market $49,500 Active 65 DOM
-
2026-06-13days on market $49,500 Active 64 DOM
-
2026-06-09days on market $49,500 Active 61 DOM
-
2026-06-08days on market $49,500 Active 60 DOM
-
2026-06-07days on market $49,500 Active 59 DOM
-
2026-06-05days on market $49,500 Active 56 DOM
-
2026-06-02days on market $49,500 Active 54 DOM
-
2026-06-01days on market $49,500 Active 53 DOM
-
2026-05-31days on market $49,500 Active 52 DOM
-
2026-05-30days on market $49,500 Active 51 DOM
-
2026-03-31$49,500 Active
ⓘ Source: listings_history table (triggers on properties + properties_extension) + one-shot
backfill from property_details.listing_events for pre-trigger history.
Nearby sold comps map
Loading sold comps map…
Walkable amenities ~0.75 mi
Loading nearby amenities…
Taxation est. · year 1
- Rental income
- $14,548
- − Mortgage interest
- −$2,773
- − Property taxes
- −$742
- − Insurance
- −$248
- − Repairs & maintenance
- −$1,164
- − Management
- −$1,164
- − Depreciation
- −$1,440
- Taxable income
- $7,018
- Est. tax owed @ 24.0%
- −$1,684
- After-tax cash flow
- $5,704/yr
For passive investors: Depreciation is non-cash, so a rental often shows a tax loss while cash-flowing — sheltering income. Rental losses are passive: they offset passive income freely, and up to $25,000/yr can offset ordinary (W-2) income if you actively participate and your MAGI is under $100k (phasing out to $0 by $150k); unused losses carry forward. On sale, claimed depreciation is recaptured at up to 25%, and gains may owe capital-gains tax (a 1031 exchange can defer both). Figures are a year-1 estimate at your 24.0% rate — not tax advice; consult a CPA.
Schools (NCES district)
- District
- Lawrence
- NCES district ID
- 2008400
- Math proficiency
- 31% ▼ -7.00%
- Reading proficiency
- 44% ▬ 0.00%
- Median HH income
- $46,259
- Composite
- 32.02/100
- National rank
- #5826
- State rank
- #46 of 169 in KS
Livability — Lawrence
- Score
- 88/100
- State rank
- #1
- US rank
- #237
Category grades
Schools grade is shown separately in the Schools card above.
Census & demographics
- Census place
- Lawrence, KS
- County
- Douglas County · 100,966 people
- City population
- 100,966
- Metro
- Lawrence, KS
- Population (ZIP)
- 28,820
- Household income
- $55,955
- Rent vs Own
- Severe rent burden
- 2168.0
Population outlook (Douglas County) Hauer SSP2
- Today (2025)
- 136,863 people
- By 2030
- 147,255 · +7.6%
- By 2040
- 167,760 · +22.6%
- By 2050
- 190,593 · +39.3%
- By 2075
- 253,850 · +85.5%
- By 2100
- 314,741 · +130.0%
Race, ethnicity, and origin ACS 2023
- Neighborhood character
- Predominantly White (78%)
- Race & ethnicity
- White 78% Two or more races 9% Hispanic / Latino 7% Black 4% Asian 3% Native American 2%
- Hispanic origin (detail)
- Mexican 4%
- Common ancestry
- Slovak 3% Lithuanian 3% Italian 2%
- Foreign-born
- 4% · Canada, China
- Languages at home
- 91% English-only · Spanish 4% Other Asian/Pacific 1% Chinese 1%
Political lean MEDSL · Douglas
- 2024 margin
- Solid D (+38.0) · D 68.2% · R 30.2% · Other 1.6%
- 2008→2024 swing
- +7.2pp toward D · 2008: 30.8pp · 2024: 38.0pp
- All cycles
- 2024: D+38.0 2020: D+39.5 2016: D+32.7 2012: D+23.7 2008: D+30.8
Not yet ingested
- Civics
- —
Market trends
- HPI YoY
- ▼ -357.53%
- Current HPI
- 247.5888
- Rent YoY
- ▲ 9.02%
- Metro
- Lawrence, KS
- State GDP YoY
- —
- F500 in state
- 0
Price history
1 event — show timeline
- 2026-03-31 Listed $49,500 FSBO.com
Property tax history
+11.6%/yrLatest (2025): $28,061 · +0.3% YoY. Source: county tax records.
Cash-flow waterfall
monthlySold comps — $/sqft
last 12 mo · ≤1 miLoading sold comps…