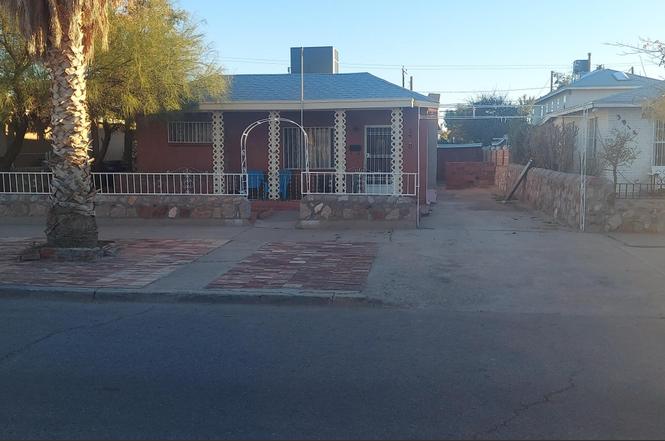
3920 Clifton Ave · El Paso, TX
Flood risk 1/10 · Minimal
- FEMA flood zone
- X (shaded)
- Chance of flooding over 30 yrs
- 0.0%
- Est. flood insurance / yr
- $507 – $1,088
Fire risk 2/10 · Minimal
- Est. fire insurance / yr
- $1,222 – $2,270
Heat risk 6/10 · Moderate
- Hot days now (above 101°F)
- 7 days/yr
- Hot days in 30 yrs
- 27 days/yr
Wind risk 1/10 · Minimal
- Chance of severe wind over 30 yrs
- —
Air-quality risk 2/10 · Minimal
- Unhealthy air days now
- 1 days/yr
- Unhealthy air days in 30 yrs
- 2 days/yr
Risk factors via First Street. Map © Google.
Why this score? — see what drove the B+ grade
The composite is a weighted blend of 9 inputs, each scored 0–100. Each bar is that input's sub-score; the figure is the points it added to the 100-point composite (weight × sub-score).
- Cash flow +30.0/30.0
- ARV discount +15.0/15.0
- DSCR +10.0/10.0
- 1% rule +9.8/10.0
- Livability +4.0/5.0
- Rent growth +2.7/5.0
- Schools +2.7/10.0
- Condition / age +2.5/5.0
- Appreciation +0.0/10.0
$90,000
🖨 Deal sheet 📄 Offer letter ✓ Due diligence
Listing remarks
Investor Special with Excellent Value-Add Potential! Located at 3920 Clifton Avenue in Central El Paso (79903), this 1,453 sq. ft. property presents a great opportunity for investors, flippers, or buyers looking for a renovation project. The home offers a solid structure and functional layout, ready for updates and customization. An additional structure in the backyard provides potential to be finished as an ADU, creating an opportunity for extra rental income or multigenerational living (buyer to verify zoning, permits, and use). The lot layout allows for creative redevelopment options. Situated in an established neighborhood near schools, shopping, medical facilities, and major roadways,
Key facts
- Additional structure
- 7,000 sq ft lot
- Built 1951
Tags
Neighborhood map
What this means for you Summary
Snapshot
- This is a 3-bed/1.0-bath single-family listed at $90k.
Deal economics
- At list price, monthly cash flow is $428 ($5k/yr) — positive.
- The deal already cash-flows at list — no discount required.
- Meets the 1% rule at list price ($1k rent vs $90k).
Location & tenants
- Location reads 81/100 on livability (#23 in TX, #1,375 nationally) — a professional / high-income tenant draw. Strengths: commute A+, cost of living A+, housing A+; Watch: employment D+.
- El Paso ISD (urban): math 27% / reading 37% proficiency, ranked #591 of 826 in TX (top 72%) — families likely to look elsewhere, expect single-tenant / working-renter base with shorter leases; 65% free/reduced lunch — lower-income household profile, screen leases tightly.
- Zoned schools: Coldwell El (math 17% / reading 22%, grade F, #3,583 of 4,322 statewide, top 86%, 435 students, 91% FRL); Austin H S (math 13% / reading 28%, grade F, #1,389 of 1,632 statewide, top 86%, 1,184 students, 90% FRL) — zoned schools average 90% FRL vs 65% district-wide (25 pts higher); higher-poverty schools than district average — tighter screening recommended.
- Zoned-school proficiency averages 20% at this address vs 32% district-wide (-12 pts) — the specific schools serving this property underperform the El Paso ISD average; the district grade overstates school quality for this exact location.
- Market conditions: Rents flat; 49 active listings in the ZIP; 30 comparable units currently listed for rent nearby; rentals at typical pace (median 24d on market — plan ~3-4 weeks tenant-placement turnaround); 43% of comp listings sitting > 30 days — soft ceiling on asking rent; lower-income renter base — watch delinquency; 2,196 units permitted in El Paso County in 2024 (143 in 5+ unit buildings).
- This rent runs 43% of the median local income ($37k/yr) — at the standard rent-burdened threshold; future hikes will face affordability resistance.
Forward outlook
- Local home prices are declining (-3.0%/yr); year-one equity from $622 of loan paydown is wiped out by about $3k of value loss. Plan a longer hold.
- El Paso County population projected at +10% by 2050 — modest demand growth; plan on rents tracking national, not racing it.
- At projected returns (-3.0% appreciation + 0.9% rent growth), your $25k cash investment doubles in ~7 years — after that, you're playing with house money.
Negotiation context
- Only 5 days on market — expect competitive offers; lowballing is unlikely to land.
Risks & watch-outs
- Watch-outs: built in 1951 — expect roof / HVAC / electrical / plumbing capex.
- Climate carrying-cost: extreme-heat days projected 7→27/yr by 2055 (HVAC capex compounding) — expect insurance premiums to compound above CPI over the hold.
Questions for the listing agent
- Built in 1951 — when were the roof, HVAC, electrical panel, plumbing, and water heater last replaced?
- Is there a deadline driving the sale (1031 exchange, divorce, estate, relocation)? That informs how much negotiation room exists.
- Schools are B-rated — typically a magnet for longer-tenancy family renters. What's the average tenant stay here, and is there a school-zone premium baked into asking?
- What's the average days-on-market for RENTAL listings here right now (not sales)? A rising rental-DOM trend means longer vacancies and softer asking-rent achievability than the comps imply.
- What's the recent tenant-quality profile in this submarket — average credit score on applications, eviction rate, late-payment / NSF rate, and stable-employment percentage? A property-management company in the area should have these aggregated.
- How much new for-sale + rental construction is in the pipeline within 1–3 miles? Heavy new supply typically softens prices + rents 12–24 months out; constrained supply supports both.
Investment metrics
- 1% rule
- 1.48% ✓
- Cap rate
- 12.00%
- Cash-on-cash
- 20.39%
- DSCR
- 1.91
- GRM
- 5.6
CMA / ARV
- ARV (on-the-fly)
- $116,240
- Comps found
- 1
Show comp detail 1 sale within ~0.75 mi
| Address | Dist | Beds/Ba | Sqft | Sold | Price | $/sf | Match |
|---|---|---|---|---|---|---|---|
| 1314 Marr St | 0.43mi | 2/1.0 (-1) | 1,378 (-5%) | 24mo | $109,900 | $80 | 47 |
Match score weights: distance 35% · size 25% · config 20% · recency 20%. Top-matched comps best support the ARV.
Projected returns pro-forma
-3.0% appreciation · 0.91% rent growth · sell at horizon
- IRR
- 10.3%
- Equity multiple
- 1.40×
- Total profit
- $9,965
- Equity at exit
- $13,419
- IRR
- 17.6%
- Equity multiple
- 2.31×
- Total profit
- $33,094
- Equity at exit
- $7,782
Cash invested: $25,200 (down + closing). Projections, not guarantees.
Landlord ↔ Tenant lean methodology
- Overall (STATE)
- 87 Strongly Landlord-Friendly
- State Texas
- 87 Strongly Landlord-Friendly · R+5
- County
- — inherits STATE
- City
- — inherits STATE
ZIP-level market 79903
- Home prices YoY
- -21.2%
- Rents YoY
- 0.9%
- Active inventory
- 49
- Price-to-rent
- 5.6×
Monthly cashflow live
- Estimated rent
- $1,329 high interval (Pro) →
- Mortgage (P&I)
- −$472
- Tax est. 1.5%
- −$112 /mo · $1,350/yr
- Insurance
- −$38
- HOA
- −$0
- Vacancy / Maint / Mgmt
- −$279
- Net cashflow
- $428
Break-even live
UW: 25.0% down · 7.5% · 30yr · 1.5% tax · 5.0% vac · 8.0% maint · 8.0% mgmt
Financing live
Cash to close
- Down payment
- $22,500
- Closing costs
- $2,700
- Reserves months
- —
- Total cash needed
- —
Loan-product check · same deal, 3 products live
Conventional
25% down · 7.5% · 30yr
- Down + closing
- —
- Monthly P&I
- —
- Monthly cashflow
- —
- DSCR
- —
- Eligible?
- —
Personal DTI + credit; lowest rate.
DSCR
20% down · 8.5% · 30yr
- Down + closing
- —
- Monthly P&I
- —
- Monthly cashflow
- —
- DSCR
- —
- Eligible?
- —
No personal income docs; deal must DSCR.
Hard money
10% down · 12.0% · 12mo
- Down + closing
- —
- Monthly P&I
- —
- Monthly cashflow
- —
- DSCR
- —
- Eligible?
- —
Short-term bridge; refi at stabilization.
Rent comps 30 comps
| Address | Beds | Baths | Sqft | Rent | $/sqft | DOM | Units | Dist |
|---|---|---|---|---|---|---|---|---|
| 3814 Hueco Ave El Paso, TX | 2.0 | 1.0 | 897 | $1,245 | $1.39 | 43d | 1 | 0.13mi |
| 3906 Tularosa Ave El Paso, TX | 2.0 | 1.0 | 1013 | $1,050 | $1.04 | 43d | 1 | 0.18mi |
| 4012 Trowbridge Dr Unit A El Paso, TX | 2.0 | 1.0 | 1064 | $1,450 | $1.36 | 23d | 1 | 0.26mi |
| 4116 Chester Ave El Paso, TX | 3.0 | 1.0 | 1076 | $1,600 | $1.49 | 43d | 1 | 0.43mi |
| 3505 Douglas Ave El Paso, TX | 2.0 | 1.0 | 1025 | $925 | $0.90 | 43d | 1 | 0.46mi |
| 4410 Trowbridge Dr Unit A El Paso, TX | 2.0 | 1.0 | 1176 | $1,200 | $1.02 | 23d | 1 | 0.50mi |
| 4410 Trowbridge Dr Unit A El Paso, TX | 2.0 | 1.0 | 1176 | $1,200 | $1.02 | 14d | 1 | 0.50mi |
| 3921 Cambridge Ave Unit B El Paso, TX | 2.0 | 2.0 | 1018 | $1,295 | $1.27 | 19d | 1 | 0.55mi |
| 4424 Cambridge Ave El Paso, TX | 3.0 | 2.0 | 1404 | $1,595 | $1.14 | 3d | 1 | 0.71mi |
| 3146 Federal Ave El Paso, TX | 3.0 | 2.0 | 1157 | $1,500 | $1.30 | 43d | 1 | 0.74mi |
| 3025 E Missouri Ave El Paso, TX | 2.0 | 1.0 | 1008 | $1,395 | $1.38 | 43d | 1 | 0.84mi |
| 3004 E Yandell Dr El Paso, TX | 2.0 | 1.0 | 1400 | $1,600 | $1.14 | 14d | 1 | 0.84mi |
| 3000 Wyoming Ave El Paso, TX | 3.0 | 2.0 | 1217 | $1,600 | $1.31 | 3d | 1 | 0.87mi |
| 2150 King James Pl El Paso, TX | 3.0 | 2.0 | 1170 | $1,550 | $1.32 | 43d | 1 | 0.93mi |
| 2862 Grant Ave Unit 3 El Paso, TX | 2.0 | 1.0 | 1127 | $1,045 | $0.93 | 23d | 1 | 1.00mi |
| 4600 Leeds Ave El Paso, TX | 3.0 | 2.0 | 1233 | $1,600 | $1.30 | 14d | 1 | 1.01mi |
| 2807 Grant Ave Unit A El Paso, TX | 2.0 | 1.0 | 1040 | $1,150 | $1.11 | 43d | 1 | 1.08mi |
| 3816 Findley Ave El Paso, TX | 2.0 | 1.0 | 1149 | $1,080 | $0.94 | 3d | 1 | 1.10mi |
| 3816 Findley Ave El Paso, TX | 2.0 | 1.0 | 1149 | $1,080 | $0.94 | 23d | 1 | 1.10mi |
| 3203 Frankfort Ave El Paso, TX | 3.0 | 1.0 | 1421 | $1,450 | $1.02 | 3d | 1 | 1.14mi |
| 2723 Grant Ave El Paso, TX | 3.0 | 1.0 | 980 | $2,550 | $2.60 | 43d | 1 | 1.14mi |
| 3030 Pera Ave Unit A El Paso, TX | 2.0 | 1.5 | 1050 | $1,350 | $1.29 | 43d | 1 | 1.16mi |
| 3204 Memphis Ave El Paso, TX | 3.0 | 2.0 | 1480 | $1,800 | $1.22 | 43d | 1 | 1.16mi |
| 3706 Sacramento Ave El Paso, TX | 3.0 | 1.5 | 1310 | $1,600 | $1.22 | 3d | 1 | 1.18mi |
| 2624 Arizona Ave El Paso, TX | 4.0 | 2.0 | 1507 | $1,600 | $1.06 | 3d | 1 | 1.23mi |
| 2413 Tremont Ave El Paso, TX | 2.0 | 1.0 | 980 | $999 | $1.02 | 43d | 1 | 1.34mi |
| 2413 Tremont Ave Unit b3 El Paso, TX | 2.0 | 1.0 | 980 | $999 | $1.02 | 23d | 1 | 1.34mi |
| 5530 Venezuela Rd El Paso, TX | 3.0 | 3.0 | 1568 | $1,350 | $0.86 | 43d | 1 | 1.38mi |
| 3510 Porter Ave Unit 1 El Paso, TX | 2.0 | 1.0 | 1200 | $1,250 | $1.04 | 14d | 1 | 1.40mi |
| 3510 Porter Ave Unit 1 El Paso, TX | 2.0 | 1.0 | 1200 | $1,250 | $1.04 | 23d | 1 | 1.40mi |
Listing history 2 events
-
2025-12-17status Pending
-
2025-12-11$90,000 Active
ⓘ Source: listings_history table (triggers on properties + properties_extension) + one-shot
backfill from property_details.listing_events for pre-trigger history.
Climate risk First Street
- Flood 1/10 Low FEMA zone X (shaded) · 0% chance over 30 yrs
- Wildfire 2/10 Low
- Heat 6/10 Major 7 d/yr ≥101°F today · 27 d/yr by 30 yrs out
- Wind 1/10 Low
- Air quality 2/10 Low 1 unhealthy d/yr today · 2 by 30 yrs out
Nearby sold comps map
Loading sold comps map…
Walkable amenities ~0.75 mi
Loading nearby amenities…
Taxation est. · year 1
- Rental income
- $15,951
- − Mortgage interest
- −$5,041
- − Property taxes
- −$1,350
- − Insurance
- −$450
- − Repairs & maintenance
- −$1,276
- − Management
- −$1,276
- − Depreciation
- −$2,618
- Taxable income
- $3,939
- Est. tax owed @ 24.0%
- −$945
- After-tax cash flow
- $4,192/yr
For passive investors: Depreciation is non-cash, so a rental often shows a tax loss while cash-flowing — sheltering income. Rental losses are passive: they offset passive income freely, and up to $25,000/yr can offset ordinary (W-2) income if you actively participate and your MAGI is under $100k (phasing out to $0 by $150k); unused losses carry forward. On sale, claimed depreciation is recaptured at up to 25%, and gains may owe capital-gains tax (a 1031 exchange can defer both). Figures are a year-1 estimate at your 24.0% rate — not tax advice; consult a CPA.
Schools (NCES district)
- District
- El Paso ISD
- NCES district ID
- 4818300
- Math proficiency
- 27% ▼ -24.00%
- Reading proficiency
- 37% ▼ -7.00%
- Median HH income
- $38,704
- Composite
- 26.75/100
- National rank
- #7138
- State rank
- #591 of 826 in TX
Livability — El Paso
- Score
- 81/100
- State rank
- #23
- US rank
- #1375
Category grades
Schools grade is shown separately in the Schools card above.
Census & demographics
- Census place
- El Paso, TX
- County
- El Paso County · 761,266 people
- City population
- 630,223
- Metro
- El Paso, TX
- Population (ZIP)
- 14,715
- Household income
- $37,155
- Rent vs Own
- Severe rent burden
- 668.0
Population outlook (El Paso County) Hauer SSP2
- Today (2025)
- 897,899 people
- By 2030
- 922,694 · +2.8%
- By 2040
- 960,492 · +7.0%
- By 2050
- 982,919 · +9.5%
- By 2075
- 997,266 · +11.1%
- By 2100
- 900,630 · +0.3%
Race, ethnicity, and origin ACS 2023
- Neighborhood character
- Predominantly Hispanic (94%)
- Race & ethnicity
- Hispanic / Latino 94% Two or more races 48% White 6% Native American 1%
- Hispanic origin (detail)
- Mexican 92%
- Common ancestry
- Lithuanian 1%
- Foreign-born
- 29% · Canada
- Languages at home
- 21% English-only · Spanish 79%
Political lean MEDSL · El Paso
- 2024 margin
- D (+15.1) · D 57.0% · R 41.8% · Other 1.2%
- 2008→2024 swing
- -17.4pp toward R · 2008: 32.5pp · 2024: 15.1pp
- All cycles
- 2024: D+15.1 2020: D+35.1 2016: D+43.2 2012: D+32.6 2008: D+32.5
Not yet ingested
- Civics
- —
Market trends
- HPI YoY
- ▼ -64.90%
- Current HPI
- 240.6886
- Rent YoY
- ▲ 0.91%
- Metro
- El Paso, TX
- State GDP YoY
- ▲ 3.95%
- F500 in state
- 110
Industry mix (Fortune 500 HQ in TX)
| Industry | F500 HQs | Revenue |
|---|---|---|
| Energy | 16 | $1,198B |
|
||
| Technology | 5 | $198B |
|
||
| Engineering / Construction | 4 | $72B |
|
||
| Energy Services | 3 | $60B |
|
||
| Utilities | 3 | $41B |
|
||
| Healthcare | 2 | $330B |
|
||
Price history
2 events — show timeline
- 2025-12-17 Pending — GEPARMLS
- 2025-12-11 Listed $90,000 GEPARMLS
Property tax history
+4.5%/yrLatest (2025): $4,877 · +12.1% YoY. Source: county tax records.
Cash-flow waterfall
monthlySold comps — $/sqft
last 12 mo · ≤1 miLoading sold comps…